Introduction
Air quality indices are widely used in environmental reporting systems to communicate pollutant monitoring results in a simplified and standardized format. Instead of presenting only raw concentration values in technical units, an air quality index (AQI) converts measured pollutant concentrations into a standardized numerical indicator that is typically published alongside category labels and colour-coded reporting bands. AQI values are produced through formal calculation procedures that use pollutant-specific breakpoints, sub-index conversion rules, and aggregation logic defined by reporting institutions. [1]
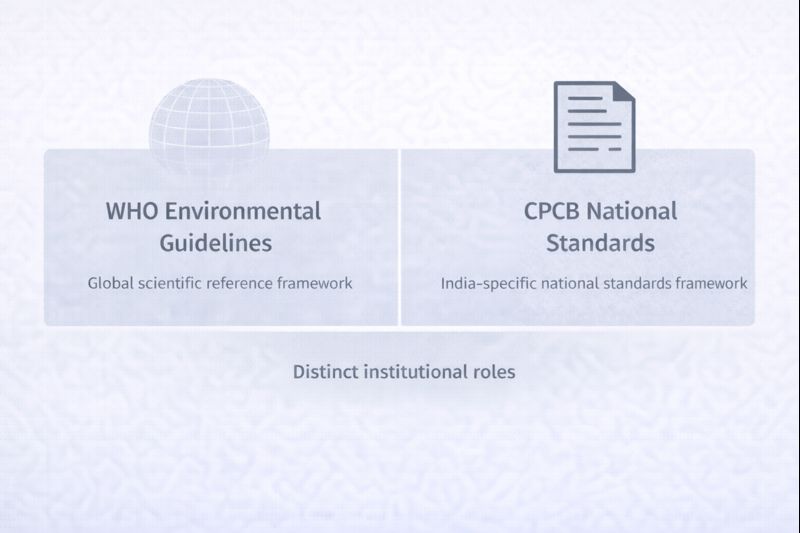
In India, AQI reporting is structured through institutional monitoring and reporting frameworks coordinated by agencies such as the Central Pollution Control Board (CPCB). The Indian National Air Quality Index (NAQI) provides a standardized system for converting monitored pollutant concentrations into AQI outputs that can be disseminated through national dashboards and public reporting platforms. [3]
This explainer describes the measurement-to-reporting structure through which AQI values are produced, focusing on pollutant monitoring inputs, sub-index computation, breakpoint mapping, aggregation rules, and institutional dissemination systems used in India.
This article is provided for informational and educational purposes only. It does not provide medical advice, health guidance, legal interpretation, or policy recommendations.
Scope note: This explainer describes AQI measurement and reporting structure in India based on CPCB-linked NAQI methodology and institutional dissemination systems.
How AQI is Calculated in India (Simple Explanation)
AQI (Air Quality Index) is calculated by converting the concentration of different air pollutants into a single number that represents overall air quality.
Here’s the process in simple terms:
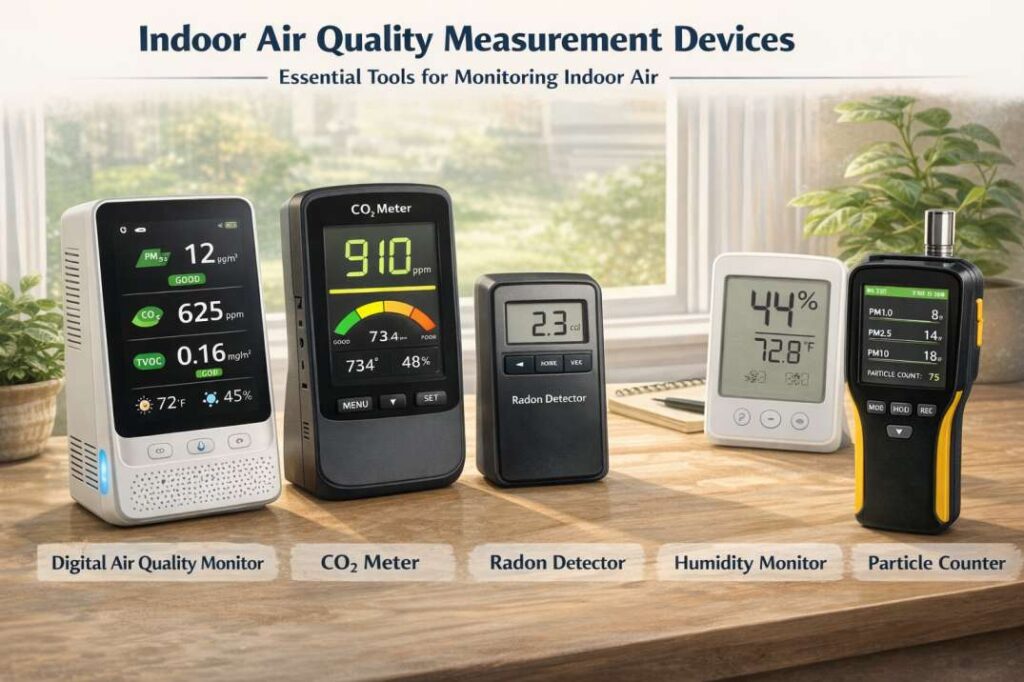
- Air quality monitoring stations measure pollutants such as PM2.5, PM10, NO₂, SO₂, CO, and ozone
- Each pollutant concentration is converted into an AQI sub-index using standard breakpoints
- The highest sub-index value is selected as the final AQI
👉 In simple words: the pollutant with the worst level determines the AQI.
For example, even if most pollutants are low, a high PM2.5 level can push the AQI into the “Poor” or “Severe” category.
What an Air Quality Index Represents
Note: Conceptual figure created for educational explanation based on CPCB NAQI methodology and reporting documentation.
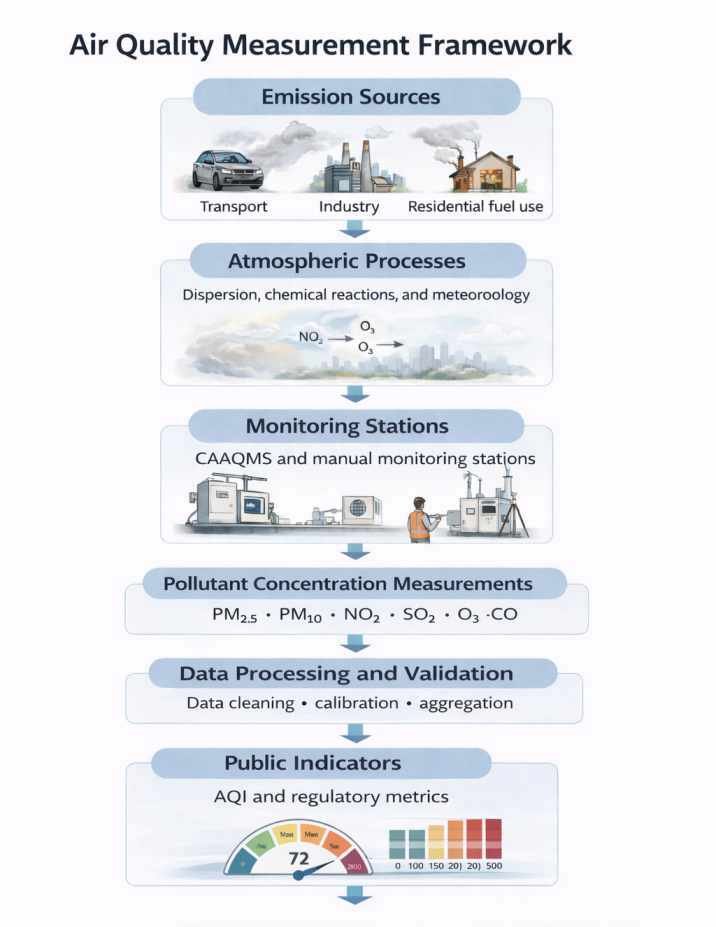
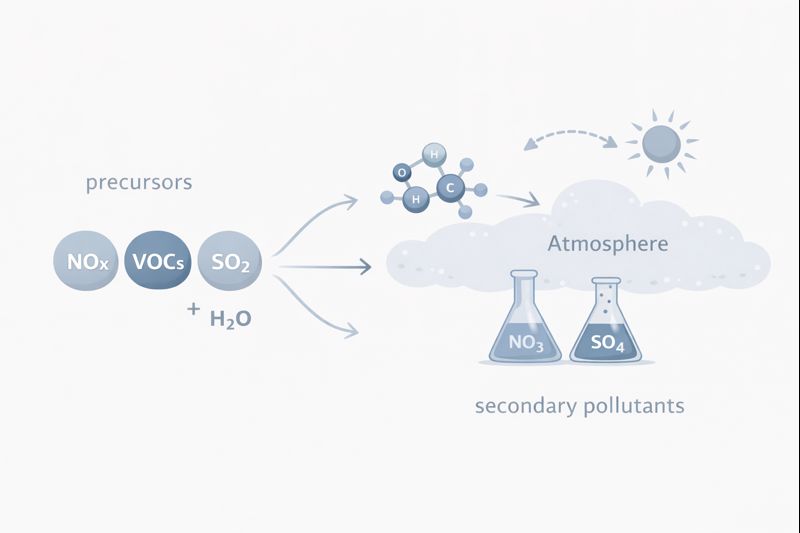
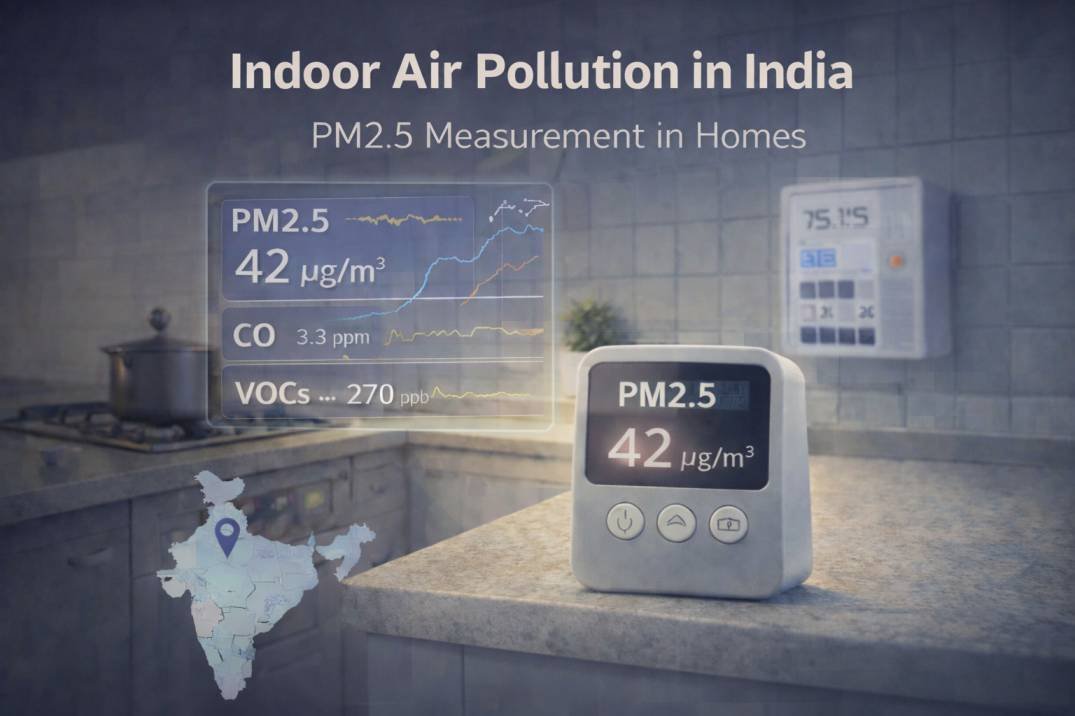
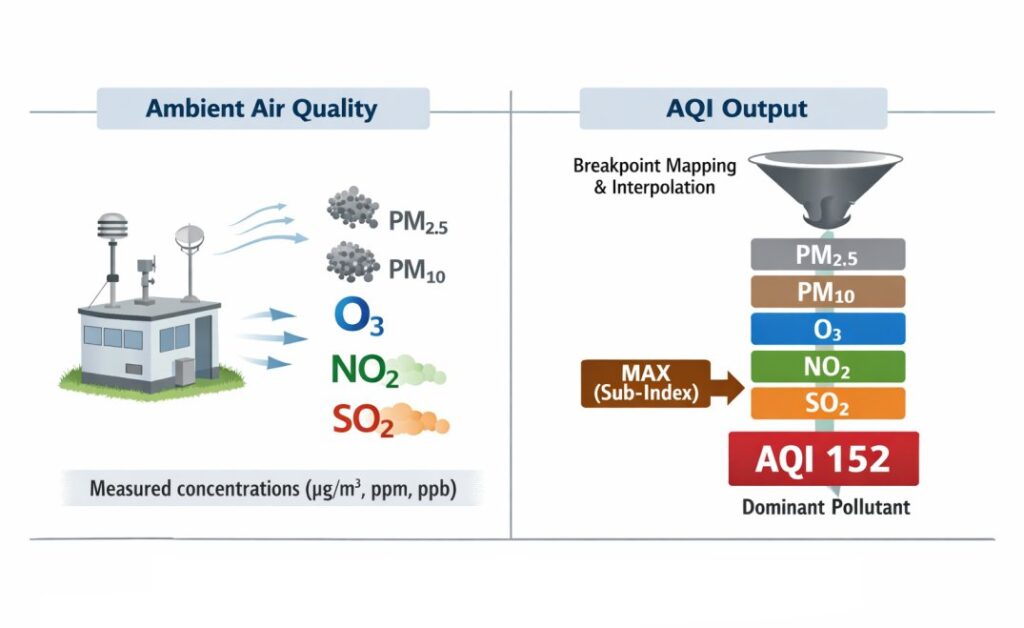
An AQI is a reporting framework derived from ambient pollutant monitoring datasets, designed to summarize multi-pollutant measurements into a standardized indicator. These measurements generate numerical concentration values expressed in pollutant-specific units. Particulate matter concentrations are typically expressed in micrograms per cubic metre (µg/m³), while gaseous pollutants are commonly expressed as volumetric mixing ratios such as parts per million (ppm) or parts per billion (ppb). [3]
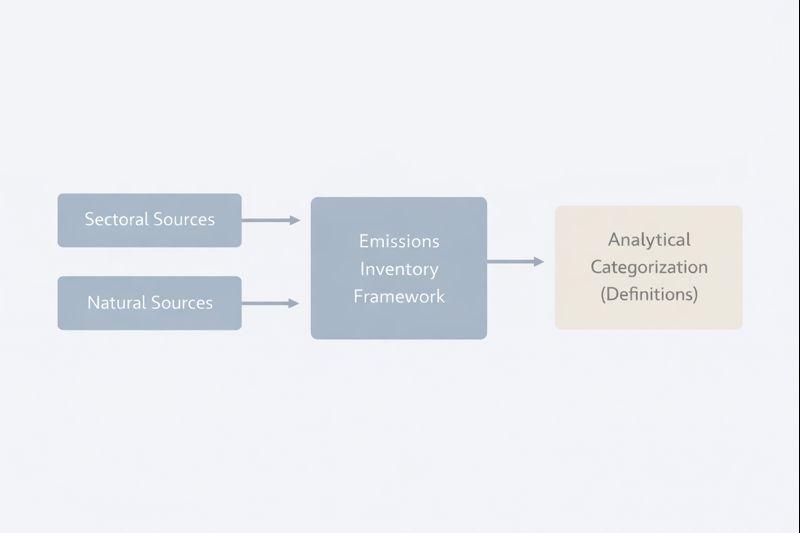
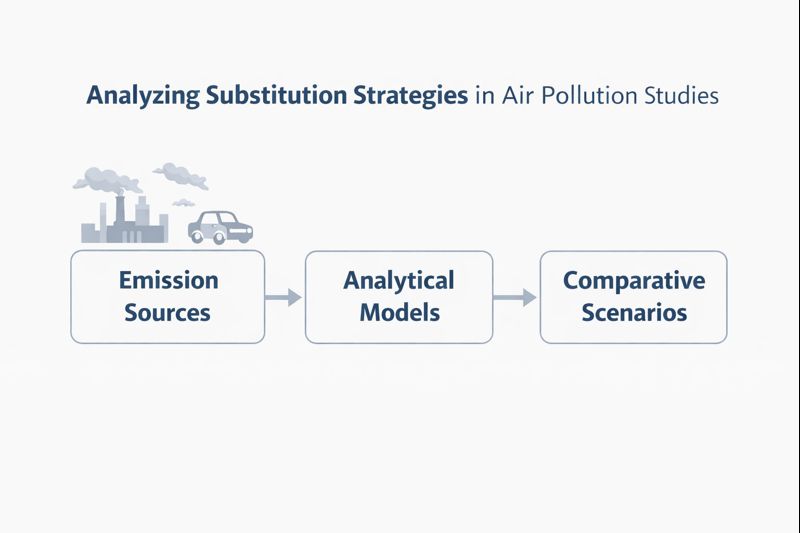
To understand how pollution sources are estimated before AQI reporting, see our guide on emission inventory in India.
An AQI does not directly reproduce the full underlying pollutant dataset. Instead, it functions as a standardized reporting output derived from measured pollutant concentrations through a defined conversion process. This process typically converts pollutant concentrations into pollutant-specific sub-index values, which are then aggregated into a single reported AQI value according to rules specified in the institutional methodology. [3]
Illustrative schematic (reporting logic): Ambient monitoring stations measure pollutant concentrations, which are mapped into pollutant sub-indices using breakpoint tables. These sub-indices are then combined using an aggregation rule (commonly the maximum sub-index method) to generate a final AQI output. [3][5]
Why Indices Are Used in Environmental Communication
Air pollution monitoring produces multi-pollutant datasets that vary by location, season, and time of day. Pollutant concentrations are reported in different measurement units and across different concentration ranges, which can make direct public comparison difficult without technical interpretation. AQI frameworks provide a standardized reporting scale that translates pollutant concentration values into a common numerical format, enabling monitoring results to be communicated in a consistent manner across locations. [3]
In institutional reporting systems, AQI values are commonly used for public dashboards and summary reporting. In parallel, pollutant concentration datasets remain central to technical assessment and regulatory documentation, where detailed pollutant time-series records are required. [3][4]
The Role of Pollutant Selection in Index Design
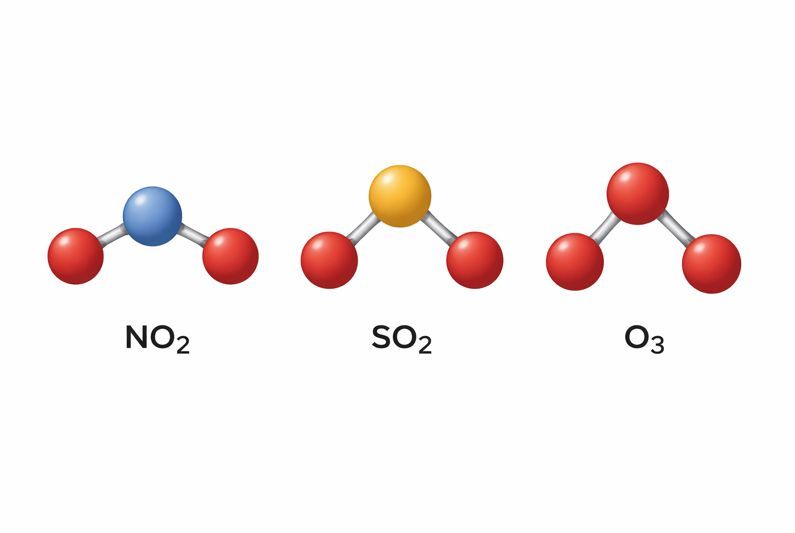
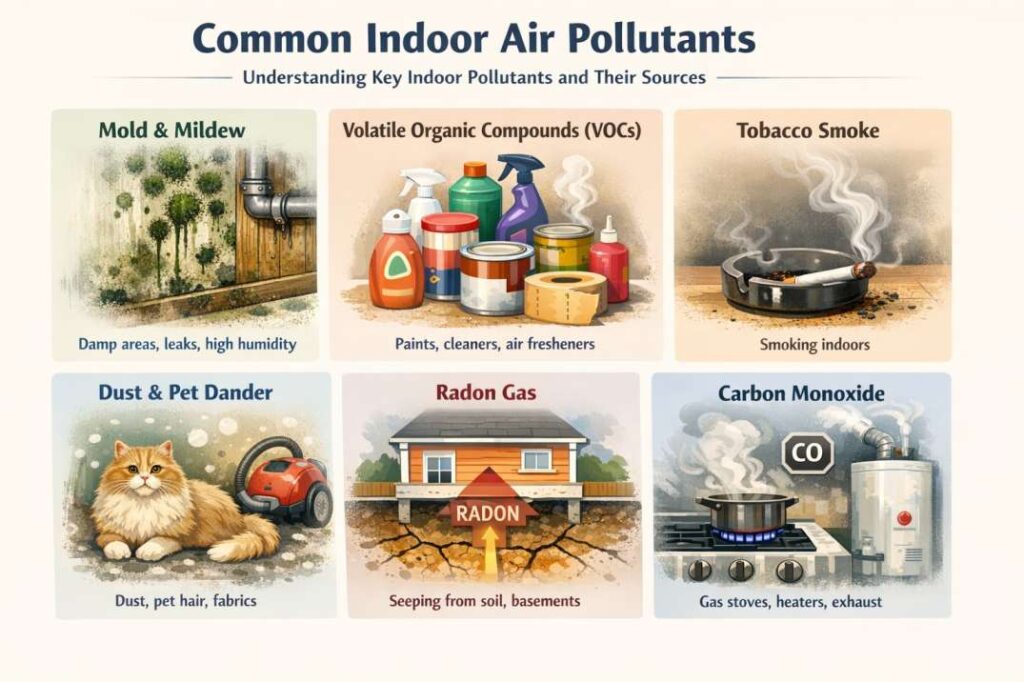
AQI systems depend on the set of pollutants included as calculation inputs. Many national AQI frameworks focus on pollutants that are widely monitored and have established institutional reporting standards. Common AQI input pollutants include particulate matter (PM₂.₅ and PM₁₀) and gaseous pollutants such as ozone (O₃), nitrogen dioxide (NO₂), sulfur dioxide (SO₂), and carbon monoxide (CO). [3]
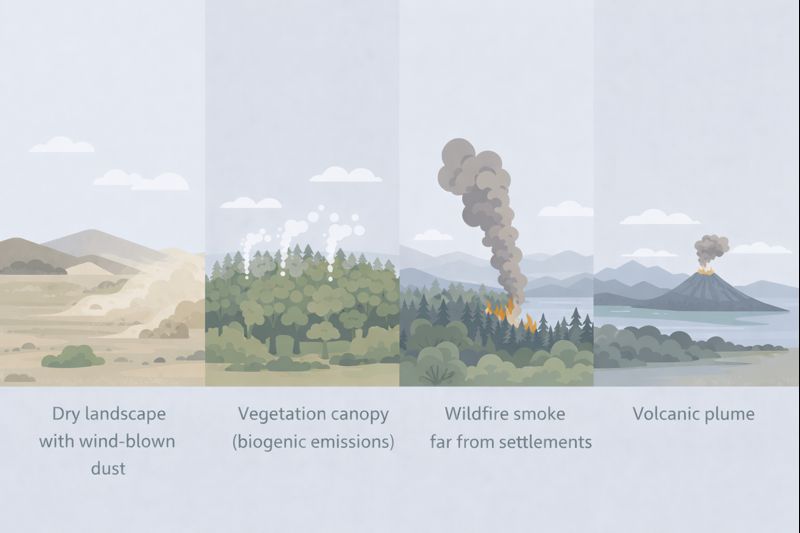
The pollutant set included in an AQI framework reflects both scientific relevance and the operational feasibility of routine monitoring and standardized reporting. Pollutants that may be present in ambient air are not necessarily included if monitoring coverage is limited, if measurement methods are not standardized for routine reporting, or if breakpoint tables are not formally defined within the reporting framework. [2][3]
Because AQI values are calculated from available monitoring data, AQI outputs may differ depending on which pollutants are measured at specific monitoring sites. If a monitoring station does not report all pollutants included in the national AQI framework, AQI calculation may rely on the subset of pollutants for which valid measurements exist during the reporting period. [3][4]
How Air Quality Indices Are Structured (Calculation Logic and Components)
Note: Conceptual figure created for educational explanation based on CPCB NAQI methodology and reporting documentation.
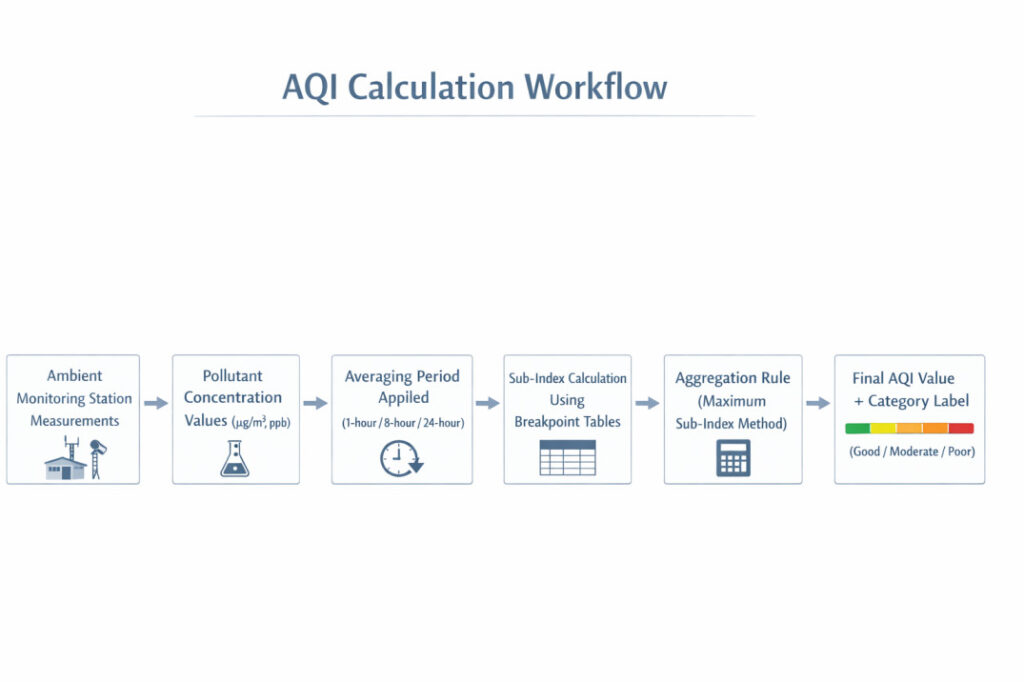
AQI systems follow a structured workflow that converts pollutant concentration measurements into a standardized reporting indicator. While calculation details differ across countries, many AQI frameworks follow a common sequence: pollutant concentrations are measured, converted into pollutant sub-indices using breakpoint tables, and aggregated into a single AQI value published with standardized reporting categories. [3]
Core Inputs: Pollutant Concentration Data
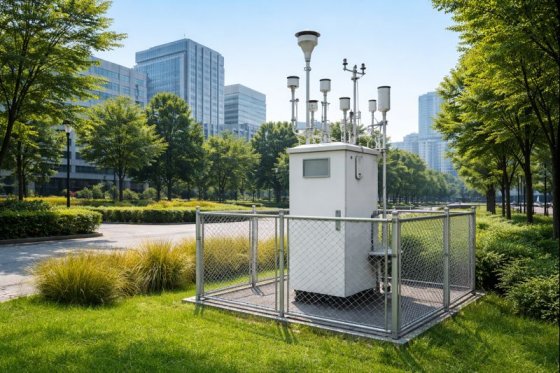
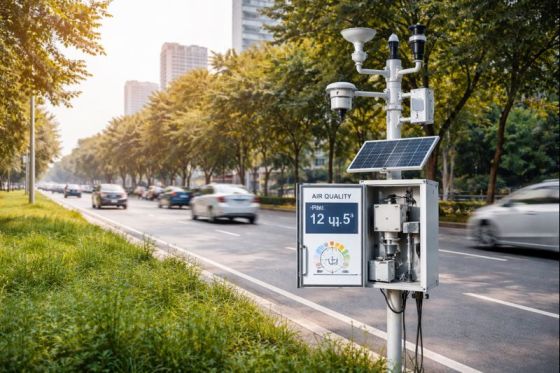
The foundation of AQI reporting is pollutant concentration data generated through ambient monitoring stations. AQI frameworks generally rely on pollutants that are routinely monitored and widely recognized in regulatory reporting systems. Common AQI input pollutants include:
AQI values are therefore derived from pollutant measurements generated through air quality monitoring networks. For a broader explanation of how these monitoring technologies operate across India, see our guide Air Pollution Monitoring Systems in India.
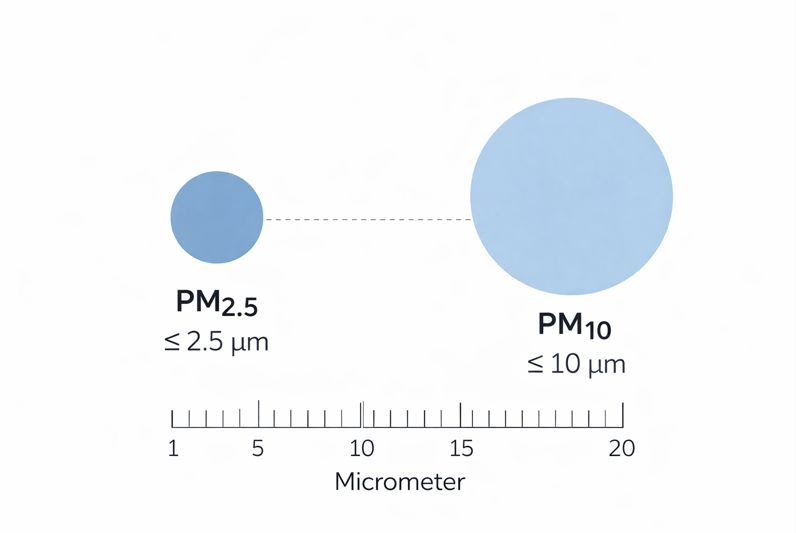
- PM₂.₅ (fine particulate matter)
- PM₁₀ (coarse particulate matter)
- O₃ (ozone)
- NO₂ (nitrogen dioxide)
- SO₂ (sulfur dioxide)
- CO (carbon monoxide)
Pollutant concentrations are expressed in units appropriate to their physical form. Particulate matter is typically measured as mass concentration (µg/m³), while gaseous pollutants are commonly measured in ppm or ppb depending on reporting convention. [2][3]
A detailed overview of major monitored pollutants is explained in Criteria Pollutants Explained: PM₂.₅, PM₁₀, NO₂, SO₂, and O₃.
Averaging times and reporting intervals
AQI values are shaped not only by pollutant concentration levels but also by the averaging period applied to measured observations. Monitoring stations may generate continuous or periodic measurements, but AQI methodologies generally specify standardized averaging intervals to ensure comparability and consistent reporting. [1][3]
Common averaging periods used in AQI reporting include:
- Hourly averages (often used for near real-time reporting)
- 8-hour averages (commonly applied to ozone and carbon monoxide in some systems)
- 24-hour averages (commonly applied to particulate matter and certain gases) [1][3]
The averaging interval specified in the AQI methodology influences how pollutant concentrations are converted into sub-index values and how frequently AQI values can be updated on public reporting platforms. [1][3]
Sub-Index Formation and Breakpoint Tables
AQI systems typically do not combine pollutant concentrations directly. Instead, each pollutant concentration is converted into a pollutant-specific sub-index value. A sub-index is the pollutant-specific AQI score calculated by mapping a measured concentration onto the AQI scale using breakpoint interpolation rules. This conversion enables pollutants measured in different units and concentration ranges to be expressed using a standardized reporting format. [1][3]
In NAQI reporting practice, sub-indices are calculated separately for each monitored pollutant before aggregation into a final AQI value. [1]
Sub-index calculation is performed using breakpoint tables, which define concentration intervals and their corresponding AQI bands. Breakpoints are regulator-defined concentration intervals listed in AQI methodology tables that map pollutant concentration ranges to AQI bands. These tables specify how measured concentration values are translated into standardized index scores. [1][5]
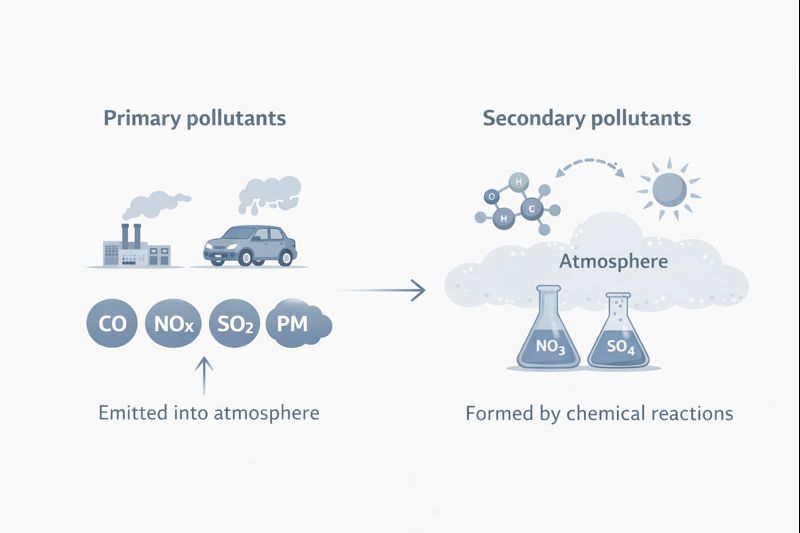
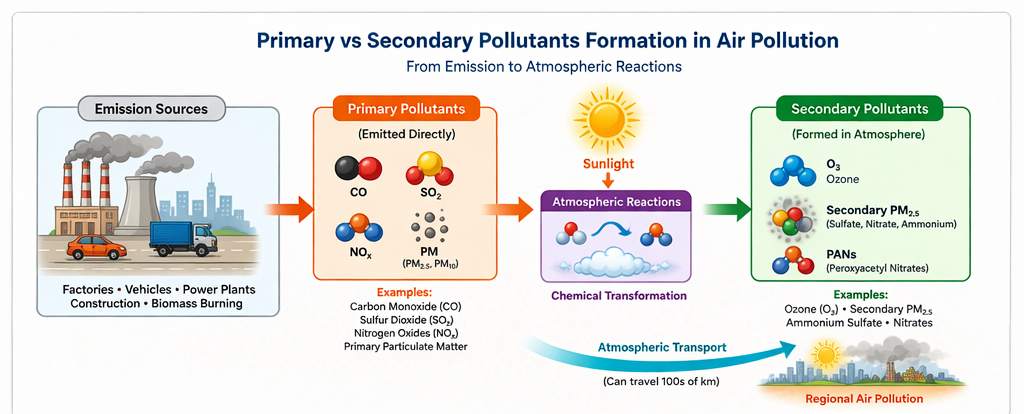
For pollutant classification context, see Classification of Air Pollutants: Primary vs Secondary Pollutants.
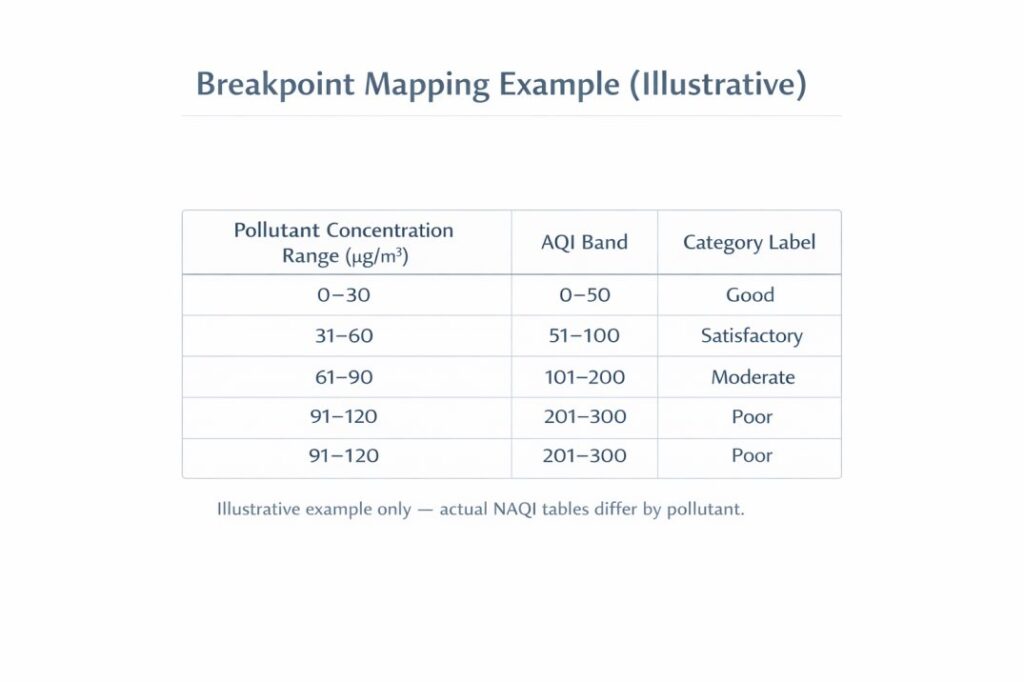
Note: Conceptual figure created for educational explanation based on CPCB NAQI methodology and reporting documentation.
In India’s NAQI framework, pollutant-wise breakpoint concentration intervals are specified in CPCB methodology tables used for AQI category mapping. [1]
In many AQI frameworks, concentration-to-sub-index conversion is performed through interpolation within predefined breakpoint intervals. Under this procedure, pollutant concentration values are mapped proportionally onto the AQI scale band in which they fall. As a result, AQI sub-index values represent structured reporting outputs derived through formal mapping rules rather than raw measurements. [1]
In India, breakpoint structures and pollutant categories are specified under CPCB-coordinated NAQI documentation. [1]
AQI Calculation Formula
The AQI sub-index for each pollutant is calculated using a standard interpolation formula based on breakpoint ranges:
AQI sub-index is calculated using the formula:
I = [(IHI − ILO) / (CHI − CLO)] × (C − CLO) + ILO
Where:
IHI, ILO = AQI breakpoints
C = pollutant concentration
I = AQI value
CHI, CLO = concentration breakpoints
Aggregation Rules: How the Final Index Value Is Determined
Maximum sub-index approach (dominant pollutant logic)
Many national AQI systems generate the final AQI value using a maximum sub-index approach, in which the overall AQI is determined by the pollutant with the highest calculated sub-index during the reporting period. The pollutant producing this highest sub-index is reported as the dominant pollutant, and its value defines the published AQI category under the maximum sub-index rule. [1]
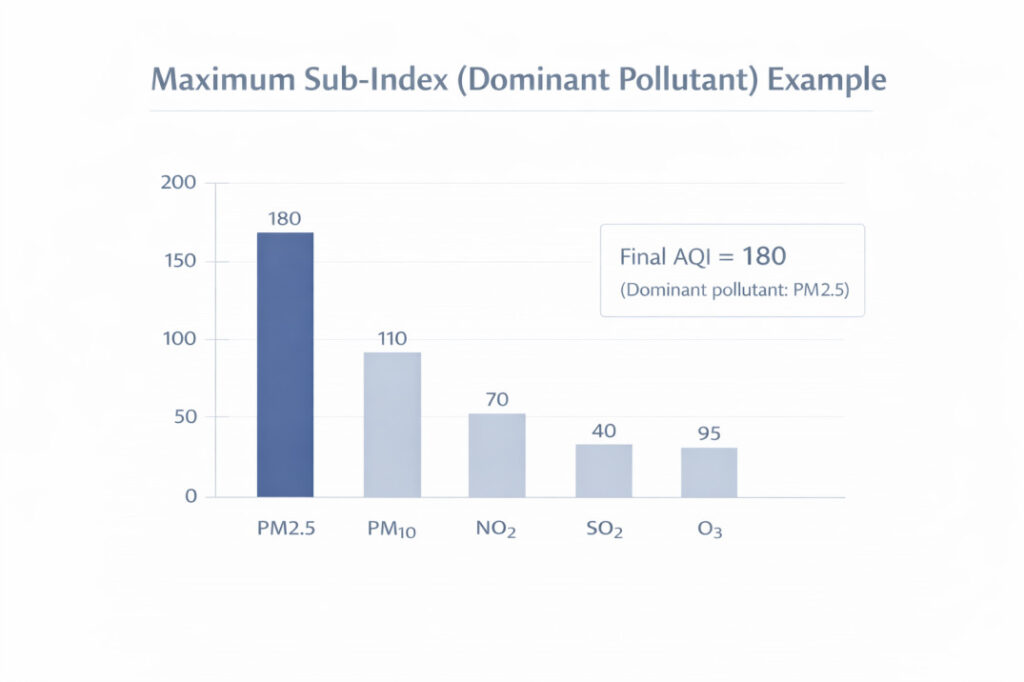
Note: Conceptual figure created for educational explanation based on CPCB NAQI methodology and reporting documentation.
Under CPCB’s National Air Quality Index (NAQI) framework, the reported AQI corresponds to the maximum calculated sub-index among available pollutant sub-indices for the reporting interval, consistent with dominant pollutant reporting in NAQI dissemination systems. [1]
This aggregation design allows reporting platforms to publish a single standardized AQI value while retaining pollutant-specific information through identification of the dominant pollutant. [1]
Category Labels and Color Scales
AQI values are commonly disseminated through standardized reporting categories and colour-coded bands that divide the numerical AQI range into interpretive groups. These category labels provide a consistent reporting framework that allows AQI values to be communicated in simplified form through dashboards and public reporting systems. [1]
In India, NAQI reporting uses standardized category labels such as Good, Satisfactory, Moderate, Poor, Very Poor, and Severe, each associated with defined numerical AQI ranges. These categories are formally specified under CPCB-coordinated NAQI guidance. [1]
AQI Categories in India
| AQI Range | Category | Health Impact |
|---|---|---|
| 0–50 | Good | Minimal impact |
| 51–100 | Satisfactory | Minor breathing discomfort |
| 101–200 | Moderate | Breathing discomfort |
| 201–300 | Poor | Respiratory illness |
| 301–400 | Very Poor | Serious health effects |
| 401–500 | Severe | Health emergency |
👉 Higher AQI values indicate worse air quality and greater potential health risk.
Institutional Context: India’s AQI Framework and Reporting Systems
India’s AQI reporting system is shaped by institutional arrangements for air quality monitoring and data dissemination. While AQI values are reported as a single standardized indicator, the reporting process depends on monitoring station infrastructure, pollutant measurement availability, and standardized calculation rules. The NAQI framework provides the formal structure for converting pollutant monitoring data into AQI outputs that can be published consistently across reporting locations. [3]
The Indian National Air Quality Index (NAQI) Structure
India’s National Air Quality Index (NAQI) is structured through guidance developed under CPCB coordination. The framework is designed to standardize AQI reporting across Indian cities by converting pollutant concentration measurements into pollutant-wise sub-indices and a final AQI output. [3]
The NAQI system includes multiple pollutants as potential index inputs. Depending on monitoring availability, NAQI reporting may incorporate PM₂.₅, PM₁₀, ozone (O₃), nitrogen dioxide (NO₂), sulfur dioxide (SO₂), carbon monoxide (CO), ammonia (NH₃), and lead (Pb). These pollutants reflect the structure of national monitoring programmes and the broader institutional reporting framework used in India. [1]
The NAQI framework defines standardized AQI categories expressed through numerical ranges and descriptive labels. These reporting bands support consistent communication across monitoring jurisdictions by allowing AQI values from different cities to be published using a shared scale. [3][4]
Monitoring Networks Underlying AQI Reporting
Continuous monitoring (CAAQMS) and reporting frequency
Near real-time AQI reporting in India relies substantially on data generated through Continuous Ambient Air Quality Monitoring Stations (CAAQMS). These stations use automated analyzers to measure pollutant concentrations at high temporal resolution, often producing hourly observations. In CPCB-linked reporting systems, monitoring datasets are typically subjected to data screening and validation procedures before AQI computation and dashboard publication. [4][6]
CAAQMS-based reporting supports frequent AQI updates and allows AQI values to be published as continuous time-series datasets through institutional reporting platforms. CPCB reporting portals and linked public dashboards commonly use such datasets as the basis for real-time AQI display. [4][6]
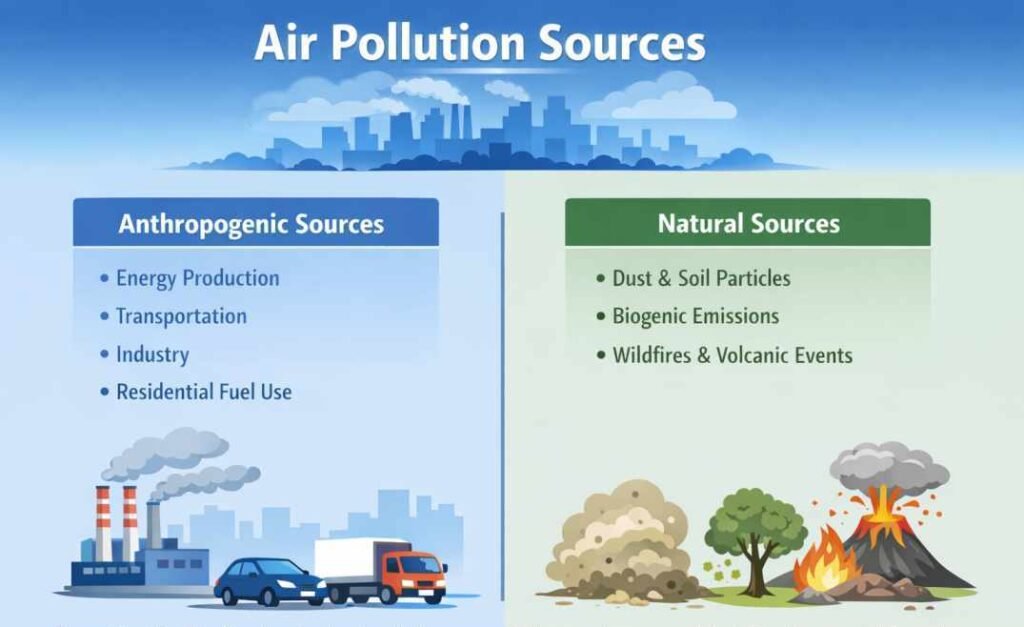
Sectoral contributors influencing monitoring priorities are discussed in Sources of Air Pollution: Sectoral and Natural Contributors.
Manual monitoring and delayed reporting constraints
India’s monitoring architecture also includes manual and semi-continuous monitoring systems based on periodic sampling and laboratory analysis. These monitoring formats contribute to broader pollutant concentration datasets used in institutional reporting systems and longer-term monitoring programmes. [3][4]
Because manual monitoring often requires post-sampling laboratory analysis, reporting intervals may be less frequent than continuous monitoring systems. As a result, different monitoring station types may contribute differently to real-time reporting systems and long-term institutional datasets.
Public Platforms and Data Dissemination
AQI values in India are disseminated through multiple institutional reporting channels. CPCB operates national-level dashboards that aggregate monitoring station outputs and publish AQI values for reporting locations. AQI values may also be disseminated through State Pollution Control Boards (SPCBs) and regional reporting platforms. [4][6]
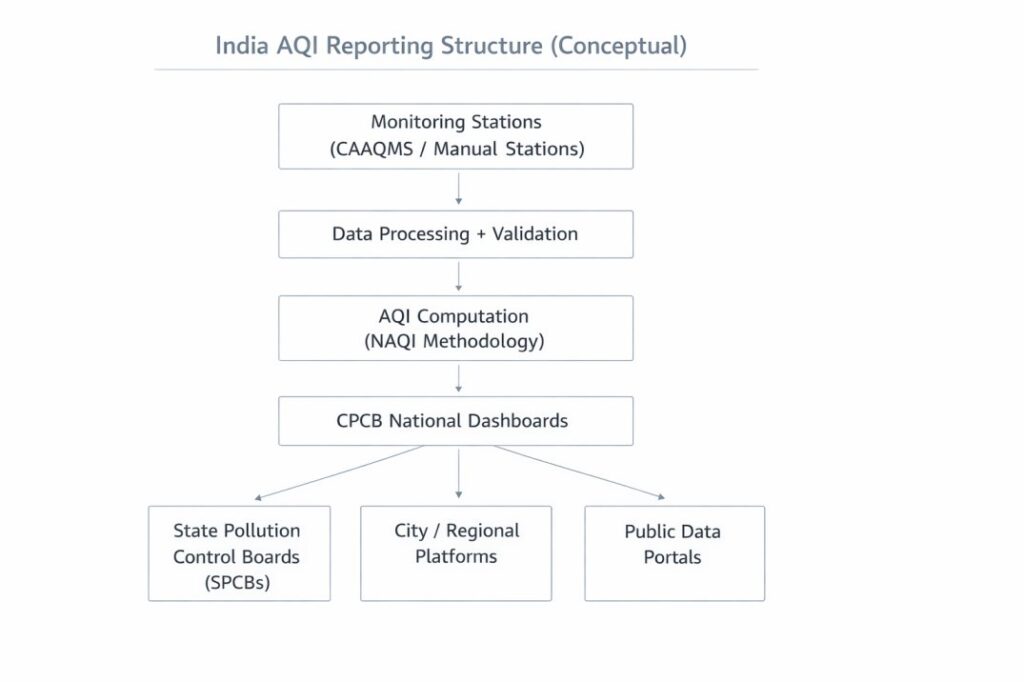
Note: Conceptual figure created for educational explanation based on CPCB NAQI methodology and reporting documentation.
Public reporting systems typically present AQI values as the primary standardized indicator, while also providing pollutant concentration values for monitored pollutants where available. The AQI is commonly used as the dominant reporting metric because it provides a standardized numerical scale and category framework that supports simplified comparison across reporting locations. [1]
Why AQI Coverage Varies Across Cities and Regions
AQI reporting coverage in India varies due to differences in monitoring station density and pollutant measurement availability. Cities with more monitoring stations and continuous measurement infrastructure can generate more frequent AQI updates, while areas with fewer monitoring stations may have fewer available observations for reporting. [4][6]
In reporting practice, AQI values may be calculated using only pollutants for which valid concentration measurements are available at a given monitoring station. If pollutants are not measured at a site or if data completeness requirements are not met for a reporting interval, those pollutants may not be included in the AQI calculation output for that time period. This demonstrates that AQI reporting outputs depend on pollutant measurement availability, data completeness requirements, and validation procedures applied during the reporting interval. [1][4]
Because AQI values are produced through standardized calculation rules applied to available monitoring data, monitoring infrastructure availability influences where AQI values can be published consistently and how frequently reporting platforms can update AQI values across regions. [3][4]
Conclusion
Air quality indices function as standardized reporting indicators derived from ambient pollutant monitoring data. AQI systems translate measured pollutant concentrations into pollutant-specific sub-index values using breakpoint tables and interpolation rules, after which a final AQI value is generated through aggregation logic such as the maximum sub-index method. This reporting structure enables pollutant concentration datasets measured in different units and ranges to be communicated through a unified numerical scale and standardized category labels. [1]
In India, AQI reporting is formally structured under the National Air Quality Index (NAQI) framework coordinated by the Central Pollution Control Board. AQI values are disseminated through institutional reporting platforms and dashboards that draw on monitoring networks such as Continuous Ambient Air Quality Monitoring Stations (CAAQMS) as well as other monitoring formats used in national air quality reporting systems. The published AQI value therefore represents a standardized reporting output derived from measured pollutant concentration datasets through an institutionally defined calculation and dissemination process. [3][6]
Sources
- Central Pollution Control Board (CPCB)
- Ministry of Environment, Forest and Climate Change (MoEFCC)
- World Health Organization (WHO)
References
[1] Central Pollution Control Board (CPCB), Government of India. National Air Quality Index (NAQI): Technical Methodology and Reporting Categories. https://cpcb.nic.in/National-Air-Quality-Index/
[2] World Health Organization (WHO). Air Quality Standards and WHO Global Air Quality Guidelines Resources. https://www.who.int/tools/air-quality-standards
[3] Central Pollution Control Board (CPCB), Government of India. Air Quality Index (AQI) – National Overview and Reporting Framework. https://cpcb.nic.in/air-quality-management/
[4] Central Pollution Control Board (CPCB), Government of India. AQI Bulletin and Real-Time Air Quality Data. https://cpcb.nic.in/aqi_bulletin.php
[5] System of Air Quality Forecasting and Research (SAFAR), IITM. AQI Details and Sub-Index Methodology. https://safar.tropmet.res.in/AQI-47-12-Details
[6] Central Pollution Control Board (CPCB), Government of India. Real-Time Air Quality Index (AQI) Portal (India). https://airquality.cpcb.gov.in/AQI_India_Iframe/
[7] CPCB. National Air Monitoring Programme (NAMP). https://cpcb.nic.in/about-namp/
[8] CPCB. Continuous Ambient Air Quality Monitoring Stations (CAAQMS) programme documentation / portal description. https://airquality.cpcb.gov.in/ccr/#/login
Last updated: March 2026