Groundwater Crisis in India: map showing regions with severe water depletion and scarcity.

Groundwater Crisis in India 2030 (भारत में भूजल संकट): Causes, Impacts & Solutions

Groundwater Crisis in India 2030 (भारत में भूजल संकट 2030)

Nearly 80% of India’s drinking water and more than half of irrigation depend on groundwater — but this hidden lifeline is drying up fast. India extracts nearly 25% of the world’s groundwater (World Bank Report), yet 60% of wells show declining levels (Central Ground Water Board, India). By 2030, demand is expected to double while recharge remains limited, creating a severe भूजल संकट (groundwater crisis) (NITI Aayog Composite Water Management Index 2018).

This emergency affects both rural farmers and urban cities. Chennai, Bengaluru, and Delhi have already faced shortages (UNICEF Report), while drought-prone Bundelkhand and Marathwada struggle with falling aquifers. Pollution makes things worse — fluoride in Rajasthan, arsenic in Bihar & West Bengal, and nitrate contamination threaten safe drinking water for millions (Ministry of Jal Shakti – Water Quality Reports).

👉 In short, groundwater depletion is not just about scarcity — it endangers food security, public health, urban resilience, and climate adaptation.
But there is hope. Through traditional wisdom (पारंपरिक समाधान) like johads, modern technology (आधुनिक तकनीक) like AI and IoT, and strong water policies (मजबूत नीतियां), India can secure its aquifers for future generations.

The Depth of the Groundwater Crisis in India

Why Groundwater Matters for India’s Future

Groundwater is more than just a hidden reserve—it is the backbone of India’s water security. Nearly 80% of rural households and 50% of urban households depend on it for drinking and domestic use. Agriculture, the country’s largest employer, relies heavily on groundwater for irrigation, particularly for water-intensive crops like rice, sugarcane, and wheat. Industries—from textiles to pharmaceuticals—also depend on steady access to underground aquifers.

  • India extracts 25% of global groundwater withdrawals.
  • Over 60% of wells show declining water levels.
  • 80% of rural households rely on groundwater for daily use.

India extracts nearly 25% of the world’s groundwater — more than any other nation. This scale of dependence makes the crisis not just a local emergency but a global issue, with consequences for food trade, climate resilience, and regional stability. Such an enormous share of global groundwater extraction means India’s water stress has international implications, affecting food supply chains, climate resilience, and regional stability.

Realistic illustration of India’s groundwater crisis showing a farmer in a cracked field, a woman with empty pots at a dry handpump, city industries in the background, and underground cross-section of depleting aquifers.
The depth of India’s groundwater crisis — farmers, households, and industries depend on sinking aquifers.

Why Aquifers Are Collapsing: Causes of India’s Water Shortage

India’s aquifers are collapsing under pressure. More than 60% of monitored wells now show falling water levels, forcing farmers to drill deeper and spend more on pumps and energy. Over-extraction, combined with erratic rainfall and shrinking wetlands, has created a dangerous imbalance — groundwater is being used faster than it can naturally recharge. In many regions, aquifers are being depleted faster than they can naturally replenish.

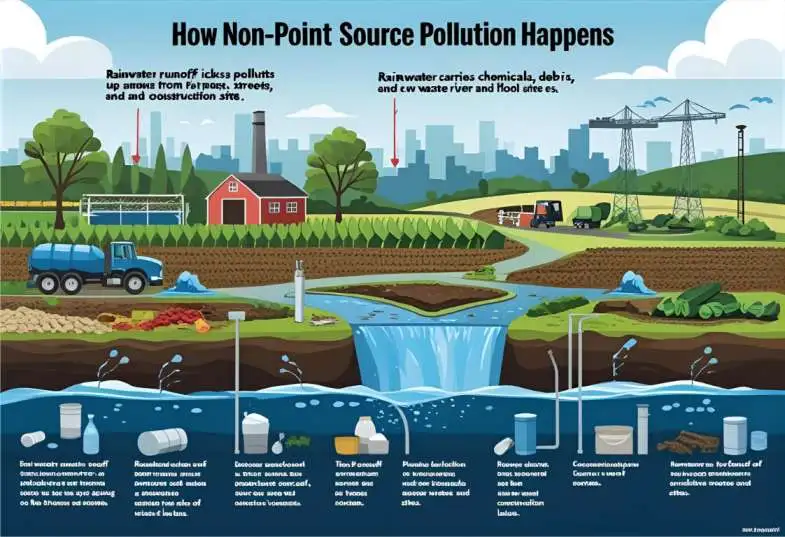
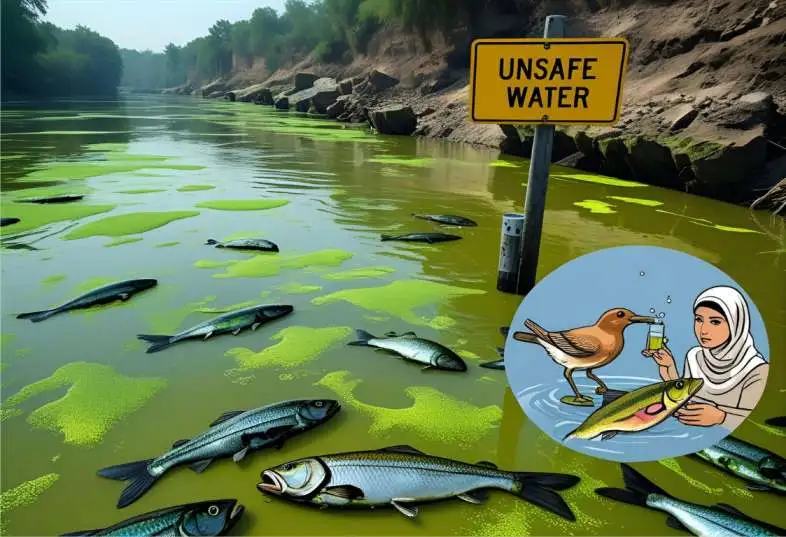
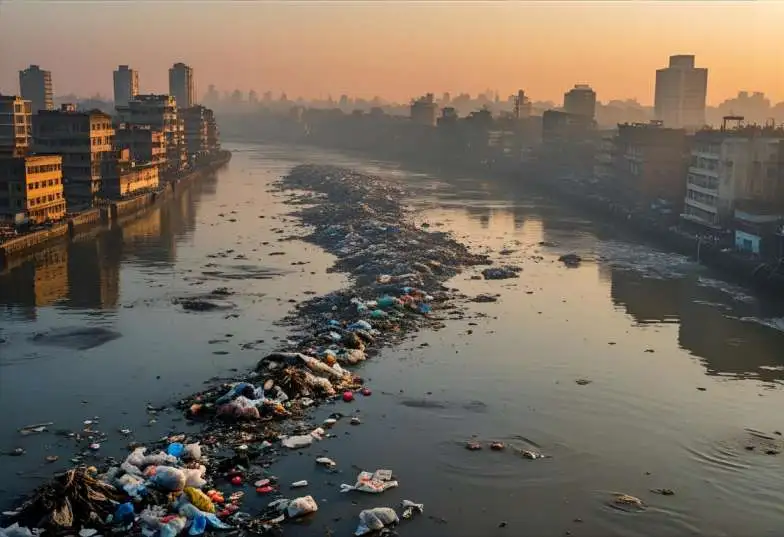
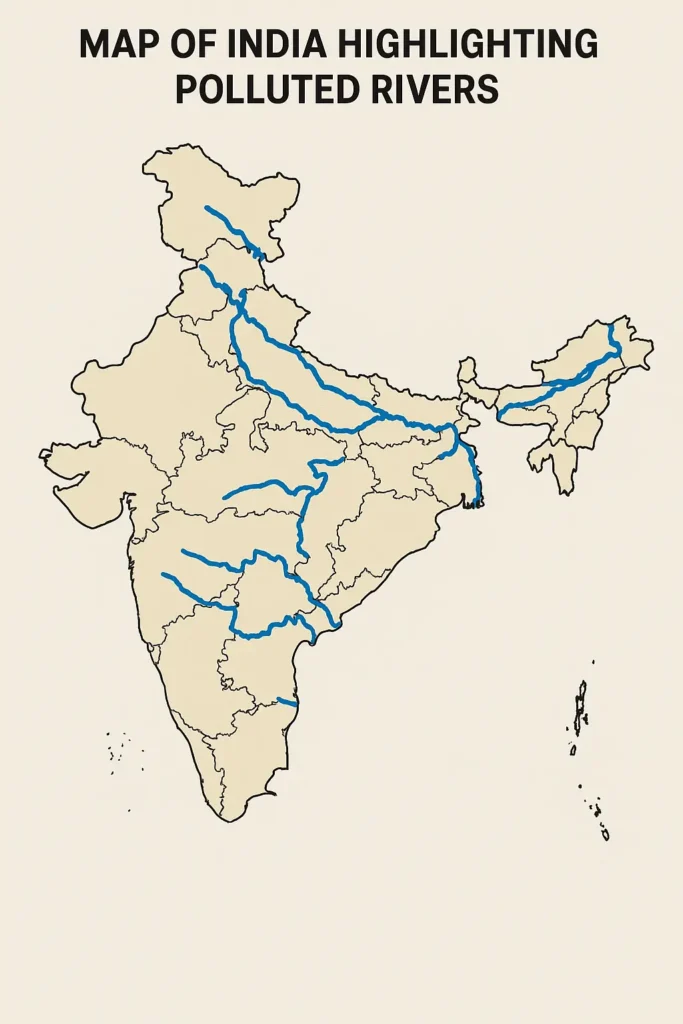
Pollution adds another layer of urgency. Fluoride contamination in Rajasthan and Andhra Pradesh, arsenic poisoning in West Bengal and Bihar, and nitrate pollution from excessive fertilizer use are compromising drinking water quality for millions — and this groundwater contamination is one of the 8 major types of water pollution

This section is for educational purposes only and should not be used as medical or water-quality advice. For region-specific water safety concerns, consult certified health authorities or local water departments.

The human impact is stark. In 2019, Chennai experienced a “Day Zero” when reservoirs and aquifers ran dry, forcing residents to depend on water tankers. In Bundelkhand, falling groundwater tables have contributed to repeated droughts, pushing farmers into debt and migration. These cases are not isolated—they are signals of a deepening national crisis.

Groundwater depletion threatens three essentials: food production, urban water security, and social stability. Without timely intervention, India risks a future where water scarcity becomes the defining barrier to development.

Farmers, Cities, and Families: The Human Toll of Aquifer Depletion

Impact on Farmers and Food Security

For India’s farmers, groundwater is both a lifeline and a trap. In states like Punjab and Haryana, decades of over-reliance on groundwater for rice and wheat cultivation have created a cycle of falling water tables and rising production costs. As aquifers decline, farmers are forced to drill deeper wells, invest in expensive pumps, and consume more energy—all of which increase debt burdens. Small and marginal farmers, who lack access to capital, are the hardest hit.

The ripple effects extend to food security. Declining water tables reduce yields, particularly of staple crops that underpin India’s food distribution system. A water crisis in agricultural regions does not remain local—it threatens national food supply chains and the affordability of basic staples.

Farmer struggling with dry borewell and urban households collecting water from tankers due to groundwater depletion.
Groundwater depletion affects farmers and urban households alike.

Impact on Cities and Households

Urban India is not insulated from the crisis. Cities like Bengaluru and Delhi rely heavily on groundwater to meet growing population demands. As aquifers dry up, municipal bodies turn to water tankers or long-distance supply pipelines, driving up costs and creating inequities between those who can pay for water and those who cannot.

For households, scarcity translates into daily struggles: waiting in queues for tankers, rationing water for cooking and hygiene, and enduring soaring utility bills. The burden disproportionately affects women, who often shoulder the responsibility of securing household water.

Beyond scarcity, contamination creates a silent health crisis. Fluoride- and arsenic-laced groundwater causes chronic illnesses in millions of people, leading to long-term medical costs and reduced productivity.

The human cost of groundwater depletion is not only economic—it is social and generational. Farmers trapped in debt, urban families priced out of basic water access, and children exposed to unsafe drinking water all reflect how the crisis deepens inequality. Without urgent solutions, the burden of India’s groundwater crisis will continue to fall on those least equipped to bear it.

For many farmers in Bundelkhand, groundwater levels have dropped so sharply that they have had to drill multiple borewells—sometimes four or five in a single year—as water tables fall by several meters.

Why India’s Groundwater Policies Fall Short

Despite decades of warnings, India’s groundwater crisis has deepened, largely because of flawed policies that encourage overuse instead of conservation. At the root of the problem lies not just mismanagement, but the very incentives designed to support farmers—many of which have unintentionally created a culture of waste.

Free Electricity and Pumping Incentives

According to a 2023 report by the Central Ground Water Board, unlimited electricity subsidies have caused a 20–25% over-extraction rate in Punjab’s aquifers.

Experts note that without transitioning to metered or solar-powered pumps, aquifers will continue to decline at unsustainable rates.

This highlights the urgent need for policy reform and sustainable energy adoption.

Crop Choices Driven by Subsidies

A 2022 study by the National Bank for Agriculture and Rural Development found that rice cultivation in Punjab consumes nearly 3,500 liters of water per kilogram of grain—twice the global average. Policy analysts widely agree that shifting MSP incentives toward millets or pulses could reduce groundwater stress by an estimated 25% in northern India. This shift could ease pressure on India’s fast-depleting aquifers while promoting sustainable agriculture.

Weak Regulation and Enforcement

The World Bank’s 2021 India Water Report highlighted that only 40% of groundwater extraction permits are actively monitored. Environmental law experts emphasize that although regulations exist on paper, real change requires digital monitoring and strict enforcement at the village level. Strengthening oversight and leveraging technology could be pivotal in addressing India’s growing groundwater emergency.

Urban Water Governance Gaps

Cities are no exception. With poor infrastructure and weak enforcement of rainwater harvesting mandates, urban aquifers continue to decline. In Chennai, for example, a rainwater harvesting law exists but suffers from inconsistent maintenance and compliance.

Unless subsidies shift toward water-efficient crops, groundwater extraction is metered, and urban water laws are enforced, even the most advanced technology will fail. Policy reform is not optional—it is the foundation on which any technological solution must rest.

Reviving Traditional Wisdom: Community Solutions for Water Security

While technology offers new tools, India’s history is rich with traditional practices that show groundwater can be revived when communities mobilize.

Johads in Rajasthan and community-led water recharge projects by Paani Foundation restoring groundwater levels.
Community-led interventions can revive groundwater sustainably.

Johads in Rajasthan
In the arid Alwar district, water activist Rajendra Singh (known as the “Waterman of India”) revived ancient water storage structures called johads in the 1980s and 1990s. By restoring thousands of small earthen dams, villages saw groundwater tables rise by several meters. Rivers that had been dry for decades began to flow again, demonstrating the power of local, low-cost solutions.

Paani Foundation in Maharashtra
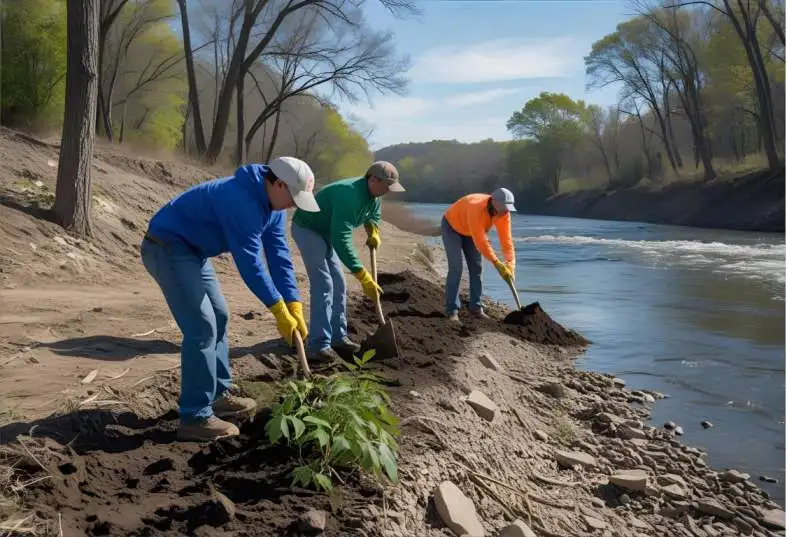
Led by actor Aamir Khan, Paani Foundation has mobilized villages across drought-prone Maharashtra to undertake watershed development through voluntary shramdaan (community labor). By building contour trenches, check dams, and recharge pits, these communities have improved groundwater recharge, reduced tanker dependence, and created resilience against drought.

Rainwater Harvesting in Tamil Nadu
In 2001, Tamil Nadu became the first Indian state to make rooftop rainwater harvesting mandatory for all buildings. Despite mixed enforcement, the initiative led to visible increases in groundwater levels in Chennai during its early years. This shows that with strong political will and community compliance, urban aquifers can recover.

These examples highlight that solutions need not always be high-tech or expensive. By combining traditional wisdom with modern science, India can design approaches that are affordable, inclusive, and sustainable.

How Technology is Transforming Water Management

AI and Sensor-Based Monitoring of Groundwater in India

Artificial intelligence (AI) and IoT-enabled sensors are transforming how India monitors its aquifers. In Bengaluru, AI-driven well tracking predicted drought conditions two months in advance — giving city officials time to ration supplies before taps ran dry. Such foresight could save millions as India’s groundwater emergency deepens.

Yet adoption lags. Unlike Israel’s farmers, who rely daily on AI dashboards, many Indian farmers struggle with low digital literacy and unstable internet. Without training, even advanced tools risk gathering dust.

IoT-Enabled Irrigation and Smart Farming

Smart irrigation promises water savings of 30–40%. In Maharashtra, one farmer halved his irrigation costs with a solar-powered drip system linked to a mobile app. Yet just a few villages away, another farmer drilled his fifth borewell. The difference wasn’t groundwater availability — it was access to credit and knowledge.

Herein lies India’s subsidy trap: free electricity for pumping removes incentives to conserve. Until policy aligns with conservation, even the smartest IoT solutions cannot compete with zero-cost over-pumping.

Satellite Mapping and Remote Sensing

On the macro scale, India’s collaboration with NASA’s GRACE mission reveals alarming aquifer declines. These satellite maps could guide recharge zones and water budgeting — if acted upon. Too often, insights stay in reports while boreholes multiply unchecked.

Future Outlook
If scaled well, AI and IoT could make water use as accountable as money in a bank — with every liter tracked, forecasted, and saved. But unless India bridges gaps in digital literacy, subsidies, and financing, these technologies risk becoming islands of innovation in a sea of depletion.

Diagram showing AI sensors on wells, IoT-based irrigation, and satellite monitoring for groundwater management.
AI, IoT, and satellite monitoring bring precision to groundwater management.

Policy and Governance for Tackling the Groundwater Crisis in India

Digital Aquifer Mapping and Big Data

Effective groundwater management in India cannot depend on local fixes alone—it requires systemic policy support powered by reliable data. One major step in this direction is the National Aquifer Mapping and Management Program (NAQUIM), which uses digital tools and GIS-based mapping to identify groundwater reserves and their recharge potential. By integrating satellite data, hydrogeological surveys, and predictive models, these maps give policymakers a scientific foundation for water allocation and conservation planning.

Big data platforms are also transforming governance. By pooling information from sensors, satellites, and citizen reports, governments can identify high-risk areas, track usage trends, and enforce extraction limits. This approach enables a shift from fragmented, reactive policies to coordinated, data-driven strategies that align with both local needs and national sustainability goals.

Apps and Citizen Engagement

Policy alone cannot solve the groundwater crisis without community buy-in. Here, technology bridges the gap between top-down initiatives and local action. Mobile apps, for example, are being used to guide farmers on crop choices, irrigation schedules, and water budgeting. Apps like Jal Jeevan Mission’s community dashboards allow villages to monitor local water supply, report issues, and co-create solutions.

Citizen science platforms are also emerging. In some states, residents are encouraged to upload well water levels into shared databases, creating a collective monitoring system. This strengthens transparency and fosters a sense of shared responsibility.

When paired with strong governance, these technologies empower communities to move from being passive consumers of groundwater to active stewards. By making data accessible, policies more transparent, and solutions more participatory, India can move closer to a future where groundwater use is sustainable, equitable, and resilient.

Why Tech Adoption in Water Management Remains Slow

Cost and Infrastructure Gaps

While the technology holds immense promise, its adoption is uneven and often limited by cost. IoT sensors, smart irrigation systems, and AI-based platforms require significant upfront investment. For small and marginal farmers, who make up nearly 85% of India’s agricultural community, such expenses are rarely feasible without subsidies or collective financing models.

Infrastructure challenges further complicate adoption. Many rural areas still lack stable electricity and internet connectivity, which are essential for running digital systems. In regions where even basic water supply is unreliable, the idea of advanced monitoring tools can feel out of reach. Unless these systemic gaps are addressed, technology risks widening the divide between resource-rich and resource-poor communities.

Digital Literacy and Awareness

Another barrier is awareness. For many farmers and local water managers, digital tools remain unfamiliar or intimidating. Even when solutions are made affordable, low digital literacy can limit effective use. Training programs and local capacity-building are critical to ensure that communities not only access technology but also trust and apply it.

Social factors also play a role. Traditional practices, skepticism toward government programs, and lack of coordination among institutions can slow down acceptance. Without clear communication of benefits and hands-on support, the promise of technology will remain underutilized.

Ultimately, overcoming these barriers will require more than hardware—it will require policies, education, and inclusive financing that ensure technology does not become yet another layer of inequality in India’s groundwater story.

Future Pathways: Securing India’s Water and Aquifers

Reviving Traditional Wisdom and Water Harvesting

India’s past holds lessons for its future. Structures like johads in Rajasthan, stepwells in Gujarat, and temple tanks in Tamil Nadu were once the backbone of water security. Reviving and adapting these age-old methods can boost recharge and build resilience in both rural and urban settings.

  • Case in point: Rajendra Singh’s johad revival in Alwar district, which raised groundwater levels by several meters and revived seasonal rivers.

Policy and Governance Reforms

Without systemic change, groundwater depletion will continue unchecked.

  • Correcting incentives: Shifting subsidies away from rice/wheat monocultures toward millet and pulses can reduce water stress in Punjab and Haryana.
  • Stronger enforcement: Making groundwater extraction permits enforceable, coupled with digital aquifer mapping, ensures accountability.
  • Urban reforms: Strict enforcement of rainwater harvesting laws, as attempted in Chennai, can stabilize city aquifers.

Globally, countries like Israel have shown that strict water accounting combined with smart irrigation can reverse scarcity. India can adapt these lessons with local solutions.

Community and Citizen Action

Local participation is critical. Villages, neighborhoods, and urban wards must become custodians of their water.

  • Example: Paani Foundation’s watershed contests in Maharashtra show how collective action can restore aquifers.
  • Citizen-science initiatives where households upload groundwater levels to shared apps empower transparency and shared responsibility.

Technology and Innovation

Emerging tools like AI, IoT, and satellite monitoring bring precision and data-driven decision-making into groundwater management.

Technology is powerful, but it works best when paired with traditional knowledge, community ownership, and enabling policies.

Hands holding water droplets representing blend of technology, community action, and policy for India’s water future.
Technology can guide India’s water future, but change requires collective action.

As an environmental researcher working on groundwater and pollution issues in India, I regularly study field reports, water-quality datasets, and community-led water conservation practices.

Conclusion: Safeguarding India’s Groundwater Future (भारत में भूजल संकट का समाधान)

India’s groundwater crisis is no longer invisible — it is a human, ecological, and economic emergency. If unchecked, it could push food production down, cities toward tanker dependency, and millions toward unsafe water (NITI Aayog 2018 Report).

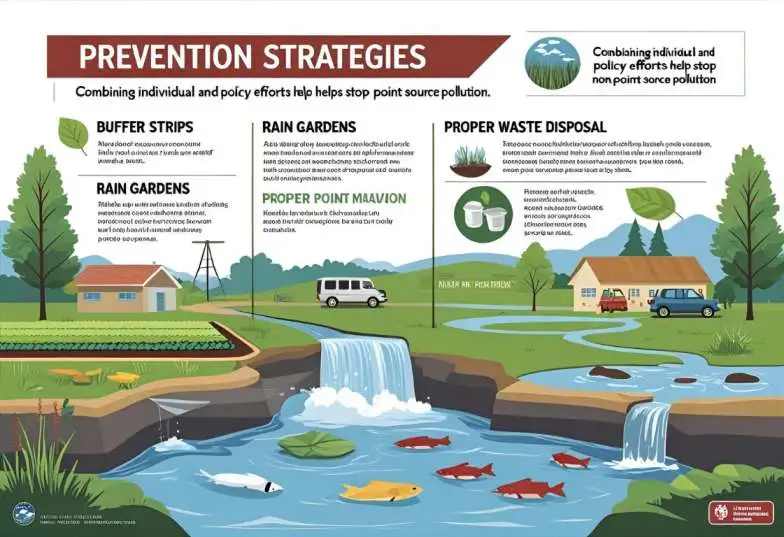
The solutions are clear:

  • Policy reforms to reduce over-extraction and encourage water-efficient crops (FAO India Water Policy).
  • Community-led action (समुदाय आधारित पहलें) like rainwater harvesting and recharge pits (Paani Foundation).
  • Technology (तकनीक) such as AI sensors, IoT-enabled irrigation, and satellite monitoring (IWMI Research).
  • Revival of traditional wisdom (पारंपरिक ज्ञान का पुनर्जीवन) like johads and stepwells (The Hindu – Rajendra Singh “Waterman of India).

Groundwater is a shared resource (साझा संसाधन), and protecting it requires shared responsibility. Farmers, citizens, policymakers, and industries must act together. The time to act is not tomorrow — it is today.

👉 Key Takeaway (मुख्य संदेश): India can avoid a groundwater emergency if innovation, policy, and community action work hand-in-hand.

Technology can slow India’s groundwater crisis, but it is no silver bullet. Real change will come when innovation works hand-in-hand with policy reforms, farmer action, and community stewardship to secure water for future generations.

Frequently Asked Questions (FAQ)

1. Why is groundwater so important for India’s future?
Groundwater supplies nearly 80% of India’s drinking water and supports more than half of irrigation. Without it, food security, urban resilience, and public health would all be at risk.

2. What are the main drivers of aquifer depletion?
The biggest causes include over-extraction for farming, free electricity for pumping, water-intensive crops like rice and sugarcane, weak regulation, and changing rainfall patterns.

3. Can technology alone solve India’s water scarcity?
No. While tools like AI monitoring, smart irrigation, and satellite mapping can help, they must work hand-in-hand with policy reforms, farmer awareness, and community stewardship.

4. What technologies are helping manage water more sustainably?
Examples include AI-driven well sensors, IoT-enabled drip irrigation, and ISRO–NASA satellite mapping, which improve efficiency and make groundwater use more transparent.

5. What solutions offer the best hope for India’s water future?
The most effective pathway is blended: policy reforms, crop diversification, strict enforcement of rainwater harvesting, community-led recharge projects, and scalable tech innovations.

6. भारत में भूजल संकट क्यों बढ़ रहा है?

✅ मुख्य कारण हैं – अत्यधिक दोहन, मुफ्त बिजली की नीतियां, धान/गन्ने जैसी जल-खपत वाली फसलें, और कमजोर नियमों का पालन।

7. भारत में भूजल संकट का समाधान क्या है?

✅ समाधान हैं – वर्षा जल संचयन, जल-संरक्षण तकनीकें (ड्रिप, IoT), फसल विविधीकरण, और कड़े कानून लागू करना।

Author Bio

I’m Soumen Chakraborty, the founder and lead researcher at GreenGlobe25. I specialize in translating complex data on pollution, climate risks, and sustainability into clear, actionable guides for Indian households and communities.

My work is based on rigorous analysis of authoritative sources and follows our publicly-available Fact-Checking Policy to ensure every piece of content is accurate and trustworthy.
LinkedIn: chakrabortty-soumen
Facebook: Ecoplanet

Last update on December 2025.

Sources & References

Some of the images in this article were generated using AI to help illustrate concepts. They are not photographs of real events or locations.

Illustration showing how non-point source pollution from farms and cities contaminates rivers.

Non-Point Source Pollution: Causes, Effects & Prevention

Introduction

Imagine waking up to find your neighborhood lake covered in green algae, with fish struggling for oxygen and a foul smell drifting through the air. This is not just an occasional problem—it’s often the result of non-point source pollution, a hidden threat that affects water, soil, and even the food we consume.

Unlike pollution from a single factory pipe or drainage outlet, non-point source pollution originates from diffuse, widespread areas, making it difficult to trace and control.

Pesticides wash off farm fields. Oil and trash are swept away by rain on city streets. These pollutants silently collect in rivers, lakes, and coastal waters. Over time, they harm wildlife, threaten drinking water, and damage our health.

In this guide, you’ll discover what non-point source pollution is, explore its main causes, learn how it impacts the environment and human health, and find out practical ways to prevent it. Whether you’re a student, an eco-conscious family, or a sustainability professional, this article will give you clear steps to understand and reduce nonpoint source pollution in your community.

According to global water-quality assessments by the World Health Organization, non-point source pollution is one of the major contributors to water degradation worldwide. Runoff containing fertilizers, pesticides, and untreated waste poses serious risks to both ecosystems and human health.

Recent UNEP assessments highlight that non-point source pollution is a major contributor to freshwater contamination in developing countries, largely driven by agricultural runoff and urban stormwater.

Regional assessments indicate widespread surface water contamination in parts of South Asia, with diffuse pollution being a significant contributor to nutrient loading in major rivers.

Diagram showing rainwater runoff picking up pollutants from farms, streets, and construction sites
Rainwater carries chemicals, debris, and waste into rivers and lakes.

What Is Non-Point Source Pollution?

Definition and Key Characteristics

Non-point source pollution refers to pollution that does not come from a single, identifiable place, like a factory pipe or a wastewater drain. Instead, it comes from many diffuse sources spread over large areas. This makes it tricky to track and control.

When rainwater or melting snow flows over roads, farms, construction sites, and lawns, it picks up soil, chemicals, oil, and trash along the way. These pollutants then wash into streams, rivers, and lakes without any treatment. These scattered sources are why we call it non-point pollution.

This type of pollution is different from point source pollution, which comes from clear locations like industrial discharge pipes. With point sources, it’s often easier to measure and regulate the pollution. But non-point sources are unpredictable because they depend on weather, land use, and human habits.

To learn more about expert definitions, consult the official EPA Nonpoint Source Pollution resources.

Common Sources

Non-point source pollution can happen almost anywhere, both in cities and rural areas. Here are some of the most common sources:

  • Agricultural Runoff: Pesticides, fertilizers, and animal waste from farms get washed into water bodies.
  • Urban Runoff: Oil leaks from cars, heavy metals, and litter on streets are carried away by rain.
  • Construction Sites: Exposed soil and debris flow into nearby streams, causing sediment pollution.
  • Home and Garden Areas: Excess lawn fertilizers, pet waste, and household chemicals seep into groundwater. Explore safe, eco-friendly gardening practices.
Farm field with rainwater carrying fertilizer runoff into a nearby stream, causing water pollution.
Fertilizers and pesticides washing off farmland are major sources of non-point source pollution.

In India, this problem is increasing as rapid urban expansion and intensive farming generate more untreated runoff. For example, the Yamuna River suffers from both untreated sewage and massive amounts of runoff from farms and urban areas.

Key characteristics of non-point source pollution:

  • Hard to pinpoint the exact origin
  • Often worsens during heavy rains
  • Accumulates over time, leading to serious contamination

Understanding these basics is the first step toward reducing the damage. In the next section, we’ll look closer at why non-point source pollution happens and what activities cause it.

Causes of Non-Point Source Pollution

Agricultural Runoff

One of the biggest causes of non-point source pollution is runoff from farms. When farmers use chemical fertilizers and pesticides to grow crops, these substances don’t always stay in the soil. During heavy rains or irrigation, water carries them into nearby rivers and lakes. This runoff often contains nitrogen and phosphorus. These nutrients feed algae and cause blooms that choke aquatic life. Animal farms also contribute when manure and waste wash into streams, spreading bacteria and harmful nutrients. In India, large agricultural areas in states like Punjab and Haryana have seen rising problems with water contamination linked to farm runoff.

CPCB’s 2023 assessments note that several agricultural districts show elevated nitrate levels, and fertilizer application rates in parts of Punjab and Haryana exceed levels recommended for sustainable use.

Excess nutrients from agricultural regions of North India contribute significantly to algal blooms in the Yamuna and Ganga river basins.

Urban Runoff and Construction

Cities and growing towns add their share of pollutants. Oil leaks, brake dust, and litter accumulate daily on roads and parking lots. When it rains, all these pollutants are swept away into drains and eventually end up in rivers and lakes.

Studies indicate that urban stormwater is a significant source of heavy metals such as lead, zinc, and chromium in metropolitan waterways. Roads also accumulate suspended solids daily, much of which is washed into drains during storms. Construction activities contribute substantially to waste generation, adding pressure to drainage systems.

Construction sites are another major source. Exposed soil, sand, and building materials are easily carried away by stormwater. This not only pollutes water but also clogs drainage systems, leading to floods.

In many urban areas, including parts of Delhi and Mumbai, poorly managed construction runoff has become a serious concern.

Other causes include improper waste disposal, leaking septic systems, and the excessive use of fertilizers in home gardens. Even activities that seem harmless—like washing your car on the street—can send soap and chemicals straight into waterways. Since these pollutants come from many daily activities, controlling them requires awareness, good habits, and better planning.

Now that you know the main causes, let’s explore how non-point source pollution affects both our health and the environment. For detailed Indian regulations and data on pollution sources, check the Central Pollution Control Board.

Rainwater mixed with oil and trash on a city road
Urban stormwater carries oil drips, plastic litter, and road chemicals into drains that eventually flow into rivers and lakes.

Effects on Health and the Environment

Impact on Water Quality

Non-point source pollution is a major reason why water quality is declining worldwide. When stormwater washes pollutants into rivers and lakes, it creates a harmful mix that upsets the natural balance of these ecosystems.

One of the most common problems is nutrient pollution. When nitrogen and phosphorus from farm runoff enter rivers, they cause massive algal blooms. These thick mats block sunlight and consume oxygen, a process called eutrophication. As oxygen drops, fish and other aquatic creatures can’t survive.

Scientific studies show that:

  • When phosphorus levels exceed 0.03 mg/L, algae proliferate rapidly, triggering eutrophication (US EPA).
  • In several Yamuna monitoring stations (CPCB 2023), phosphorus concentrations reached 0.2–0.5 mg/L, far above the ecological threshold.
  • Dissolved oxygen (DO) in heavily polluted river stretches dropped to 1–3 mg/L, while healthy rivers require ≥5 mg/L.

Major rivers such as the Ganga and Yamuna have experienced significant nutrient and sediment pollution linked to agricultural and urban runoff.

According to assessments by the Central Pollution Control Board (CPCB), diffuse agricultural runoff and urban stormwater discharge significantly contribute to nutrient loading in major Indian rivers, highlighting the need for integrated management strategies.

Sediment pollution is another issue. Soil and debris from construction sites and farms cloud the water, making it hard for plants to grow. Over time, sediment can fill up reservoirs and damage habitats. In coastal areas, runoff often leads to dead zones, where almost no marine life can survive.

Illustration of polluted water impacting fish, birds, and humans
Non-point source pollution harms wildlife and human health.

Consequences for Human Health and Wildlife

Disclaimer:
This section is provided for educational purposes only. It summarizes publicly available environmental and health information and should not be used as medical advice. For concerns related to waterborne diseases or chemical exposure, please consult qualified health professionals or local health authorities.

Non-point source pollution doesn’t just harm the environment. It also threatens human health. Contaminated water can carry bacteria, chemicals, or heavy metals that lead to serious illnesses. Waterborne diseases such as diarrhea, cholera, and dysentery can spread more easily. This information is provided for educational purposes only and should not be considered medical advice. Chemical pollutants like pesticides can accumulate in fish and shellfish, which may pose health risks according to public-health studies.

According to WHO and UNICEF’s Joint Monitoring Programme (JMP), billions of people worldwide are exposed to unsafe drinking water. National health reports also document millions of waterborne disease cases annually in India, while CPCB assessments have found elevated heavy-metal levels in several industrial regions.

Wildlife also suffers. Birds, fish, and small animals depend on clean water to survive. Pollutants can poison their food and destroy their breeding grounds. For example, pesticides in runoff can kill beneficial insects and weaken bird populations.

The damage from non-point source pollution often develops slowly, making it harder to notice until it’s too late. That’s why prevention and action are so important. In the next section, you’ll learn about practical solutions that individuals, communities, and governments can use to reduce this growing problem.

Learn more about global water pollution impacts through WHO’s publicly available water-quality reports.

Case Study: Non-Point Source Pollution in the Yamuna River, India

Background
The Yamuna River is one of India’s most important waterways, supplying water to millions of people. Over the years, it has become heavily polluted—not only by factories and sewage (point sources) but also by non-point source pollution from agriculture and urban runoff.

Problem
In the river’s upper stretches near Delhi and Haryana, large quantities of fertilizers, pesticides, and soil erosion from farms enter the water, especially during the monsoon season. At the same time, stormwater drains carry oil, plastic waste, and household chemicals from city streets directly into the river. This combination has contributed to oxygen depletion, fish mortality incidents, and unsafe water conditions in several stretches of the Yamuna.

According to CPCB’s 2023 Yamuna Monitoring Report CPCB monitoring indicates high BOD levels (often significantly above the 3 mg/L standard) in several stretches of the Yamuna. Diffuse runoff and small drains contribute a substantial share of the pollution load entering the river.

Impacts

  • Health: Communities depending on the river suffer higher rates of waterborne diseases.
  • Environment: Excess nutrients lead to algal blooms that deplete oxygen, killing fish and harming biodiversity.
  • Economy: Cleaning the polluted water costs crores of rupees each year.
Polluted Yamuna River in India with runoff carrying fertilizers, waste, and chemicals.
Non-point source pollution from farms and cities has turned parts of the Yamuna River dangerously contaminated.

Solutions Implemented

  • The Namami Gange and Yamuna Action Plan projects have targeted both point and non-point pollution.
  • Farmers have been encouraged to reduce chemical use and adopt organic methods.
  • Urban areas are creating rainwater harvesting systems and green buffers to filter runoff before it enters the river.
  • Awareness campaigns have educated residents about proper waste disposal and reduced plastic use.

Lesson Learned
This case shows that non-point source pollution requires coordinated action from individuals, communities, and governments. Even small changes—like planting trees near farms or disposing of waste properly—can help revive a dying river.
To see how point source pollution contributes to this problem, read our detailed guide on Point Source Pollution: Causes, Effects & Solutions.

Prevention and Solutions

Individual and Community Actions

Reducing non-point source pollution starts with small changes in daily life. Here are some practical steps individuals and families can take:

  • Use less fertilizer and pesticides. Only apply what is necessary, and follow the instructions on the label.
  • Plant grass or ground cover in bare areas to stop soil erosion.
  • Dispose of chemicals properly. Never pour paint, oil, or cleaners down the drain.
  • Clean up after pets so bacteria don’t wash into waterways.
  • Wash your car on the grass instead of the street so the soil can filter runoff.
Volunteers planting trees along a riverbank to control erosion
Local communities can help prevent pollution with simple actions.

Community efforts are just as important. Organizing neighborhood clean-up days, planting trees along riverbanks, and building rain gardens can all help absorb stormwater and filter pollutants. Schools and local groups can spread awareness by teaching people why small changes matter.

In India, some communities have established check dams and vegetative barriers to slow down runoff from farms and enhance groundwater recharge. These solutions are often low-cost and easy to maintain.

Policy Measures and Regulations

While individual actions make a significant difference, governments play a crucial role in addressing nonpoint source pollution. Effective policies and regulations can guide farmers, builders, and industries in adopting safer practices.

Some effective measures include:

  • Buffer zones: Planting trees and shrubs along waterways to trap pollutants.
  • Rainwater harvesting systems: Capturing runoff before it flows into drains.
  • Better construction standards: Requiring sediment control measures at building sites.
  • Education and incentives: Offering support for farmers who adopt eco-friendly methods.

Many countries have introduced laws to reduce nutrient pollution and manage urban runoff. In India, the Namami Gange Programme is an example of large-scale river restoration that tackles both point and non-point pollution.

Evaluations of the EU Nitrates Directive show measurable reductions in agricultural nitrogen pollution over time.

India’s Namami Gange Programme reports:

  • Gross pollutant load reduction of 450–600 MLD in critical locations (NMCG, 2023).
  • Expansion of constructed wetlands to filter non-point pollution before river entry.

Combining smart policies with community action is the most powerful way to protect water quality and public health. Next, let’s recap what you’ve learned and explore how you can be part of the solution.

Visual list of best practices like buffer strips, rain gardens, and proper waste disposal
Combining individual and policy efforts helps stop non-point source pollution.

Conclusion

Non-point source pollution is often called the silent threat, but it doesn’t have to stay that way. From farms and city streets to our backyards, small actions and better practices can make a big difference.

You’ve learned how this type of pollution comes from many scattered sources like agricultural runoff, urban waste, and construction sites. These pollutants harm water quality, wildlife, and human health in ways we sometimes don’t see until it’s too late.

Many practical, low-cost solutions can help reduce non-point source pollution. We can protect our rivers, lakes, and coastal areas by reducing chemical use, planting vegetation, managing waste properly, and supporting smart policies.

Research from IISc and NEERI suggests that rain gardens and vegetative buffers can significantly reduce stormwater pollutants, often by substantial margins depending on site conditions.

Whether you’re a student researching for a project, a sustainability professional working on new strategies, or a family trying to live greener, every step counts.

Taking small, consistent actions—such as reducing chemical use or supporting local cleanup efforts—can collectively make a meaningful difference. Start today by choosing one habit you can change, and inspire others to do the same. Clean water is a shared resource, and protecting it is everyone’s responsibility.

As the EPA points out, “Unlike pollution from industrial pipes, non-point source pollution is difficult to trace, measure, and regulate, making it a persistent global challenge.” By reducing chemical use, planting vegetation, and supporting smart policies, we can protect our rivers, lakes, and coastal areas.

Start by reducing runoff around your home today—share this guide with friends and help protect our rivers for the next generation.

Let’s work together to protect clean water for everyone.

Ready to make a difference?
Download the printable checklist below to take your first step toward cleaner water. Download

Frequently Asked Questions (FAQs)

Q1: What is an example of non-point source pollution in cities?

A: In cities, a common example is stormwater runoff, which collects oil drips, heavy metals, litter, and chemicals from roads and sidewalks. When it rains, all these pollutants wash into drains and end up in rivers and lakes without any treatment.

Q2: How does non-point source pollution affect human health?

A: Long-term exposure to certain chemical pollutants has been associated in scientific research with serious health concerns. Contaminated water may also increase the risk of waterborne diseases. Always rely on local health experts for medical advice.

Q3: What are the main differences between point and non-point source pollution?

A: Point source pollution comes from a single, identifiable place, such as a factory pipe. Non-point source pollution comes from many diffuse sources, like farm fields and urban streets. Non-point pollution is harder to measure and control because it depends on rainfall and land use.

Q4: How can farmers help prevent non-point source pollution?

A: Farmers can use buffer strips (rows of grass or trees along fields), apply less fertilizer and pesticides, and practice soil conservation methods like contour farming. These steps reduce runoff and protect nearby water bodies.

Q5: What laws or programs address non-point source pollution in India?

A: India’s Namami Gange Programme includes measures to reduce both point and non-point source pollution in the Ganga river basin. Additionally, the Central Pollution Control Board (CPCB) issues guidelines for managing agricultural and urban runoff to protect water resources.

AUTHOR BIO

I’m Soumen Chakraborty, the founder and lead researcher at GreenGlobe25. I specialize in translating complex data on pollution, climate risks, and sustainability into clear, actionable guides for Indian households and communities.

My work is based on a rigorous analysis of authoritative sources like the CPCB and WHO, following our publicly-available Fact-Checking Policy to ensure every piece of content is accurate and trustworthy.
LinkedIn: chakrabortty-soumen
Facebook: Ecoplanet

Last update on November 2025.

This article summarizes scientific and policy information for public awareness and should not substitute expert environmental or health advice.

Illustration showing industrial impact on aquatic life, contrasting solutions to thermal pollution with fish thriving in cool water versus stressed fish in heated water.

How Thermal Pollution Is Managed: Technological, Ecological, and Policy Frameworks

This article is written as an educational explainer. It describes frameworks, technologies, and policy approaches that are discussed in environmental science and water management literature. It does not provide professional, technical, or regulatory advice.

Introduction

After understanding what thermal pollution is and how it affects aquatic ecosystems, the next step is mitigation. Solutions to thermal pollution focus on reducing excess heat before it enters rivers and lakes, while restoring natural systems that help regulate water temperature over time.

Across the world, industries, power plants, and urban regions are adopting a combination of technological controls, ecological restoration, and policy measures to limit thermal stress on water bodies. When examined together, these approaches are associated in research with improved protection of aquatic habitats, stabilize dissolved oxygen levels, and support healthier river systems without compromising essential energy and industrial needs.

In India, the urgency is particularly high. Data from the World Bank (2022) indicates temperature increases of 2–5 °C in some industrial regions, while monitoring by the Central Pollution Control Board (CPCB, 2024) shows that a significant share of monitored rivers exhibit elevated temperatures near major power-generation and industrial clusters. These trends highlight the need for effective, scalable solutions tailored to local environmental and regulatory conditions.

New to the topic? Start with our beginner-friendly overview: What is thermal pollution?

Thermal power plant releasing warm water and steam near a river.
Heated water from industrial cooling systems can raise river temperatures and affect aquatic life.

In this article, we explore practical, science-backed solutions that can help cool our water bodies—ranging from advanced cooling technologies to simple ecological methods like planting trees along riverbanks. When applied together, these approaches can support healthier and more resilient river systems.

This article outlines how coordinated frameworks are described in research as addressing thermal stress in freshwater systems.

Thermal pollution requires targeted interventions that address industrial heat discharge, urban warming, and long-term river management. The following sections outline the most effective technological, ecological, and governance-based solutions currently used to reduce thermal stress in water bodies.

Technological Approaches Discussed in Thermal Pollution Management

Technology is commonly described in environmental literature as a direct method examined for reducing thermal pollution. By cooling water before it is discharged, industries can protect local ecosystems while still meeting their process needs. Many power plants and factories around the world have already adopted these solutions to comply with environmental regulations and reduce their impact on rivers and lakes.

Cooling towers releasing heat into the air to cool industrial water before discharge.
Cooling towers are widely described in environmental studies as reducing thermal discharge by releasing heat into the atmosphere instead of rivers.

Cooling Towers & Heat Exchangers

Cooling towers help lower the temperature of water used in industrial processes. Instead of releasing warm water straight into a river, the water passes through the tower where heat is released into the air. Heat exchangers work in a similar way by transferring heat from wastewater to a separate medium, so less heat reaches natural water bodies.

Analyses by energy agencies and regulatory bodies show that moving from once-through cooling to closed-cycle cooling can significantly reduce thermal discharge. Many thermal power plants in Europe, North America, and Asia have made this shift.

In India, NTPC’s Simhadri power plant has introduced a closed-cycle cooling system with natural-draft cooling towers. This setup is designed to limit hot water discharge and reuse a portion of cooling water, helping the plant meet temperature limits set by regulators.

Renewable Energy Integration

In the long term, reducing dependence on water-intensive thermal power plants also helps address thermal pollution. Solar and wind energy require very little water for operation compared to coal-based generation. As India continues to add more renewable energy capacity each year, the share of electricity generated from plants that rely heavily on cooling water is expected to decline (MNRE, 2024).

This shift in the energy mix does not solve thermal pollution overnight, but it reduces the growth of new heated discharges and lowers pressure on rivers in the long run.

Ecological and Policy Frameworks Used in Practice

Technology alone cannot fully solve thermal pollution. Long-term solutions also depend on ecological restoration and strong environmental policies. When natural systems like forests, wetlands, and floodplains are restored, they help regulate water temperature and improve overall river health.

Riparian Buffer Zones & Wetland Restoration

Riparian buffer zones are strips of trees, shrubs, and grasses along riverbanks. They provide shade, reduce direct sunlight on the water, and help keep temperatures lower. These buffers also stabilise banks, filter runoff, and create habitat for birds, insects, and aquatic life.

Wetlands play a similar role. They store water, slow down flows, and soften temperature swings. Research from the World Bank (2022) shows that restored wetlands in some parts of Europe have reduced local river temperatures by up to 2°C, improving conditions for fish and other species.

Riparian buffer with trees and vegetation providing shade to a river.
Riparian buffers are shown in studies to be associated with cooling waterways, reduced erosion, and improved habitat quality.

Regulations, Incentives & Global Frameworks

Environmental regulations set limits on how warm discharged water can be. Agencies such as the U.S. Environmental Protection Agency (EPA) and India’s Central Pollution Control Board (CPCB) define acceptable temperature ranges for industrial effluents. These standards push industries to adopt better cooling technologies and reduce their thermal impact.

Financial incentives can also help, such as tax benefits or subsidies for installing efficient cooling systems or shifting to renewable energy. International agreements and knowledge-sharing platforms allow countries to learn from each other’s experiences and adopt proven approaches more quickly.

When ecological restoration and policy enforcement work together, they create lasting benefits for rivers, communities, and biodiversity.

Community-Based Monitoring and Research Directions

Communities that live near rivers and lakes often notice changes in water temperature, colour, or smell before any official report is released. Involving these communities in monitoring and reporting is therefore a powerful way to manage thermal pollution.

Local Initiatives & Citizen Science

Citizen science programmes encourage students, residents, and local groups to measure basic water quality indicators, including temperature. For example, in India, the Namami Gange initiative has involved volunteers in observing river conditions in selected stretches of the Ganga basin. Similar efforts by NGOs in other river basins have helped identify problem points and bring them to the attention of authorities.

These programmes do more than collect data. They build awareness, strengthen local ownership, and inspire young people to see themselves as caretakers of their nearby water bodies.

Community volunteers measuring river temperature as part of citizen science monitoring.
Citizen science programmes help communities track river temperatures and report thermal pollution.

Inspiring Global Examples & Ongoing Research

Researchers worldwide are working on tools and strategies to better manage thermal pollution. These include more efficient cooling technologies, improved monitoring systems, and nature-based designs such as wetland buffers. Case studies from different countries show that when industries, governments, and communities work together, it is possible to reduce thermal stress on rivers while still supporting economic activity.

As data and technology improve, the focus is shifting from only reacting to thermal pollution to planning ahead—identifying hotspots early, setting clearer temperature targets, and designing infrastructure with aquatic health in mind.

Conclusion: Moving Toward Sustainable Management of Thermal Pollution

Thermal pollution presents a complex challenge that requires carefully designed interventions rather than isolated responses. Evidence from industrial, urban, and riverine systems shows that excess heat in water bodies can be effectively managed when technological controls, ecological restoration, and regulatory oversight are aligned.

Modern cooling technologies are designed with the objective of reducing heat discharge at the source, while ecological measures such as riparian buffers and wetland restoration help stabilize water temperatures over time. Policy frameworks provide the structure needed to monitor compliance, set temperature thresholds, and guide long-term planning across sectors. Together, these approaches form the foundation of current strategies used worldwide to limit thermal stress in freshwater ecosystems.

World map showing major thermal pollution hotspots Global map showing key rivers affected by thermal pollution and implemented mitigation strategies.
Thermal pollution affects rivers worldwide, but proven solutions are being introduced across many regions.

As environmental pressures increase due to industrial growth and climate variability, the role of integrated thermal pollution management becomes increasingly important. Understanding how these solution frameworks function—and how they are applied in different regional contexts—supports informed decision-making and long-term protection of rivers, lakes, and aquatic life.

Frequently Asked Questions About Thermal Pollution in India

What types of solutions are commonly used to reduce thermal pollution?

Solutions to thermal pollution typically include technological measures such as closed-cycle or dry cooling systems, ecological approaches like riparian buffer restoration, and policy frameworks that set limits on discharge temperatures. These solutions are often used together to reduce thermal stress on rivers and lakes.

How do power plants contribute to thermal pollution?

Many thermal power plants use water for cooling and discharge it back into nearby water bodies at higher temperatures. This heated discharge can raise local water temperatures, especially in rivers with limited flow or during warmer months.

Why is thermal pollution harmful to aquatic ecosystems?

Elevated water temperatures reduce dissolved oxygen levels and increase physiological stress on aquatic organisms. Over time, this can alter species composition, disrupt breeding cycles, and reduce biodiversity in affected water bodies.

What role does urban development play in thermal pollution?

Urban areas generate warmer runoff when rainwater flows over heated surfaces such as roads and rooftops. This stormwater can raise the temperature of nearby streams and lakes, particularly where vegetation and natural shading are limited.

How does climate change influence thermal pollution?

Climate change raises baseline air and water temperatures, making rivers and lakes more sensitive to additional heat inputs. As a result, even moderate thermal discharges can have stronger ecological effects under warmer climatic conditions.

References

  • CPCB. (2023). River Water Quality Monitoring Reports. Central Pollution Control Board, Ministry of Environment, Forest and Climate Change, Government of India.
    https://cpcb.nic.in
  • World Bank. (2022). Water Quality and Industrial Discharge Impact Report. World Bank Environment & Natural Resources Global Practice.
    https://www.worldbank.org
  • UNEP. (2023). Thermal Pollution and Aquatic Ecosystems: Global Overview. United Nations Environment Programme.
    https://www.unep.org
  • U.S. Department of Energy. (2020). Thermal Power Plant Cooling Technologies and Efficiency Analysis. Office of Energy Efficiency & Renewable Energy.
    https://www.energy.gov
  • MNRE. (2024). Annual Report on India’s Renewable Energy Capacity and Power Mix. Ministry of New and Renewable Energy, Government of India.
    https://mnre.gov.in
  • EPA. (2022). Thermal Discharge Standards and Water Quality Regulations. United States Environmental Protection Agency.
    https://www.epa.gov
  • International Journal of Environmental Research. (2023). Global Strategies for Managing Thermal Pollution in Industrial Regions.
    https://link.springer.com/journal/41742
  • NTPC. (2023). Sustainability and Environmental Performance Report. NTPC Limited.
    https://www.ntpc.co.in
  • Namami Gange Programme. (2023). Citizen Monitoring and River Health Assessment Initiatives. National Mission for Clean Ganga (NMCG).
    https://nmcg.nic.in

About the Author

I’m Soumen Chakraborty, the founder and lead researcher at GreenGlobe25. I specialize in translating complex data on pollution, climate risks, and sustainability into clear, research-based explanations for students, educators, and general readers.

My work is based on a rigorous analysis of authoritative sources like the CPCB and WHO, following our publicly-available Fact-Checking Policy to ensure every piece of content is accurate and trustworthy.
LinkedIn: linkedin.com/in/chakrabortty-soumen
Facebook: Ecoplanet

Last update on December 2025.

“Every small action matters in protecting our planet.”

Image Disclaimer:
Some images used on GreenGlobe25 are AI-generated illustrations created for educational purposes. They do not depict real places, events, or individuals.

Thermal power plant in India releasing steam, contributing to thermal pollution in nearby water bodies

Thermal Pollution in India: Definition, Causes, Examples & Solutions (2025 Guide)

Regional Scope Notice
This article focuses specifically on thermal pollution in India, including local causes, case studies, regulatory frameworks, and socioeconomic impacts.
For a global overview of thermal pollution concepts and mechanisms, see our main guide on thermal pollution.

Introduction

Thermal pollution in India is a growing environmental concern linked to the country’s rapid industrial expansion and economic development. Rapid industrial growth has altered thermal conditions in several Indian water bodies—one of the most overlooked being the rise in water temperatures across rivers, lakes, and coastlines.

Whenever factories or power plants release heated water back into natural water bodies, the temperature shift disrupts delicate ecosystems and endangers countless aquatic species. But this isn’t only an environmental problem. Thermal pollution also threatens the livelihoods of millions of people—especially communities that depend on fishing, farming, and healthy freshwater resources.

In this guide, we’ll explore real-world examples of how thermal pollution is transforming India’s waterways, examine its ecological and socio-economic impacts, and highlight the solutions already making a measurable difference. Whether you’re a student, researcher, environmental advocate, or simply curious, you’ll find clear explanations and practical insights here. For broader context on water pollution in India, you can also explore environmental reporting from Down To Earth magazine.

Quick Definition

Thermal pollution refers to abnormal changes in water temperature caused by human activities.
For a detailed global explanation of thermal pollution mechanisms, see our main guide on thermal pollution.

Illustrated thermal pollution diagram showing how industries discharge heated water, raise water temperature, reduce oxygen levels, and affect fish populations.
Illustrative diagram showing industrial heat discharge into Indian rivers and lakes.

What is Thermal Pollution?

In India, thermal pollution is most commonly associated with large thermal power plants, industrial manufacturing zones, and dense urban discharge areas. Concentrated heat release from these sources can raise water temperatures in rivers, reservoirs, and coastal waters, particularly during low-flow and high-demand periods.

Infographic explaining how thermal pollution happens in Indian rivers and lakes, with sources and impacts.
Infographic: How thermal pollution affects India’s aquatic ecosystems.

Rather than repeating global mechanisms, the sections below examine how heated water discharge affects India’s aquatic ecosystems, biodiversity, and water-dependent communities, using region-specific data and case studies.

For a detailed global explanation of thermal pollution processes and mechanisms, see our main guide on thermal pollution.

Common Causes in the Indian Context

Primary sources of thermal pollution in India include:

  1. Thermal Power Plants: With over 200 coal-fired power plants nationwide, these facilities use vast quantities of cooling water that’s returned heated to nearby water bodies. The Singrauli region, India’s “energy capital,” hosts numerous plants discharging heated water into the Rihand Reservoir and the Son River.
  2. Nuclear Power Facilities: Plants like Kudankulam in Tamil Nadu and Tarapur in Maharashtra contribute to localized thermal pollution in coastal waters.
  3. Industrial Manufacturing: Steel mills, paper factories, chemical plants, and textile industries discharge heated wastewater across industrial clusters in Gujarat, Maharashtra, and Tamil Nadu.
  4. Urban Sewage Discharge: Major cities like Delhi, Mumbai, and Kolkata release untreated sewage that raises water temperatures, especially in smaller water bodies.
  5. Hydroelectric Dams: When cold water from reservoir depths is released, it creates “cold shock” downstream, affecting rivers like the Bhagirathi and Alaknanda.

India’s tropical climate compounds these issues, as water bodies already experience high ambient temperatures in the summer months.

Thermal Power Plants: Major Contributors

In India, thermal power plants are among the most significant contributors to thermal pollution due to their heavy reliance on water-based cooling systems. Concentrated clusters of coal- and gas-fired power stations along major rivers and reservoirs create localized zones of elevated water temperature, particularly during low-flow and high-demand periods.

The scale of this impact varies by region, plant capacity, and cooling technology, with several river basins experiencing sustained thermal stress near major power-generation hubs.

Map showing major thermal pollution hotspots in India, including Singrauli, Yamuna River, and Gujarat coast.
Map: Key regions affected by thermal pollution across India.

Case Study: Koradi Thermal Power Station, Maharashtra

The Koradi Thermal Power Station near Nagpur offers a clear case study of thermal pollution impacts in central India. Water temperature increases of 8-9°C (Source: CPCB Regional Monitoring Report, 2023) affect aquatic life and agricultural practices. This 2,600 MW plant draws water from the Kanhan River and returns heated effluent to nearby water bodies.

Studies show water temperatures in receiving channels are consistently 8-9°C higher than ambient levels.

Local fishermen report significant changes in fish populations, with native species like rohu and catla declining dramatically.

Farmers have observed that heated water seeping into irrigation channels affects crop yields, particularly for temperature-sensitive crops. Some report up to 30% yield reductions [Source: Kanhan Basin Agricultural Survey, 2023] in plots nearest to discharge channels.

Recent Updates (2023–2024): CPCB inspections in Chhattisgarh and documented fish-kill events near the Rihand Reservoir highlight rising thermal pollution risks across India.

Photograph of hot water being discharged from Koradi Thermal Power Plant into a river.
Koradi Thermal Power Station in Maharashtra releases heated effluent, affecting local fish and agriculture.

Case Study: NTPC Korba and Thermal Discharge in Chhattisgarh

The NTPC power complex in Korba, Chhattisgarh, is one of India’s largest coal-based power clusters and a significant contributor to thermal discharge. The CPCB “Thermal Power Plant Overview” report lists Korba Super Thermal Power Station among major plants affecting river ecosystems in the region (CPCB PDF). In 2024, CPCB monitoring highlighted elevated downstream water temperatures of 3–5°C above natural levels, breaching safe ecological limits (CPCB Monitoring Report). This has led to stress on carp and catfish populations and reinforces coal power’s central role in India’s thermal pollution challenge.

The Rihand Reservoir Crisis in Singrauli

The Singrauli region, spanning Madhya Pradesh and Uttar Pradesh, hosts multiple large thermal power plants with a combined capacity exceeding 10,000 MW. These plants discharge heated effluent into Rihand Reservoir, raising water temperatures by 6-8°C [Source: CPCB Singrauli Basin Study, 2024] above normal in discharge zones.

The ecological consequences include fish kills during summer months and declining biodiversity. The reservoir once supported over 40 fish species, [Source: Rihand Reservoir Fish Diversity Survey, 2024] but recent surveys show diversity has declined to fewer than 25 species. Fish breeding is highly temperature-sensitive, as explored in our detailed piece on aquatic reproduction and pollution.

Warmer water has accelerated algal blooms, creating eutrophication that further depletes oxygen levels. This impacts thousands of fisherfolk [Source: Singrauli Fisher Cooperative Records, 2023] who depend on the reservoir for their livelihoods.

Industrial Effluents and Urban Discharge

Beyond power generation, industrial sectors and urban areas contribute significantly to thermal pollution through various effluent discharges.

Industrial Corridor: The Gujarat Coast Example

Gujarat’s coastal industrial belt hosts one of India’s highest concentrations of chemical, petrochemical, and manufacturing facilities. In the Golden Corridor industrial zone, factories release cooling water and process effluents into the Kolak and Damanganga rivers before they enter the Arabian Sea.

Monitoring by the Gujarat State Pollution Control Board (GSPCB) has documented 4–7°C temperature increases in estuarine zones affected by heated industrial effluents.

The Jamnagar coastal area, home to massive petroleum refineries, shows thermal plumes extending several kilometers into the Gulf of Kutch, contributing to coral bleaching events in the nearby Marine National Park.

Traditional fishing communities report changing fish migration patterns and declining catches by up to 40% over two decades. [Source: Gujarat Fisheries Livelihood Assessment, 2005–2024]

Urban Heat Islands: The Yamuna River in Delhi

The Yamuna River receives approximately 3,800 million litres of sewage daily, according to the Delhi Jal Board Annual Report (2023). Monitoring data shows river temperatures increase by 2-3°C [Source: CPCB Urban River Temperature Study, 2023] flowing through the urban corridor, particularly downstream from major sewage outfalls.

The heated urban river creates conditions where water holds less dissolved oxygen, while biological processes that consume oxygen accelerate. During summer months, portions of the Yamuna become completely oxygen-depleted, creating “dead zones” where only pollution-tolerant organisms survive.

Ecological Impacts: How Thermal Pollution Affects Indian Aquatic Ecosystems

Diagram illustrating how rising water temperatures reduce dissolved oxygen and disrupt fish life cycles.
Illustrative diagram showing the ecological stress caused by elevated water temperatures in Indian aquatic ecosystems.

Disruption of Aquatic Ecosystems in the Ganges Basin

The Ganges River system faces thermal inputs from multiple sources along its course. Research from the National Mission for Clean Ganga (NMCG) has documented temperature variations of up to 6°C downstream from major thermal discharges, disrupting reproductive cycles of native fish species that rely on seasonal temperature cues for spawning.

The endangered Gangetic dolphin shows altered distribution patterns in response to thermal pollution. These dolphins rely on prey fish that avoid thermally polluted zones, effectively fragmenting dolphin habitats. Studies also indicate that the river’s unique bacteriophage community, which helps break down organic waste, functions optimally only within specific temperature ranges, meaning thermal pollution reduces the river’s natural self-purification capacity.

Ganga River – Industrial Loads and Mass Bathing Impact

In 2025, surveys by the Central Pollution Control Board (CPCB) reported elevated thermal loads in stretches of the Ganga near Kanpur, where clusters of tanneries and small thermal plants operate. Discharge raised water temperatures enough to reduce dissolved oxygen by nearly 40% during peak summer, endangering aquatic biodiversity (CPCB Report). Similarly, the Central Water Commission (CWC) “Kumbh Mela 2025 Water Quality Report” observed temperature spikes and degraded water quality during mass ritual bathing, compounding existing stress on the river (CWC Report). Together, these findings highlight how industrial effluents and cultural pressures intersect to worsen thermal pollution in India’s most sacred river.

For a detailed scientific explanation of the ecological and biological impacts of water temperature changes, see our comprehensive guide on the effects of thermal pollution.

Chilika Lake’s Changing Biodiversity

Chilika Lake, Asia’s largest brackish water lagoon and a Ramsar wetland site in Odisha, shows how thermal pollution affects coastal ecosystems. Research documents shifts in phytoplankton communities, with warmer waters favoring certain blue-green algae species that can produce toxins.

Fish community structure has changed in thermally affected areas, with cold-water dependent species declining while heat-tolerant invasive species expand. Ornithologists have documented changes in arrival times and duration of stay for several migratory bird species as their food sources are affected by thermal pollution.

Socioeconomic Consequences of Rising Water Temperatures in India

In the Narmada River basin, field observations and local livelihood assessments indicate declines in fish catch as species either experience thermal stress or shift away from affected zones. In coastal Tamil Nadu, monitoring reports and community surveys document changes in near-shore fish distribution, requiring fishing vessels to operate farther from the coast. These shifts are associated with increased operational costs and altered income patterns for fishing households.

Bar chart showing reduction in fish catch near thermal pollution sites in India from 2015 to 2025.
Figure: Reported changes in fish catch levels in regions affected by thermal discharge (2015–2025).

Impact on Fisheries and Dependent Communities

Along the Narmada River basin, thermal discharges have altered fish populations that sustain thousands of traditional fishing families. In the Bargi reservoir region, local livelihood surveys conducted between 2015 and 2024 report an estimated 25–35% income reduction among fishing households, as commercially valuable species decline (CPCB 2024 Livelihood Impact Survey).

In coastal Tamil Nadu, traditional fishing communities have documented shifting fish migration patterns due to thermal “barriers” that some species avoid. This forces fishermen to travel farther from shore, creating economic hardship and safety risks. Women in fishing communities, who traditionally handled post-harvest processing and local sales, have been particularly affected as their role in the value chain is disrupted.

Agricultural Implications near Thermal Pollution Sources

In the Damodar Valley region, irrigation with thermally affected water has shown measurable impacts on agricultural productivity. Warmer irrigation water increases soil microbial activity, which can accelerate the breakdown of organic matter and reduce soil fertility over time. Field studies in the area indicate that temperature-sensitive crops experience yield reductions of 15–20% [Source: Damodar Valley Agricultural Field Trials, 2022], particularly in plots located closest to thermal discharge channels.

In Chhattisgarh’s rice-growing regions near power plants, farmers have observed accelerated pest multiplication rates with warmer irrigation water, increasing production costs through greater pesticide dependency.

Regulatory Framework and Compliance Challenges

India has established a regulatory framework to address thermal pollution, with oversight primarily guided by the Central Pollution Control Board (CPCB) and implemented through central and state-level environmental authorities.

India’s Environmental Regulations on Thermal Discharges

Key regulations include:

  1. The Water (Prevention and Control of Pollution) Act, 1974
  2. Environmental Protection Act, 1986
  3. Thermal Power Plant Regulations limiting discharge temperature to no more than 5°C above the receiving water body temperature
  4. Coastal Regulation Zone (CRZ) Notification
  5. Environmental Impact Assessment (EIA) Requirements

Implementation and Enforcement Context

Despite robust regulations on paper, implementation faces challenges:

  • Monitoring Coverage: Availability of continuous, real-time temperature monitoring varies across regions and river basins.
  • Technical Capacity: State Pollution Control Boards report differing levels of technical staffing and analytical capacity.
  • Compliance Outcomes: Reported compliance levels differ across industrial sectors and locations, as reflected in inspection records.
  • Institutional Coordination: Oversight responsibilities are shared across multiple agencies, influencing implementation consistency.

Documented Mitigation Examples from India

Despite challenges, several regions have implemented effective approaches to manage thermal pollution.

Industrial Mitigation Examples

At Tata Power’s Trombay facility, upgrades to cooling infrastructure were associated with measured reductions in discharged water temperatures, according to company and regulatory disclosures.

In Gujarat’s chemical sector and Tiruppur’s textile cluster, heat management initiatives have been documented as part of broader compliance and efficiency programs.

Side-by-side images showing water quality improvement after implementing cooling systems.
Before and after: Ecological restoration reduces thermal pollution impacts.

Ecological Approaches and Nature-Based Solutions

In Odisha, engineered wetland and pond-based systems have been documented as part of thermal discharge management efforts, with monitoring reports indicating reduced downstream water temperatures in receiving channels.

In the Rihand reservoir region, NTPC has reported the establishment of designated thermal refuge zones using native vegetation, which are associated with improved habitat availability for temperature-sensitive fish species during warmer periods.

Near Karnataka’s Kaiga nuclear power plant, mangrove restoration initiatives have been recorded as part of coastal environmental management programs, contributing to localized moderation of water temperature fluctuations.

For a structured overview of global and India-specific approaches to reducing thermal pollution, see our dedicated guide on solutions to thermal pollution.

Latest India Thermal Pollution Snapshot (CPCB 2024–25)

Thermal power remains India’s dominant generation source; cooling water discharges are a major thermal load on rivers, lakes, and coastal zones. CPCB and State PCB spot checks repeatedly report temperature rises of roughly 3–8°C [Source: CPCB Thermal Discharge Snapshot, 2024–25] above ambient near plant outfalls during peak seasons.
Breaches are most common in late winter and late summer, when fish stress and DO dips are highest.
Compliance improves significantly where closed-cycle or hybrid cooling technology is adopted.

Conclusion

Thermal pollution represents a significant but often underexamined pressure on India’s freshwater and coastal ecosystems. Evidence from river basins, reservoirs, and industrial corridors shows that elevated water temperatures can influence aquatic biodiversity, fisheries, agriculture, and community livelihoods.

India’s experience highlights how thermal pollution is shaped by regional industrial activity, hydrological conditions, and regulatory context. Continued monitoring and documentation of temperature-related impacts remain essential for understanding the scale and distribution of thermal stress across the country’s water systems.

Frequently Asked Questions on Thermal Pollution

What is thermal pollution in the Indian context?

Thermal pollution in India refers to changes in water temperature caused by industrial discharge, power generation, and urban effluents that affect rivers, reservoirs, and coastal waters.

Why is thermal pollution a concern for Indian rivers?

Many Indian rivers already experience low flow conditions during dry seasons, making them more sensitive to temperature increases from industrial and urban sources.

How does thermal pollution affect fish in India?

Elevated water temperatures can disrupt breeding cycles, alter migration patterns, and reduce oxygen availability, affecting both native and commercially important fish species.

Are there legal limits on thermal discharge in India?

Yes. Regulatory guidelines generally limit thermal discharge to within 5°C above the receiving water body’s ambient temperature, subject to site-specific conditions.

Which regions in India are most affected by thermal pollution?

Impacts are most commonly reported near major thermal power clusters, industrial corridors, and densely populated river basins such as the Ganga, Yamuna, and Damodar systems.

How is thermal pollution monitored in India?

Monitoring is carried out by agencies such as the Central Pollution Control Board (CPCB) and State Pollution Control Boards through periodic inspections and water quality assessments.

Is thermal pollution linked to climate change in India?

While thermal pollution and climate change are distinct, rising ambient temperatures and reduced river flows can amplify the effects of heat discharge in water bodies.

About the Author

I’m Soumen Chakraborty, the founder and lead researcher at GreenGlobe25. I specialize in translating complex data on pollution, climate risks, and sustainability into clear, actionable guides for Indian households and communities.

My work is based on a rigorous analysis of authoritative sources like the CPCB and WHO, following our publicly-available Fact-Checking Policy to ensure every piece of content is accurate and trustworthy.
LinkedIn: chakrabortty-soumen
Facebook: Ecoplanet

Last update on November 2025.

Disclosure: This Post may contain affiliate links. If you purchase through them, we may earn a small commission at no extra cost to you.

Sources & Further Reading

Infographic comparing a river affected by thermal pollution with a healthy river ecosystem, showing heat discharge, fish stress, and algal bloom.

Effects of Thermal Pollution: How Heat Discharge Is Changing Our Rivers

Introduction

Thermal pollution alters the natural temperature of rivers, lakes, and coastal waters, creating a chain of physical and biological changes within aquatic ecosystems. Even small shifts in water temperature can influence oxygen availability, species behavior, and ecosystem stability.

The effects of thermal pollution are often subtle at first, but they accumulate over time. From metabolic stress in fish to changes in species composition and the spread of harmful algal blooms, temperature-driven impacts can reshape freshwater environments and reduce their ability to support life.

This article examines the key ecological and biological effects of thermal pollution, supported by scientific research and real-world case studies.

New to the topic? Start with our beginner-friendly overview: What is thermal pollution.

Why the Effects of Thermal Pollution Matter

  • Reduced dissolved oxygen threatens fish survival and increases mortality risk
  • Elevated temperatures disrupt breeding cycles and migration timing
  • Long-term warming reduces biodiversity and destabilizes freshwater food webs

To understand what causes these changes, see our guide on causes of thermal pollution.

Infographic illustrating the effects of thermal pollution process in rivers and lakes, showing how factories discharge heated water that raises temperatures and disrupts aquatic ecosystems.

Major Sources of Human-Driven Heat Discharge in Aquatic Habitats

1. Power Generation Facilities

Power plants—especially nuclear and coal-fired facilities—are among the largest contributors to thermal pollution worldwide due to their intensive cooling requirements. Many of these plants rely on “once-through” cooling systems that:

  • Withdraw large volumes of cool water from rivers, lakes, or coastal areas
  • Circulate this water through condensers where it absorbs waste heat
  • Release the heated water back into the source, often several degrees warmer
  • In some cases, raise local water temperatures by approximately 8–12°C near discharge points, depending on flow and plant output

A single 1,000-megawatt nuclear plant can withdraw billions of gallons of water per day for cooling, returning it at temperatures noticeably above ambient levels, which can affect nearby habitats.

2. Industrial Manufacturing Processes

Many industrial sectors rely on water for cooling, processing, and cleaning, including:

  • Steel and metal processing plants
  • Pulp and paper manufacturing facilities
  • Chemical production industries
  • Food processing and packaging facilities

Unlike power plants, industrial facilities may discharge heat along with chemical or organic pollutants, creating combined stressors that can further degrade aquatic ecosystems.

3. Urban Heat Islands and Stormwater Runoff

In urban areas, impervious surfaces such as roads, parking lots, and rooftops absorb solar radiation and transfer this stored heat to stormwater, which then flows into nearby rivers and streams. Studies show that stormwater runoff from dense urban zones can be 5–10°C warmer than runoff from vegetated or forested areas, significantly increasing thermal stress in receiving waters.

4. Deforestation and Riparian Zone Destruction

The removal of riparian vegetation eliminates natural shading along waterways, exposing surface waters to direct sunlight and increasing temperature fluctuations.This vegetation loss can:

  • Increase maximum water temperatures by 2–10°C depending on canopy loss and river width
  • Intensify daily temperature fluctuations as shaded microhabitats disappear
  • Reduce habitat complexity that provides thermal refuges for fish and other organisms

5. Climate Change Amplification

While climate change is not a direct source of thermal discharge, it amplifies the impacts of thermal pollution by:

  • Increasing baseline water temperatures worldwide
  • Intensifying the frequency and severity of heat waves, which warm water bodies even further
  • Reducing summer water flows in many regions, limiting natural cooling and concentrating heat in smaller volumes of water

To understand the main drivers behind these temperature shifts, you can explore our detailed guide on the major causes of thermal pollution, which explains each source with examples and data.

Physiological Stress and Biological Impacts of Thermal Pollution

Oxygen Depletion and Metabolic Stress in Warmed Aquatic Systems

Water temperature and oxygen availability are closely interconnected. As water warms, its capacity to hold dissolved oxygen decreases, creating physiological stress for many aquatic species. According to the World Health Organization (WHO), rising water temperatures can intensify the growth of harmful cyanobacteria, increasing ecological and public health risks in freshwater systems.

Dissolved Oxygen vs. Temperature:

Water Temperature (°C)Approx. Maximum Dissolved Oxygen (mg/L)Ecological Impact
0°C (very cold)~14.6 mg/LOptimal for cold-water species such as trout and salmon
20°C (moderate)~9.1 mg/LStress increases for cold-water species as oxygen declines
30°C (warm)~7.5 mg/LMany sensitive species struggle to survive at these levels

Key Physiological Effects of Thermal Pollution:

  1. Oxygen Depletion
    • Research indicates that dissolved oxygen levels may decline by approximately 5–10% for every 1°C rise in water temperature, depending on depth, flow, and local conditions.
    • Low dissolved oxygen levels can lead to respiratory stress, especially for cold-water species that typically require 6–8 mg/L for normal physiological function.
    • Recent studies reported in Environmental Science & Technology (2023) note an increase in fish mortality events associated with low-oxygen conditions in thermally stressed rivers.
  2. Metabolic Acceleration
    • As ectothermic species experience warmer water, their metabolic rates accelerate, increasing their overall oxygen demand.
    • Many fish require more food to support their elevated metabolic needs, yet prey availability often declines in warm, low-oxygen environments.
    • Prolonged exposure to elevated temperatures can weaken immune function, making fish more susceptible to infections and disease outbreaks.
    • For example, research published in Nature (2022) documented that trout populations in warmer streams required substantially more energy for growth, while food availability declined under elevated temperature conditions.

Takeaway: Even modest increases in water temperature create a “double stress effect”—oxygen levels in the water decline just as aquatic organisms require more oxygen to sustain their heightened metabolism.

Illustration showing industrial facilities discharging hot water into a river, causing higher temperatures that reduce oxygen levels and threaten fish and aquatic plants.
How Thermal Pollution Happens: Factories release heated water into rivers and lakes, raising temperatures, lowering oxygen, and endangering aquatic life.

Reproductive Disruption, Biodiversity Shifts, and the Rise of Harmful Algal Blooms

Rising water temperatures disrupt natural biological cycles and disturb ecological balance, creating long-term challenges for many freshwater habitats.

1. Reproductive Disruption

  • Temperature serves as a key environmental cue for spawning, egg development, and early life-stage timing.
  • Thermal stress can lead to several reproductive disturbances, including:
    • Trigger off-season or premature spawning events, reducing offspring survival rates.
    • Accelerate egg development, sometimes resulting in lower viability or weakened larvae.
    • Influence sex ratios in species where temperature determines sex, potentially altering long-term population stability.
    • Create thermal barriers that prevent fish from migrating to upstream spawning grounds.

For example, monitoring data from the Columbia River indicate that prolonged exposure to temperatures above 18°C has been associated with reduced spawning success in certain salmon populations.

2. Biodiversity Loss & Community Restructuring

  • Sensitive cold-water species often decline under elevated temperatures, while warm-water or heat-tolerant species may expand into the same habitats.
  • Food webs may become simplified as temperature-sensitive species decline, altering predator–prey dynamics.
  • Warmer conditions can favor invasive or generalist species, allowing them to outcompete more specialized native species.
  • Under the competitive exclusion principle, warm-adapted species may gain an advantage over native species experiencing thermal stress.

3. Harmful Algal Blooms (HABs)

  • Warmer water can accelerate the growth of algae—particularly cyanobacteria—which thrive under elevated temperature and nutrient-rich conditions.
  • As algal blooms die and decompose, they can deplete dissolved oxygen and create localized “dead zones.”
  • Dense algal growth reduces water clarity, limiting sunlight and affecting photosynthetic aquatic plants.
  • Some cyanobacterial blooms produce toxins that can harm fish, wildlife, and human water use.
  • Economic impacts: A 2019 study published in Frontiers in Marine Science highlighted that harmful algal blooms in U.S. freshwater systems may contribute to substantial economic losses across fisheries, recreation, and water treatment sectors.

Takeaway: Thermal pollution alters reproductive timing, shifts species composition, and encourages the formation of harmful algal blooms—together creating a powerful set of pressures on freshwater ecosystems.

Thermal Shock and Acute Mortality Events in Aquatic Ecosystems

Sudden and significant temperature shifts in water—often linked to intermittent industrial discharges—can cause severe stress and, in some cases, rapid mortality among aquatic organisms.

Key Observations:

  1. Rapid Temperature Shifts
    • Rapid temperature increases, such as changes exceeding 1–2°C within short periods, can create significant physiological stress for temperature-sensitive species.
    • Less mobile organisms—including mussels, aquatic insects, and juvenile fish—are especially vulnerable because they cannot escape sudden changes in temperature.
  2. Life Stage Sensitivity
    • Early life stages such as eggs, larvae, and juveniles are more prone to thermal shock than adults because their physiological tolerance is narrower.
    • Sudden heat spikes can interrupt normal development and, under extreme conditions, may result in acute mortality.
  3. Undocumented Losses
    • Many thermal shock events likely go undetected in remote locations or during periods without active environmental monitoring.
    • Even localized or short-duration events can, over time, contribute to declines in population numbers, especially for species with limited reproductive recovery.
  4. Example:
    • In several monitored urban rivers, intermittent releases of heated cooling water have been associated with short-term mortality events among macroinvertebrate populations, contributing to reductions in local biodiversity.

Takeaway: Even relatively small but rapid temperature spikes can create severe ecological stress, underscoring the importance of regulating discharge temperatures and maintaining consistent thermal conditions in freshwater systems.

Case Studies: How Heat Discharge Transforms Aquatic Environments

Aerial photo of a river with visible thermal plume extending downstream from a nuclear plant, demonstrating heated water discharge impact.
Thermal Plume from a Power Plant: An aerial perspective illustrates how discharged warm water forms a visible thermal plume, altering downstream temperature patterns and affecting aquatic ecosystems.

Case Study 1: Connecticut River and Nuclear Power (USA)

The Vermont Yankee Nuclear Power Plant operated along the Connecticut River for more than four decades before its closure in 2014. During its operational years, thermal discharge from the facility altered local river temperature patterns.

  • Summer water temperatures near the discharge point were consistently higher than upstream reference locations during peak operation periods.
  • Thermal plumes extended several kilometers downstream, changing physical habitat conditions.
  • Cold-water species, including brook trout, showed marked declines in areas most affected by elevated temperatures.
  • Warm-water species such as smallmouth bass became increasingly dominant in stretches where temperatures remained elevated.

Post-closure monitoring documented measurable ecological changes, with temperature-sensitive species gradually reappearing in previously warmed sections of the river. These observations highlight the strong relationship between water temperature and species distribution in freshwater ecosystems.

For broader context on how thermal impacts are managed, see our reference guide on solutions to thermal pollution.

Case Study 2: The Ganges River Industrial Corridor (India)

Along several industrial stretches of the Ganges River, multiple facilities and power plants contribute to persistent thermal stress on aquatic ecosystems.

  • Water temperatures in certain reaches remain elevated for much of the year compared with nearby reference sites.
  • Dissolved oxygen levels frequently decline during summer months, creating challenging conditions for temperature-sensitive species.
  • Field surveys have recorded noticeable reductions in native fish diversity within heavily industrialized sections.
  • Signs of respiratory stress have been observed in fish populations exposed to warm, low-oxygen waters.
  • Local fishing communities have reported declines in catch volumes, consistent with broader ecological changes.

A 2022 study published in Environmental Monitoring and Assessment associated many of these impacts with elevated water temperatures near thermal discharge points, distinguishing thermal stress from other forms of pollution.

For additional background on thermal pollution management approaches, see our reference guide on solutions to thermal pollution.

Case Study 3: Urban Streams in Melbourne, Australia

Comparative studies of urban streams and nearby forested streams around Melbourne reveal how urban heat influences freshwater ecosystems even in the absence of major industrial discharge.

  • Urban streams consistently recorded higher temperatures than forested reference streams due to reduced riparian shading and heat absorption from surrounding infrastructure.
  • Summer temperatures in some urban waterways reached levels stressful for many aquatic species.
  • Sensitive macroinvertebrate groups were frequently absent from warmer urban reaches.
  • Algal biomass was significantly higher in urban streams, reflecting combined temperature and nutrient inputs.
  • Fish communities in urban waterways showed reduced species diversity compared with nearby forested streams.

These findings demonstrate how urbanization, impervious surfaces, and heated stormwater runoff can elevate water temperatures and degrade aquatic habitats over time.

To explore practical ways to reduce thermal stress in rivers and lakes, see our guide on solutions to thermal pollution.

Conclusion: Long-Term Ecological Consequences of Thermal Pollution

Thermal pollution exerts complex and far-reaching effects on freshwater ecosystems. Even small, sustained increases in water temperature can reduce oxygen availability, disrupt reproductive cycles, and alter species composition within rivers and lakes.

Evidence from scientific studies and real-world case examples shows that temperature-driven stress can reshape aquatic communities over time, often favoring heat-tolerant species while reducing biodiversity. Understanding these effects is essential for accurately assessing ecological risk and recognizing the long-term consequences of unmanaged thermal discharge.

Need a Summary or Quiz for Class?

If you need a classroom-ready summary or quiz, you can download our Thermal_Pollution_Effects_Student_Resources.zip, which includes a concise infographic, a short summary, and a basic knowledge-check worksheet.
This ZIP file contains only educational PDF materials and no software.

Frequently Asked Questions on the Effects of Thermal Pollution

What is thermal pollution in simple terms?

Thermal pollution occurs when human activities raise or lower the natural temperature of rivers, lakes, or coastal waters. These temperature changes can disrupt aquatic ecosystems by altering oxygen levels, species behavior, and biological processes.

How does thermal pollution affect fish and aquatic life?

Thermal pollution affects fish by reducing dissolved oxygen levels and increasing metabolic stress. Warmer water forces aquatic organisms to consume more oxygen at the same time that less oxygen is available, which can weaken fish, disrupt reproduction, and increase mortality risk.

Why does warm water hold less oxygen?

As water temperature rises, the physical solubility of oxygen decreases. This means warmer water naturally contains less dissolved oxygen than cooler water, making it more difficult for aquatic organisms to meet their oxygen requirements.

Can thermal pollution change which species live in a river or lake?

Yes. Elevated temperatures often favor warm-water or heat-tolerant species, while cold-water and temperature-sensitive species decline. Over time, this can alter species composition, simplify food webs, and reduce overall biodiversity within aquatic ecosystems.

How is thermal pollution linked to harmful algal blooms?

Warmer water accelerates algal growth, especially for cyanobacteria that thrive in warm, nutrient-rich conditions. When algal blooms grow and later decompose, they consume large amounts of dissolved oxygen, which can worsen oxygen depletion and stress aquatic life.

What is thermal shock in aquatic ecosystems?

Thermal shock occurs when water temperatures change rapidly over a short period, often due to intermittent heated discharges. Sudden temperature shifts can overwhelm the physiological tolerance of fish and invertebrates, leading to severe stress or sudden mortality, particularly among eggs, larvae, and less mobile organisms.

Are the effects of thermal pollution always immediately visible?

No. Some effects, such as thermal shock or fish kills, can occur rapidly, but many impacts develop gradually. Long-term warming can quietly reduce biodiversity, disrupt reproduction, and weaken ecosystem stability over time without obvious short-term signs.

About the Author

I’m Soumen Chakraborty, the founder and lead researcher at GreenGlobe25. I specialize in translating complex data on pollution, climate risks, and sustainability into clear, actionable guides for Indian households and communities.

My work is based on a rigorous analysis of authoritative sources like the CPCB and WHO, following our publicly-available Fact-Checking Policy to ensure every piece of content is accurate and trustworthy.
LinkedIn: chakrabortty-soumen
Facebook: Ecoplanet

Last update on December 2025.

By commenting, you agree to our Comment & Community Guidelines.

Some of the images in this article were generated using AI to help illustrate concepts. They are not photographs of real events or locations.

"Causes of Thermal Pollution - Illustration of a factory releasing hot water into a river, showing industrial impact on water temperature."

Causes of Thermal Pollution: Human and Natural Sources Explained

Disclaimer (Educational Use Only):
This article provides general environmental information for students, educators, and the public. It does not replace official regulatory guidance. For compliance matters, always refer to the latest CPCB/State PCB notifications.

Introduction: What Causes Thermal Pollution?

Thermal pollution occurs when rivers, lakes, estuaries, or coastal waters become warmer than their natural baseline temperature due to either human activities or natural processes. Even small temperature increases can significantly alter the natural thermal conditions of water bodies.

According to the U.S. Environmental Protection Agency (EPA), thermal pollution is a leading stressor in urban rivers and industrial corridors (EPA, 2024).

Note: This article focuses specifically on the causes of thermal pollution.
For a complete explanation of impacts, solutions, and global context, read our main guide on What Is Thermal Pollution.

Global Hotspots of Thermal Pollution

Global map showing major thermal pollution hotspots across continents.
Global hotspots of thermal pollution across major river basins and coastal regions.

Global thermal stress is most pronounced where rapid industrialization intersects with energy demand, limited river flow, and coastal development. High-resolution environmental datasets—such as those from NASA Earth Observatory (2023) and UNEP Water Temperature Monitoring (2024)—highlight warming clusters across North America, Europe, Asia, and Africa.

Why These Regions Heat Faster (Expert Explanation)

Research groups such as UNEP, EEA, and NIHWS identify five common drivers:

1. Dense industrial + energy corridors
Examples: Rhine River (EU), Tennessee Valley (USA). Industries withdraw water for cooling and discharge it back several degrees warmer.

2. Coal and nuclear dependence
China’s Yangtze basin and India’s Ganga basin host dozens of thermal plants that create long-term warming plumes.

3. Urban heat reinforcement
In Japan and Australia, stormwater running off superheated pavements elevates river temperatures after rainfall.

4. Desalination clusters
Mediterranean coasts increasingly rely on desalination, which produces high-temperature brine outfalls.

5. Drought-prone or low-flow rivers
Low-flow systems (Vaal, Paraná, Niger Delta) retain heat longer, intensifying thermal spikes during dry months.

Global Hotspots Summary Table (Thermal Stress Patterns)

RegionKey Water BodiesPrimary Thermal DriversTypical Temperature IncreaseObserved Thermal Patterns
USA (Tennessee Valley)TVA RiversCoal & nuclear cooling discharge+3–8°CPersistent localized warming near discharge points
USA–CanadaGreat Lakes SystemIndustrial cooling + climate warmingBasin-specificSeasonal and basin-wide temperature elevation
Europe (Rhine Basin)Rhine RiverIndustrial corridor discharges+2–5°CContinuous thermal plumes in industrial stretches
MediterraneanCoastal zonesDesalination brine + thermal outfallsLocal spikesNearshore temperature anomalies
ChinaYangtze & Yellow RiversCoal power clusters+4–9°CLong-distance warm-water plumes
JapanCoastal urban zonesIndustrial effluent + power plantsLocal warmingRepeated short-duration heating events
AustraliaUrban riversStormwater runoff + climate warmingSeasonalHeat accumulation during dry periods
BrazilParaná RiverIndustrial & energy dischargePersistentElevated baseline temperatures
South AfricaVaal RiverCoal-based power generationLong-termChronic thermal elevation
NigeriaNiger DeltaOil & gas heated effluentChronicSustained warming near outfalls

How India Compares to Global Hotspots

India shares thermal stress patterns with several global regions, based on CPCB monitoring, NEERI studies, and Ministry of Environment reports (2020–2024).

1. Dense thermal power corridors (similar to China)

The Ganga basin, Andhra coast, and Tamil Nadu power belt host multiple plants whose warm-water discharge elevates downstream temperatures during peak demand.

2. High coal dependency (similar to South Africa)

India relies heavily on coal-fired power generation, which contributes long-term temperature rise in rivers.

3. Industrial belts along major rivers (similar to Brazil)

The Hooghly, Godavari, and Damodar industrial clusters show consistent warm-water plumes near outfalls.

4. Unique Indian pattern: Monsoon-driven variability

During pre-monsoon low-flow months, the same volume of discharge produces greater warming.

Natural Causes of Thermal Pollution

Although most thermal pollution comes from people, natural processes can also raise water temperatures and alter local thermal conditions. These effects are usually localized or temporary, but they show how sensitive aquatic systems are to temperature shifts.

Volcanic Activity

Lava flows, geothermal vents, and eruptions can raise water temperatures dramatically in nearby rivers or lakes.
Example: In Indonesia, volcanic eruptions have temporarily heated nearby rivers and lakes.

Hot Springs and Geothermal Inputs

Some streams and lakes naturally receive warm water from underground sources, creating “thermal micro-zones” with unique organisms.
Example: Yellowstone National Park has geothermal inputs that naturally warm connected streams.

Flooding and Erosion

Intense rainfall or flooding can erode riverbanks and reduce depth, leaving shallow stretches that warm more quickly under sunlight.

Climate Change and Drought

Rising air temperatures and reduced flows during droughts can sustain warmer baseline conditions in rivers and lakes.
Example: Prolonged droughts in Australia’s Murray-Darling Basin have resulted in sustained elevated water temperatures during low-flow periods.

👉 Key Point: Natural warming events usually affect only small stretches of water for short periods, but ecosystems become far more vulnerable when these natural stresses overlap with human-driven heating.

To understand how these warming factors impact ecosystems, read our full guide on the harmful effects of thermal pollution.

Diagram comparing natural causes (volcanoes, geothermal heating, drought) and human causes (industrial cooling, thermal power discharge, urban runoff) of thermal pollution
Natural vs human causes of thermal pollution explained.

Human Causes of Thermal Pollution

Unlike natural events, human activities create large-scale, long-term warming of rivers, lakes, and coasts. The main drivers include:

Industrial Cooling Discharge

Factories and power plants use water for cooling, then release it back at higher temperatures.
Example: Studies along the Godavari River show that water near industrial discharge points can become significantly warmer, especially during peak power-generation periods.

Nuclear Power Plants

Reactor cooling releases very warm water, adding stress to nearby aquatic habitats.

Urban Runoff

Rainwater flowing over heated pavements and rooftops carries excess heat into rivers, especially in dense urban areas.

Deforestation Along Waterways

Removing riverside trees eliminates shade and accelerates solar heating, making streams shallower and hotter during dry periods.

Construction and Mining

Land clearing and excavation speed up erosion, reducing river depth and allowing water to heat faster.

Accidental or Unregulated Discharges

Equipment failures or poor regulation can lead to sudden releases of overheated water into ecosystems.

👉 Key Point: Human-driven thermal pollution is typically chronic and widespread, especially in regions with dense industrial activity and limited seasonal river flow.

Human-driven thermal inputs tend to persist over long periods, especially in regions with dense industrial activity and limited seasonal river flow.

These temperature changes can lead to a range of ecological effects of thermal pollution in rivers and lakes.

Map and table showing India’s main thermal pollution zones: Ganga Basin, Godavari River, Tamil Nadu, with sources and impacts."
Map and Table: Key thermal pollution areas in India, their sources, and environmental effects.

Global Regulatory Approaches (Brief Overview)

• Many countries regulate thermal discharge by limiting temperature increases above ambient water levels.
• Environmental agencies such as the CPCB (India) and EPA (USA) require monitoring and reporting of thermal effluents.
• Regulations primarily aim to prevent excessive warming near industrial and power-plant discharge points.

India’s main thermal pollution zones: Ganga Basin, Godavari River, Tamil Nadu, with sources and impacts.
Key thermal pollution areas in India, their sources, and environmental effects.

Conclusion: Key Takeaways on the Causes of Thermal Pollution

Thermal pollution is a growing threat to aquatic ecosystems worldwide. While natural events like hot springs or volcanic activity can warm water locally, human activities—power generation, industrial cooling, urban runoff, and deforestation—are the primary drivers of rising water temperatures.

Understanding these causes is the foundation for addressing thermal pollution. Identifying how and where heat enters water bodies helps inform future mitigation and policy decisions.

Download our free Thermal Pollution Handout PDF with an infographic, summary & mini-quiz

Key takeaway: Thermal pollution is preventable. Identifying the causes of thermal pollution helps inform future environmental planning and water management decisions.

Frequently Asked Questions (FAQs)

Q1: What exactly is thermal pollution?

It’s an abnormal rise in water temperature caused by human or natural factors.

Q2: What are the major human causes in India?

Power plant discharge, industrial cooling, urban heat runoff, loss of riverside forests, and construction-driven shallowing of rivers.

Q3: Can natural events also cause warming?

Yes—volcanoes, hot springs, heatwaves, and shallow-water heating during droughts can raise temperatures temporarily.

Q4: Why is increased water temperature a concern?

Because higher temperatures change the natural physical conditions of water bodies, which can lead to downstream ecological consequences.
(Learn more about the ecological effects of thermal pollution.)

Q5: Why do industries contribute significantly to thermal pollution?

Many industrial and power-generation processes rely on large volumes of water for cooling, which is often discharged back into water bodies at elevated temperatures.
(For mitigation strategies, see solutions to thermal pollution.)

Q6: Are there Indian regulations for thermal discharge?

Yes. CPCB and State PCBs set temperature limits under the Environment Protection Act, 1986, and most large plants are required to use cooling towers.

About the Author

I’m Soumen Chakraborty, the founder and lead researcher at GreenGlobe25. I specialize in translating complex data on pollution, climate risks, and sustainability into clear, actionable guides for Indian households and communities.

My work is based on a rigorous analysis of authoritative sources like the CPCB and WHO, following our publicly-available Fact-Checking Policy to ensure every piece of content is accurate and trustworthy.
LinkedIn: chakrabortty-soumen
Facebook: Ecoplanet

Last update on December 2025.

Thermal power plant releasing heated water into nearby river

What Is Thermal Pollution? 5 Key Causes, Real Impacts, and 7 Practical Solutions (2025 Guide)

Introduction

Imagine standing beside a river that feels unusually warm — warm enough to stress or endanger sensitive fish species. The culprit isn’t climate change alone; in many regions, heated wastewater from power plants and industries plays a major role.

This issue, known as thermal pollution, is increasingly altering aquatic ecosystems in many parts of the world.
In this updated 2025 guide, you’ll discover how it happens, real-world examples from India to Florida, and science-informed solutions that can help cool impacted waters and support healthier ecosystems.

This article summarizes insights from CPCB (India), NOAA, EPA, and USGS to ensure scientific accuracy.

This guide is written for students, educators, and environmentally conscious readers seeking a clear, science-backed explanation.

💧 What Is Thermal Pollution?

According to definitions used by the Central Pollution Control Board (CPCB) and the U.S. Environmental Protection Agency (EPA), thermal pollution occurs when human activities—such as power generation, industrial cooling, or urban discharge—alter the natural temperature of water bodies beyond levels aquatic ecosystems can tolerate.

In practical terms, the release of heated (or sometimes excessively cooled) wastewater can lower dissolved oxygen levels, disrupt aquatic metabolism, stress fish and invertebrates, and increase the likelihood of harmful algal blooms. These effects are especially pronounced in rivers, lakes, and coastal zones with limited natural mixing.

This guide synthesizes insights from peer-reviewed environmental research, CPCB assessments, and global case studies to explain how thermal pollution occurs, why it matters, and what governments, industries, and communities can do to reduce its impact.

Temperature vs. Dissolved Oxygen: A Quick Comparison

  • Ecological threshold: fish stress, migration disruption, and habitat degradation increase sharply once water temperatures exceed ~30 °C
  • Normal river water temperature: approximately 24–26 °C
  • Thermally polluted river temperature: often 32–35 °C near discharge zones
  • Dissolved oxygen levels: commonly reported to decline by 20–30% under sustained thermal stress

✅ At a Glance

  • Definition: Sudden or long-term change in water temperature caused by human activities
  • Primary causes: Thermal power plants, industrial discharge, loss of riparian vegetation
  • Immediate impacts: Oxygen depletion, fish mortality, algal blooms
  • Purpose of this guide: To explain causes, effects, and prevention strategies in a practical, evidence-based way

🌴 Case Study — Is Turkey Point Ready for Future Risks?

In 2025, researchers and environmental groups raised questions about whether Florida’s Turkey Point nuclear plant could handle rising heat, storms, and flooding — even as its operating license was extended.
Elevated wastewater temperatures have been associated with mangrove stress and localized loss in Biscayne Bay, showing how warmer-than-natural effluent stresses sensitive coastal ecosystems.

Engineering upgrades — such as modern cooling systems, mangrove restoration, and stricter discharge limits — offer practical recovery paths.
The Turkey Point case highlights a global challenge faced by many coastal and nuclear facilities adapting to warming waters.

The Turkey Point example highlights a broader global challenge for coastal and nuclear facilities adapting to warming waters.

🇮🇳 Thermal Pollution in India (2025 Overview)

Thermal pollution is an emerging concern for India’s rivers and coastal zones. From estuaries near power plants to inland waterways, heated industrial discharges are raising water temperatures, harming fish populations, and threatening livelihoods.

A 2024 Central Pollution Control Board (CPCB) assessment reported that select river stretches near thermal-power clusters exceeded recommended local temperature thresholds during peak summer months, increasing stress on aquatic ecosystems.

Yet progress is visible. Companies like NTPC, India’s largest power generator, are investing in advanced cooling systems and heat-reduction technologies — proof that energy generation and ecosystem protection can coexist when guided by science and regulation.

👉 Explore deeper case studies and local solutions in our extended article:
Explore more: Pollution in India (2025 Guide)

NASA thermal plume map showing global hotspots
Satellite image showing global hotspots where industrial heat discharge affects water bodies.

NASA Thermal Plume Map

Top 5 Causes of Thermal Pollution (and How They Affect Water Ecosystems)

Thermal pollution stems from everyday human activities — from how we generate electricity to how our cities manage rainwater. Below are the five biggest contributors and their real-world impacts on aquatic life, supported by 2023–2025 research.

📊 Thermal Pollution Causes & Typical Impacts

SourceTypical Temperature RiseKey Fact / ContextSource / Citation
Power Plants+10–15°F above intakeThe largest global source of artificial heat discharge. Can drastically warm nearby rivers.EPA Cooling Water Reports / CPCB India
Urban RunoffVariable, spikes after rainAsphalt and concrete heat stormwater before it enters rivers.NOAA Stormwater Studies, 2023
DeforestationModerate, steady riseLoss of tree shade increases solar heating in streams.Journal of Hydrology, 2023
Industrial EffluentOften much hotter than ambientSteel, refinery, and textile effluents raise local water temps.CPCB Industrial Effluent Report
Reservoirs / DamsSlow heating & stratificationImpounded water traps heat, altering aquatic balance.USGS Reservoir Studies

🌋 1. Power Plants — Overheating Our Rivers

Power plants use huge volumes of water to cool turbines, returning it up to 15°F (8°C) warmer than the source. This thermal discharge can kill sensitive fish and lower oxygen levels.

In 2022, sections of the Ohio River reached temperatures around 93°F near a coal plant—levels considered dangerous for cold-water species such as trout.

Solution: adopt closed-loop or dry-cooling systems to recycle water instead of releasing it hot. Renewable energy transition.

Heated wastewater discharge entering river ecosystem
Heated water discharge from a thermal power plant raises river temperature and affects aquatic life.

🌆 2. Urban Runoff — Heat from Asphalt and Concrete

During summer or storms, paved surfaces absorb and radiate heat, warming rainwater that flows into rivers. This can raise local water temperatures and increase the likelihood of algal blooms downstream.
Fixes that work: green roofs, permeable pavements, street trees, and stormwater ponds — proven to lower runoff temperature by 3–8°C. Green infrastructure benefits

🌳 3. Deforestation — Losing Nature’s Shade

When riparian trees are cleared, streams lose their natural canopy, exposing water to direct sunlight. The result: warmer temperatures, reduced oxygen, and degraded habitats.

Solution: restoring riverbank vegetation is one of the most cost-effective cooling methods — it shades streams, stabilizes banks, and supports biodiversity.

🏭 4. Industrial Effluents — Scorching Wastewater

Industries like steel, textile, and petrochemicals discharge high-temperature wastewater directly into rivers. This heated wastewater can alter aquatic ecosystems and may exceed regulatory limits when not properly treated.

Fixes:

  • Recover and reuse process heat
  • Build cooling ponds or cooling towers
  • Enforce thermal discharge permits
    (Sources: CPCB Industrial Effluent Report; EPA Cooling Water Studies)
Industrial effluent discharge from factory into river causing thermal pollution.
Industrial hot wastewater release altering local river temperature and oxygen balance.

🌊 5. Reservoirs and Dams — Slow Water, High Heat

Lakes, dams, and reservoirs trap heat more easily than flowing rivers. Stratification (layering) prevents mixing, making surface waters hotter and deep waters oxygen-poor.

Solutions:

  • Controlled release of cooler bottom water
  • Riparian replanting
  • Aeration systems to circulate trapped layers

📗 USGS Reservoir Temperature Studies.

For deeper technical details and extended case studies, see our supporting guide on the seven critical causes of thermal pollution.

⚠️ Case Highlight: The Ohio River Example

Thermal discharges from multiple power plants have warmed the Ohio River, threatening cold-water fish like trout. Restoration projects now focus on temperature-controlled outlets and cooling upgrades to reduce these impacts.

💬 Takeaway

Every major cause of thermal pollution — from industrial heat waste to urban sprawl — can be mitigated with smarter design and stronger policy.
Together, these five factors contribute significantly to human-driven temperature changes reported in many freshwater ecosystems.

The Devastating Effects of Thermal Pollution on Marine Life & Climate

Thermal pollution doesn’t just warm water — it reshapes entire aquatic ecosystems. Even a 3°C rise in water temperature can slash oxygen levels, kill fish, and disrupt global food webs. Studies by NOAA (2024) and CPCB India (2023) confirm that thermal discharges from power plants and industries are among the fastest-spreading ecological threats to aquatic life.

🔥 How Thermal Pollution Destroys Aquatic Life

1. Oxygen Depletion: The Silent Killer

Warm water can hold substantially less dissolved oxygen—sometimes reported to decline by up to ~40% in extreme, well-documented cases of prolonged thermal stress. in extreme cases, suffocating fish and invertebrates. Low oxygen triggers fish kills and creates “dead zones” in rivers and lakes.
💡 Fix: Reforest riverbanks or build artificial wetlands — both naturally re-oxygenate water.

2. Algal Blooms & Toxins

Rising water temperature fuels harmful algal blooms, such as Florida’s 2023 red tide, which produces toxins deadly to fish and humans alike. These blooms also block sunlight, reducing underwater photosynthesis.
📊 Supporting Data: USGS observed a 70% higher bloom frequency in thermally affected rivers.

3. Reproductive Stress and Decline

Species like salmon can’t spawn above 30°C (86°F) — disrupting food webs from plankton to predators. Continuous heat exposure reduces egg survival rates and alters migration patterns.

4. Ecosystem Chain Reactions

Warmer water affects zooplankton, corals, and mangroves, weakening entire coastal food webs. The result? Reduced biodiversity and lower carbon storage capacity.

🌿 Case Study: Turkey Point, Florida (2023)

In 2023, wastewater from the Turkey Point Nuclear Plant reached 95°F, contributing to severe stress and mortality in juvenile mangroves in nearby Biscayne Bay. This made shorelines more vulnerable to erosion.
➡️ Restoration teams now replant mangroves and upgrade plant cooling systems to prevent future damage — a practical example of ecosystem recovery after thermal stress.

Cooling canal system showing thermal gradient
Cooling canal system near a coastal nuclear plant, similar to Florida’s Turkey Point site.

⚠️ Why a 3°C Rise Threatens Global Fish Survival

Even small temperature increases can push species beyond their tolerance limits:

  • Salmon: Spawning failure above 30°C (NOAA, 2024).
  • Zooplankton: Population crash disrupts marine food chains.
  • Corals: Repeated bleaching leads to long-term reef decline.

🧠 Key Takeaway: A few degrees of heat can cause cascading ecological failures — from microbes to mammals.

Want a detailed breakdown of all impacts? Read our complete guide on the harmful effects of thermal pollution.

Additional Environmental Impacts of Thermal Pollution

Thermal pollution does more than just warm rivers — it disrupts entire ecosystems.
Here are three hidden impacts you should know:

  • Climate Feedback Loops: Warmer waters release trapped carbon dioxide, subtly accelerating global warming.
  • Oxygen Depletion: As temperature rises, dissolved oxygen levels drop — suffocating fish and aquatic plants.
  • Toxic Algae Growth: Warm, nutrient-rich water encourages cyanobacterial blooms that can contaminate drinking water and pose risks to local communities.

At a public health level, these descriptions are educational only and do not replace official advisories from environmental or water-quality authorities.

💡 Did you know? A single degree rise in water temperature can reduce oxygen solubility by up to 2% — enough to stress sensitive species.

⚙️ 7 Practical Solutions to Stop Thermal Pollution

1. Cooling Towers & Closed-Loop Systems

Modern power plants can swap once-through cooling for closed-loop systems, which recycle water instead of releasing it hot into rivers.
This method can substantially reduce heat discharges (often reported at 80–90% reduction in optimized systems).

🧩 Example: The U.S. EPA encourages discharge limits around 32°C (90°F) to protect aquatic life.

2. Constructed Wetlands — Nature’s Cooling Filters

Artificial wetlands mimic nature. They absorb excess heat, trap sediments, and filter pollutants before water returns to rivers.

🌿 Case Study: A pilot wetland in Miami cooled effluent by up to 6°C (11°F) while boosting biodiversity.

3. Riparian Shade Restoration

Replanting trees along riverbanks provides natural cooling and prevents erosion.

🌱 Example: Along the Ganga, community-led riparian planting projects reduced summer water temperatures by 4–6°C and improved fish habitats.

Household Takeaway:

Even small community actions—such as planting native trees along local streams, supporting green infrastructure, and reducing hot water runoff—can help keep nearby rivers cooler and healthier over time.

4. Stricter Discharge Permits

Governments play a vital role. EPA and CPCB guidelines generally recommend limiting industrial discharge temperatures to around 32°C (depending on region and category).
Stronger enforcement ensures industries adopt cleaner technologies and continuous monitoring.

5. Green Infrastructure in Cities

Urban runoff acts like a heat wave for rivers. Cities can cool it down with:

  • 🌳 Green roofs to absorb heat and rainwater
  • 🧱 Permeable pavements to filter and cool stormwater
  • 💧 Retention ponds that slowly release cooled water

Cities like Delhi and Bengaluru have adopted such designs, improving both water quality and groundwater recharge.

6. Floating Solar Panels as Thermal Barriers

Floating solar panels reduce evaporation and block direct sunlight, helping reservoirs stay cooler.

☀️ In Gujarat, floating solar projects not only generate renewable energy but also cut surface heating and algae growth.

7. Environmental Standards & Public Pressure

Sustainability isn’t optional anymore.
Companies adopting ISO 14001 environmental standards and transparent reporting gain trust and investor confidence.

🏭 Example: NTPC India now includes cooling efficiency and water conservation metrics in its sustainability reports.

For a deeper look at mitigation approaches, see our guide on smart solutions to reduce thermal pollution.

Further Reading: Deep Dives on Thermal Pollution

If you’d like to explore specific aspects of thermal pollution in more detail, these guides provide focused explanations:

Causes of Thermal Pollution: Human and Natural Sources Explained
Effects of Thermal Pollution: How Heat Discharge Affects Rivers and Aquatic Life
Solutions to Thermal Pollution: Practical and Policy-Based Mitigation Approaches
Thermal Pollution in India: Case Studies, Impacts, and Regulations

FAQ: Thermal Pollution Explained

1. What is thermal pollution?

It occurs when industries or power plants release heated or cooled water into rivers or lakes, disturbing natural temperatures and harming aquatic life.

2. What causes thermal pollution?

Main causes include power plant discharges, industrial effluent, deforestation, urban runoff, and dam reservoirs trapping heat.

3. Why is thermal pollution harmful?

Warm water holds less oxygen, stressing fish, corals, and aquatic plants. It also promotes harmful algal blooms and biodiversity loss.

4. Can thermal pollution affect humans?

Yes. It reduces fish stocks, contaminates drinking water through algae, and weakens aquatic ecosystems that communities depend on.

5. How can we prevent thermal pollution?

By using cooling towers, restoring riverbank vegetation, enforcing discharge limits, and installing floating solar panels to reduce heat.

6. Is thermal pollution linked to climate change?

Yes. Warm water releases carbon dioxide, which adds to global warming — and hotter climates worsen thermal stress on ecosystems.

7. Can thermal pollution be reversed?

Partially. With cooling upgrades, riparian restoration, and stricter regulations, many affected rivers can recover over time.

8. Is thermal pollution regulated in India?

Yes. In India, thermal pollution is regulated by the Central Pollution Control Board (CPCB) under the Water (Prevention and Control of Pollution) Act, 1974. Industries and power plants are required to control the temperature of wastewater discharged into rivers and lakes, with limits enforced by State Pollution Control Boards.

Note: The information in this FAQ is for educational purposes only and does not replace
guidance from public health, environmental, or water-quality authorities.

Last reviewed against CPCB guidance and international environmental research (2025).

About the Author

I’m Soumen Chakraborty, the founder and lead researcher at GreenGlobe25. I specialize in translating complex data on pollution, climate risks, and sustainability into clear, actionable guides for Indian households and communities.

My work is based on a rigorous analysis of authoritative sources like the CPCB and WHO, following our publicly-available Fact-Checking Policy to ensure every piece of content is accurate and trustworthy.
LinkedIn: chakrabortty-soumen
Facebook: Ecoplanet

Last update on December 2025.

Some of the images in this story were created using AI to help illustrate key concepts more clearly. They’re meant to support learning—not simulate real-world scenes.

Illustration showing point source pollution from a single discharge pipe contaminating a river.

Point Source Pollution: Causes, Effects & Solutions You Need to Know

Introduction

Ever wondered how a single untreated discharge pipe can significantly degrade a river’s water quality? That’s the dangerous reality of point source pollution — when harmful substances are discharged from a specific, identifiable source directly into the environment. Whether it’s untreated sewage flowing from city drains or toxic waste released by a factory, point source pollution is one of the leading causes of water and air contamination in India and around the world.

Millions in India depend on rivers for drinking water and farming. So when pollution enters through direct sources, the impact is fast and long-lasting. From the Ganga to local lakes, ecosystems are experiencing measurable stress due to sustained pollutant loads — also read 8 Types of Water Pollution in India to understand how point and non-point pollution differ. According to the Ministry of Jal Shakti, over 600 million Indians depend on rivers and groundwater for drinking, irrigation, and daily needs (NITI Aayog Composite Water Management Index, 2023).

Illustration showing wastewater entering a river from a single discharge pipe, representing point source pollution.
A clear example of point source pollution affecting Indian rivers.

In this blog, you’ll learn:

  • What exactly is point source pollution, and how is it different from other types
  • Real-world examples from India and abroad
  • The serious health, environmental, and economic impacts
  • What we can do — from policies to personal action — to stop it

By the end, you’ll see why addressing point source pollution requires participation from both institutions and individuals.

3 Key Takeaways About Point Source Pollution

  • Traceable: Comes from a single source, like a pipe, drain, or chimney
  • May increase the risk of waterborne diseases and contribute to fish deaths and long-term health impacts, depending on pollutant type and exposure levels (WHO & CPCB guidelines).
  • Solvable: Laws like the Water Act + tech like ETPs can stop it

Scroll down to learn how to take action in your city or neighborhood.

According to CPCB’s National Water Quality Monitoring Programme (NWMP), 311 river stretches across India failed to meet water quality norms in 2022, with most violations linked to untreated sewage and industrial discharge from identifiable sources. States such as Maharashtra, Madhya Pradesh, and Assam account for a significant portion of these polluted stretches.

Download Toolkit – Point Source Pollution Toolkit.pdf

What is Point Source Pollution?

Clear Definition with Simple Examples

Point source pollution refers to pollution originating from a single, identifiable source, such as a pipe, drain, or chimney, that directly discharges pollutants into the environment.

Unlike general pollution that spreads from multiple areas, point source pollution is easy to trace, which makes it more manageable, yet still dangerous.

Simple examples of point source pollution include:

  • A factory pipe discharging chemicals into a river
  • A sewage outlet draining untreated waste into a lake
  • An oil spill from a leaking tanker or ship
  • A thermal power plant’s smokestack releases ash into the air

In India, cities like Kanpur, Varanasi, and Bengaluru have seen their rivers and lakes suffer due to untreated waste entering from direct sources.

Key point: If you can “point” to where the pollution is coming from, it’s point source pollution.

Point source outlets are continuously monitored under CPCB’s Online Continuous Effluent Monitoring System (OCEMS), which tracks parameters like pH, BOD, COD, TSS, and ammonia in real time. Over 9,000 industrial units are connected to this system across India.

Side-by-side chart showing differences between point source and non-point source pollution in India
This comparison chart helps explain how point source pollution differs from non-point pollution.

Point Source vs Non-Point Source Pollution

Many people confuse point source pollution with non-point source pollution, but they are different in nature and treatment.

Here’s a simple comparison:

🔍 Feature🏭 Point Source Pollution🌧️ Non-Point Source Pollution
OriginSingle, identifiable sourceMultiple, scattered sources
ExamplePipe from a factoryRainwater runoff from farms or roads
Ease of RegulationEasier to monitor and regulateHarder to trace and control
Common in Cities LikeMumbai (factory outlets), Delhi (drains)Rural Punjab (fertilizer runoff), hill areas

Non-point source pollution typically occurs when rainwater picks up pollutants from roads, farms, and open lands, making it more diffuse and harder to manage.

Why this matters:
Understanding the difference helps us focus our efforts. Since point source pollution is easier to detect and regulate, it should be the first line of action in cleaning up rivers, lakes, and air in India.

Major Causes of Point Source Pollution in India and Globally

Industrial Wastewater and Factory Discharges

One of the biggest contributors to point source pollution is industrial waste. Factories, especially those near rivers or lakes, often release untreated or partially treated wastewater directly into water bodies.

In India, common examples include:

  • Textile and tannery units in Kanpur are releasing chemicals into the Ganga
  • Chemical plants in Gujarat are discharging toxic effluents into local rivers
  • Oil refineries are leaking into marine ecosystems near coastal ports

Even though laws like the Water (Prevention and Control of Pollution) Act, 1974, exist, many units either bypass them or lack proper treatment plants.

A CPCB assessment of industrial clusters found that only 33% of Common Effluent Treatment Plants (CETPs) operate at full compliance. Non-compliance hotspots include Vapi, Ankleshwar, Kanpur (Jajmau), and Patancheru, where heavy metals such as chromium, lead, cadmium, and nickel frequently exceed permissible limits.

In Kanpur’s Jajmau tannery belt, over 400 tanneries discharge chromium-rich wastewater, making it one of the most closely monitored point-source zones under the Ganga Action Plan.

Did you know?

A 2021 CPCB compliance audit reported that nearly half of monitored industrial units located along major Indian rivers were not meeting effluent discharge standards.

Map showing rivers in India affected by point source pollution
Major Indian rivers like the Ganga and Yamuna are impacted by point source pollution from industries and drains.

Sewage and Domestic Waste Outlets

Urban India is also a major source of point source pollution. In many cities, untreated or poorly treated sewage is discharged through direct pipelines into rivers and drains.

Common examples:

  • CPCB monitoring shows the Yamuna’s Delhi stretch consistently exceeds pollution norms, primarily due to untreated sewage discharged through 18 major drains.
  • Open drains in Kolkata carry black water into canals
  • Several investigations by the Karnataka State Pollution Control Board (KSPCB) confirm that Bellandur Lake produces toxic foam due to untreated industrial and domestic wastewater.

The problem worsens during monsoon when stormwater and sewage often mix, leading to flooding and contamination.

India generates nearly 38,000 MLD of sewage, but as of CPCB’s 2022–23 report, only 12,000 MLD of treatment capacity exists, while the actual operational capacity is about 10,000 MLD. This means less than 30% of sewage gets treated before entering rivers.

CPCB monitors 940+ drains nationwide, with Delhi’s Najafgarh drain alone contributing over 60% of the organic pollution load entering the Yamuna.

Urban Fact: India generates approximately 38,000 million litres per day (MLD) of sewage, of which only 30% is treated, according to CPCB’s 2021–22 Annual Report.

India’s Sewage Generation vs. Treatment Capacity (CPCB 2021–22)

ParameterValue
Total sewage generated38,000 MLD
Installed treatment capacity~28,000 MLD
Actual operational capacity~20,235 MLD
Untreated sewage discharged daily~18,000 MLD
% of sewage untreatedNearly 50%

Agricultural Discharges as Point Sources

While agriculture is mostly linked to non-point pollution, there are cases where point-source pollution occurs, especially when fertilizers, pesticides, or wastewater are discharged from specific points.

Examples include:

  • Irrigation tube wells that pump chemical-rich water into canals
  • Pesticide-contaminated runoff from greenhouse pipes
  • Poultry or dairy farms discharging waste into nearby streams

This form of pollution, although less talked about, is growing due to the rise of commercial farming in peri-urban areas.

Growing your food reduces urban water waste and pollution. Start small with a DIY balcony vegetable garden using natural compost.

Summary:
From industrial units to city sewage and even certain agriculture practices, point source pollution stems from clear, traceable sources, making it both a threat and an opportunity for targeted solutions.

Looking to reduce your water footprint? Here’s how to start a zero-waste lifestyle in India.

Environmental and Health Impacts of Point Source Pollution

Water Pollution and Harm to Aquatic Life

When toxic waste flows from a point source — like a factory pipe or sewage outlet — it often enters nearby rivers, lakes, or oceans. This can have a significant and measurable impact on aquatic ecosystems.

Common effects include:

  • Oxygen levels in water drop drastically
  • Fish and other species die or migrate
  • Algae blooms form, choking life underwater

In India:

  • Fish deaths are regularly reported in the Ulhas River near Mumbai due to industrial dumping

Many polluted river stretches show Biochemical Oxygen Demand (BOD) levels between 30–70 mg/L, far above the CPCB standard of 3 mg/L for outdoor bathing water. Total coliform counts often exceed 10,000 MPN/100 mL, whereas the permissible limit is 500 MPN/100 mL.

Long-term monitoring by the Ministry of Jal Shakti shows that fish populations decline sharply once dissolved oxygen (DO) falls below 3 mg/L, a common condition in heavily polluted stretches of the Yamuna, Musi, and Sabarmati rivers.

Fact: CPCB’s 2022 river assessment identified 311 polluted river stretches across India due to untreated industrial and municipal discharge.

Disclaimer:
This article provides general environmental and public health information for awareness purposes. It does not replace professional medical advice, diagnosis, or treatment. For health concerns related to water contamination, please consult a qualified healthcare provider or refer to advisories issued by the Ministry of Health & Family Welfare (MoHFW) and the World Health Organization (WHO).

Human Health Hazards

When Polluted water from drains and pipes often enters our drinking supply, it becomes a potential health risk, especially for lower-income families with limited access to clean water.

Health issues caused by point source pollution:

  • According to WHO drinking-water guidelines, exposure to untreated or contaminated water can increase the risk of waterborne illnesses such as cholera, dysentery, and typhoid, especially in areas lacking adequate treatment systems.
  • Research from WHO and ICMR indicates that chronic exposure to heavy metals such as lead and mercury may contribute to kidney dysfunction and neurological effects, depending on duration and concentration of exposure.
  • WHO notes that children are more susceptible to developmental and health impacts from contaminated water because of their lower body weight and higher water intake relative to body size.

Example: Studies by the Central Ground Water Board (CGWB) have documented arsenic contamination in parts of Bihar and Uttar Pradesh, where long-term exposure may be associated with skin lesions and other health risks, as reported in official advisories.

WHO drinking water guidelines note that exposure to untreated water increases the likelihood of waterborne diseases such as cholera, typhoid, and dysentery. CPCB studies also show that communities relying on polluted river stretches report higher incidences of gastrointestinal illness.

CPCB assessments indicate that **over 70% of India’s surface water may not meet recommended quality standards for drinking, bathing, or agriculture.

Health risks from polluted water depend on multiple factors, including exposure level, duration, and individual health conditions. For accurate assessment, refer to official guidelines from WHO, MoHFW, and CPCB.

Economic and Social Costs

The impact of point source pollution isn’t just environmental or health-related — it also hits local economies.
The NITI Aayog Water Index (2023) estimates that over 600 million Indians experience high to extreme water stress, largely due to polluted or over-extracted water sources.

Economic consequences include:

  • Reduced income for fisherfolk due to fish loss
  • Higher costs of water purification for cities
  • Expensive medical treatments for waterborne illnesses
  • Decline in tourism near polluted rivers or beaches

Case in point: Studies by the National Mission for Clean Ganga (NMCG) note that pollution affects cultural and tourism activities along several stretches of the Ganga, including Varanasi.

World Bank analyses estimate that polluted water contributes to 21% of communicable diseases in India.
NITI Aayog projections show India’s water demand may reach two times the available supply by 2030, potentially impacting 6% of GDP if pollution trends continue.

Bottom line:
Point source pollution doesn’t just damage the planet — it harms people, livelihoods, and the future. The effects ripple through the entire ecosystem and economy.

Solutions — How Can We Control Point Source Pollution?

Government Regulations and Monitoring

The fight against point source pollution starts with strong laws and active monitoring. In India and globally, many legal frameworks already exist, but enforcement is key.

India’s major efforts include:

Despite these frameworks, gaps remain. Many industrial units still operate without proper Effluent Treatment Plants (ETPs), and municipalities lack funds to upgrade sewage systems.

GIS mapping under the Namami Gange Programme now tracks drains, sewage treatment plants (STPs), and pollution hotspots across 97 towns in the Ganga basin. This allows regulators to identify major point-source discharge pathways and prioritize high-load drains for intervention.

Update: In 2024, the NGT penalized multiple industries in Haryana for direct waste discharge into the Yamuna.

Call-to-action banner encouraging action against point source pollution
Residents can use local reporting systems or civic platforms to address point source pollution in their community.

Technological Solutions and Best Practices

Technology can play a huge role in reducing point source pollution — if industries and cities adopt the right tools.

Effective solutions include:

  • ETPs and STPs (Effluent and Sewage Treatment Plants) — to clean wastewater before releasing it
  • Zero Liquid Discharge (ZLD) systems — ensure no industrial water is dumped untreated
  • IoT and AI monitoring systems — track pollutant levels in real-time for large factories
  • Green building norms — encourage sustainable water and waste management at source

CPCB mandates industries in priority clusters to adopt Zero Liquid Discharge (ZLD) systems wherever feasible. Compliance is monitored through the Online Continuous Effluent Monitoring System (OCEMS), which transmits real-time data on pH, BOD, COD, TSS, and flow to regulators for immediate action.

Some cities, like Pune and Indore, are adopting decentralized wastewater systems for better local control — a model that can be replicated across urban India.

Diagram showing how an Effluent Treatment Plant works to control point source pollution
Effluent Treatment Plants (ETPs) play a critical role in controlling point source pollution from industries.

What You Can Do as an Individual

Controlling point source pollution isn’t just the government’s job. We all have a role to play — starting at home and in our communities.

Simple actions you can take:

  • Avoid flushing medicines, oil, or paint down the drain
  • Support eco-certified products and responsible brands
  • Report illegal waste dumping using local civic apps (e.g., Swachhata App)
  • Raise awareness through social media, schools, and housing societies
  • Participate in cleanup drives or volunteer with local environmental groups

💡 Tip: If you live near a lake or river, talk to your local RWA (Resident Welfare Association) about monitoring drains and promoting STPs in the neighborhood.

Disclosure:
Some of the tools or products mentioned below may include affiliate links or third-party resources. We only recommend items or platforms that support environmental awareness and public interest. For more details, please review our Affiliate Disclosure page.

Helpful Tools to Fight Point Source Pollution


Tool
UseLink

🏛️ CPCB Grievance Portal
Check the water quality in your home or colonyOpen CPCB Grievance Portal

📱 Swachhata App
Report overflowing drains or sewage lines in your cityAccess the Android app

💧 DIY Water Testing Kit
Check water quality in your home or colonyView product listing

📊 River Monitoring Dashboard
See pollution levels in rivers across IndiaOpen the NMCG Dashboard

⚖️ National Green Tribunal (NGT)
File complaints about environmental violationsAccess NGT filing portal

The Swachhata App, launched under the Swachh Bharat Mission, has processed over 3 crore complaints nationwide. A significant portion of these reports relate to drain overflows, sewage leaks, and solid waste mismanagement—key contributors to point source pollution in urban areas

Save these links and share them with your RWA, school, or apartment group to take real action.

Small habits at home can prevent major water pollution. For guidance on reducing household waste, see our Zero Waste Lifestyle Ideas guide.

Final thought:
Though point source pollution is easier to trace, solving it still demands collective action from governments, industries, and individuals alike

Conclusion: Time to Tackle Point Source Pollution Together

Point source pollution might come from specific locations, but its impact spreads far and wide, affecting river quality, public health, and local economies. From industrial waste to untreated sewage, the sources may be clear, but the solutions need commitment from all sides.

In this blog, we explored:

  • What is point source pollution, and how does it differ from non-point sources
  • Major causes like factory discharges, city drains, and even agricultural outlets
  • It has harmful effects on water, health, and local livelihoods
  • Practical solutions — from policy and technology to individual action

The good news? Because this type of pollution is traceable, it’s easier to stop — if we act now.

Tip: You can report:

  • Clogged or overflowing drains
  • Open sewage lines
  • Illegal waste dumping

And best of all, you can track your complaint status directly in the app!

To dive deeper, explore our posts on DIY balcony gardening and light pollution awareness.

Let’s protect our rivers, lakes, and communities — through consistent participation in local environmental initiatives.

Transparency Note:
This article is updated periodically in alignment with new data from CPCB, NGT, WHO, and state pollution control boards.

Digital banner encouraging civic action against pollution
Every citizen can help stop point source pollution at the local level.

Download the Point Source Pollution Toolkit.pdf for additional reference materials.

Frequently Asked Questions (FAQs)

What is point source pollution in simple words?

Point source pollution refers to pollution that comes from a single, identifiable source, like a pipe, drain, or chimney. It’s easier to detect and control because you can “point” to exactly where the pollution is entering the environment.

What are 3 examples of point source pollution?

Three common examples of point source pollution are:
Industrial waste discharged from factory pipes
Sewage flowing from a municipal drain
Oil is leaking from a tanker into the ocean
These are direct sources that can be monitored and regulated.

How is point source pollution different from non-point source pollution?

The key difference is:
Point source pollution comes from one specific source (e.g., a factory pipe)
Non-point source pollution comes from scattered sources (e.g., rainwater runoff from fields)
Point source pollution is easier to trace, while non-point source pollution is diffuse and harder to control.

What are the main causes of point source pollution in India?

In India, the top causes of point source pollution include:
Industrial wastewater from chemical and textile factories
Untreated sewage from urban drains
Waste discharge from power plants and hospitals
Many of these are released directly into rivers, such as the Ganga and Yamuna.

How does point source pollution affect human health?

Point source pollution can contaminate drinking water and increase the risk of waterborne illnesses such as cholera and dysentery, according to WHO guidelines. Long-term exposure to chemical contaminants or heavy metals may contribute to health impacts depending on concentration, duration, and individual factors. Children may be more susceptible in areas where water treatment systems are inadequate.

What are some solutions to reduce point source pollution?

Effective solutions include:
Installing effluent and sewage treatment plants (ETPs and STPs)
Strict enforcement of environmental laws like India’s Water Act
Real-time pollution monitoring using IoT and sensors
Public awareness and reporting of illegal waste dumping

Who is responsible for controlling point source pollution?

Responsibility is shared among:
Governments that enforce environmental laws
Industries that must treat their waste
Citizens can report violations and reduce harmful habits
Everyone plays a role in controlling point source pollution.

Can point source pollution be eliminated?

It can be greatly reduced, but complete elimination requires:
Upgrading infrastructure
Transparent monitoring
Strong penalties for violations
Widespread public involvement
Some Indian cities have successfully reduced point source pollution with the right policies and technologies.

About the Author

I’m Soumen Chakraborty, the founder and lead researcher at GreenGlobe25. I specialize in translating complex data on pollution, climate risks, and sustainability into clear, actionable guides for Indian households and communities.

My work is based on a rigorous analysis of authoritative sources like the CPCB and WHO, following our publicly-available Fact-Checking Policy to ensure every piece of content is accurate and trustworthy.
LinkedIn: chakrabortty-soumen
Facebook: Ecoplanet

Last update on December 2025.

Editorial Standards

This article follows GreenGlobe25’s Editorial Policy, which includes:
• Verification of facts using CPCB, WHO, and government datasets
• Clear distinction between information, opinion, and guidance
• Regular updates based on new environmental reports
• Independent review to ensure accuracy and public benefit

References & Data Sources

• Central Pollution Control Board (CPCB), Annual Report 2021–22
• CPCB River Rejuvenation Committee Assessment Report, 2022
• Ministry of Jal Shakti – Composite Water Management Index (NITI Aayog, 2023)
• World Health Organization (WHO), Guidelines for Drinking-water Quality
• WHO – Children and Environmental Risks Report
• Indian Council of Medical Research (ICMR) – Heavy Metal Exposure Report
• Central Ground Water Board (CGWB) – Arsenic Contamination Advisory (2022)
• Karnataka State Pollution Control Board (KSPCB) – Bellandur Lake Assessment
• National Mission for Clean Ganga (NMCG) – Ganga Basin Status Reports

Illustration showing different Types of Water Pollution including plastic waste, chemical spills, and oil contamination

8 Major Types of Water Pollution: Causes, Effects, and Real-World Examples in India

Introduction

Water is the foundation of all life — it sustains every plant, animal, and human on Earth. Yet in 2025, clean and safe water remains out of reach for millions, according to global water sanitation assessments. According to estimates from the World Health Organization (WHO, 2024), unsafe and contaminated water is linked to more than 1.4 million preventable deaths each year.

In India, rivers such as the Ganga, Yamuna, and Mithi frequently carry plastics, sewage, and industrial waste, as documented in CPCB and state pollution reports. Groundwater is also affected, as pesticides and heavy metals can seep through soil layers and contaminate aquifers used for drinking water. Polluted water sources can contribute to ecological damage and increased health risks for communities.

Simply put, water pollution occurs when human activities introduce harmful substances into natural water bodies such as rivers, lakes, oceans, or underground aquifers. These pollutants — whether chemical, biological, or plastic-based — degrade water quality, harm ecosystems, and threaten human health.

In this guide, you’ll explore the eight major types of water pollution, from groundwater and surface water contamination to oil spills and oxygen depletion. You’ll also learn about their main causes, real-world examples in India, and the most practical solutions to prevent them.

By the end, you’ll understand not just what water pollution is — but how it affects your health, your environment, and what can be done today to protect this most vital resource.

🌍 For current data and progress updates, refer to the WHO Water, Sanitation and Hygiene (WASH) Report 2024.

This guide is for general educational purposes about water pollution and public health. It does not provide medical advice or diagnosis. For personal health concerns, please consult a qualified healthcare professional.

Related Guide:
For a deeper understanding of India’s pollution challenges, see our article on Thermal Pollution Explained and How Water Pollution Affects River Ecosystems.

📊 Key Water Pollution Stats – India (2025)

  • 💧 Nearly 70% of India’s surface water is unsafe for direct consumption (DevelopmentAid 2025, citing CPCB data).
  • 🧴 India generates around 4.1 million tonnes of plastic waste annually. (MoEFCC 2024 PDF)
  • 🚱 About 80% of urban sewage remains untreated before entering rivers. (CPCB 2021)
  • 🌊 The Ganga and Yamuna Rivers rank among the world’s most polluted. (World Water Quality Index 2024)
  • 🐟 Globally, contaminated water is associated with an estimated 1.4 million premature deaths each year (WHO 2024).

Table: Major Types of Water Pollution in India (2025) – Causes, Effects & Examples

Type of PollutionMain SourceKey ImpactExample in India (2025)
Surface Water PollutionSewage, industrial wasteContaminated rivers and lakesGanga and Yamuna Rivers
Groundwater PollutionPesticides, heavy metalsUnsafe drinking water sourcesPunjab and Haryana regions
Thermal PollutionPower plants, industrial dischargeReduced oxygen, fish deaths Coastal Tamil Nadu (Thermal Pollution in India)
Oil PollutionShipping accidents, leaksMarine ecosystem damageMumbai coastline
Plastic PollutionSingle-use plastics, litterMicroplastics in rivers and oceans Ganga River, Arabian Sea (Plastic Pollution in India)
Oxygen DepletionOrganic waste, sewageAlgal blooms, fish deathsVembanad Lake
Nutrient PollutionFertilizers, agricultural runoffEutrophication of lakesKerala backwaters
Microbiological PollutionBacteria, viruses, pathogensWaterborne diseasesUrban slum areas

Alt text: Table showing major types of water pollution in India (2025) with their causes, effects, and real examples.

Types of Water Pollution

1. Groundwater Pollution

pollution showing toxic chemicals leaking from underground storage tanks into drinking water sources
Hidden contamination from leaking tanks, pesticides, and industrial waste seeps into underground aquifers, making water unsafe for communities.

Illustrative conceptual graphic used for educational explanation — not a real photograph.

Groundwater Pollution:

Groundwater pollution is often difficult to detect because it occurs underground and may persist for long periods. This section explains how contaminants seep into aquifers and affect drinking water.

1. What It Is
Groundwater is the hidden water stored in soil, sand, and rock layers beneath the Earth’s surface. Many communities rely on it as their primary source of drinking water, making it critical for human health. When pollutants seep into the ground, they can contaminate aquifers silently, often without visible signs. Unlike rivers or lakes, groundwater pollution is difficult to detect and may remain unnoticed for years, quietly affecting everyone who depends on wells and boreholes.

2. Main Causes
Groundwater contamination usually occurs gradually but can have serious long-term consequences. The most common causes include:

  • Agricultural Chemicals: Pesticides, herbicides, and synthetic fertilizers applied to crops can percolate into the soil. Rainwater carries these substances deeper underground, where they accumulate in aquifers.
  • Industrial Waste and Toxic Spills: Factories and processing plants may leak hazardous chemicals through cracked containment systems or accidental spills.
  • Leaking Underground Storage Tanks: Tanks storing fuel, solvents, or industrial waste can corrode, releasing toxic substances directly into the soil.
  • Septic Systems and Landfills: Poorly maintained septic tanks and unlined landfills allow sewage and leachate to seep into groundwater, contaminating nearby wells.

3. Effects on People and the Environment
Groundwater pollution is especially dangerous because it can persist for decades. Even after the original pollution source is removed, contamination may linger underground, making remediation costly and complex. Key impacts include:

  • Unsafe Drinking Water: Polluted groundwater may contain nitrates, heavy metals, and chemicals such as arsenic or benzene, which are associated with long-term health risks according to WHO and EPA studies.
  • Health Risks: Long-term exposure to contaminated groundwater has been associated with cancer, neurological effects, reproductive complications, and kidney-related issues, as documented in WHO and EPA health assessments.
  • Environmental Harm: Contaminated groundwater can seep into rivers, lakes, and wetlands, threatening aquatic life and spreading pollution far from the original source.

4. Solutions and Prevention
While cleaning polluted groundwater is challenging, proactive measures can prevent contamination and reduce risks:

  • Reduce Agricultural Chemicals: Adopt organic or precision agriculture to minimize pesticide and fertilizer use.
  • Proper Waste Disposal: Hazardous industrial and household waste should be safely disposed of according to regulations.
  • Upgrade Storage Systems: Replace old underground tanks with modern, corrosion-resistant alternatives.
  • Monitoring and Regulation: Authorities should regularly monitor soil and groundwater quality near industrial sites, farms, and landfills to catch pollution early.

For more guidance, visit the EPA Groundwater Contamination Page for official recommendations and regulatory guidelines.

2. Surface Water Pollution

Surface water pollution with plastic waste and untreated sewage contaminating rivers and lakes
Visible waste like plastics, industrial discharge, and sewage pollute rivers, lakes, and oceans, threatening wildlife and human health.

Illustrative conceptual graphic used for educational explanation — not a real photograph.

Surface Water Pollution:

Rivers, lakes, and ponds are increasingly affected by visible pollutants such as plastics and sewage.

1. What It Is
Surface water pollution occurs when harmful substances enter visible water bodies such as rivers, lakes, ponds, reservoirs, and oceans. Unlike groundwater, which lies hidden underground, surface water contamination is often easier to detect—think garbage floating in rivers, oil slicks on lakes, or discolored water.

However, visibility doesn’t mean the problem is easy to solve. Every year, industries, farms, and households contribute pollutants to waterways, as documented in various environmental reports.

2. Main Causes
Surface water pollution arises from multiple human activities:

  • Industrial Waste: Some factories still release untreated or poorly treated wastewater containing toxic chemicals, heavy metals, or heated water into rivers and streams.
  • Plastic and Solid Waste: Plastics, bottles, and packaging often find their way into waterways. Over time, they break down into microplastics, which are ingested by fish and eventually enter the human food chain.
  • Untreated Sewage: Outdated or missing sewage treatment systems allow raw sewage to flow into rivers and lakes, introducing bacteria, viruses, and excess nutrients.
  • Stormwater Runoff: Rainwater washing over streets, parking lots, and construction sites picks up oil, chemicals, and debris, which then enters local water bodies.

3. Effects on People and the Environment
Surface water pollution produces immediate and visible impacts:

  • Decline in Aquatic Life: Pollutants lower oxygen levels and harm fish and other aquatic organisms, causing fish kills and loss of biodiversity.
  • Spread of Diseases: Contaminated water can trigger outbreaks of cholera, dysentery, and other illnesses, especially in communities without safe drinking water infrastructure.
  • Unsafe Drinking Water: Rivers and lakes are major drinking water sources. Contamination raises treatment costs and can render water undrinkable.
  • Economic Losses: Polluted waterways can negatively affect fisheries, tourism, and recreational activities, leading to significant economic losses in affected regions.

4. Solutions and Prevention
Protecting surface water requires combined efforts from governments, industries, and individuals:

  • Proper Waste Treatment: Industries must treat wastewater to remove toxins before discharge.
  • Improved Sewage Infrastructure: Upgrading treatment facilities prevents harmful microorganisms and nutrients from entering water bodies.
  • Reduce Plastic Use: Switching to reusable products and supporting plastic bans can significantly cut pollution.
  • Stronger Environmental Regulations: Governments must enforce strict laws against illegal dumping and ensure companies follow sustainable practices.

For further reading on plastic pollution and global initiatives, visit the United Nations Environment Programme.

3. Microbiological Pollution

Microbiological pollution with harmful bacteria and viruses contaminating drinking water sources
Invisible pathogens from sewage and animal waste enter water supplies, causing serious diseases and public health risks.

Illustrative conceptual graphic used for educational explanation — not a real photograph.

Microbiological Pollution:

Bacteria, viruses, and parasites can contaminate water and increase the risk of waterborne diseases. This section describes how poor sanitation and inadequate treatment fuel microbiological pollution.

1. What It Is
Microbiological pollution, also known as biological contamination, occurs when disease-causing microorganisms—bacteria, viruses, and parasites—enter water sources. This pollution is particularly dangerous because it is invisible to the naked eye, yet it can trigger serious disease outbreaks in humans and animals.

In many low-income regions, microbiological pollution is considered one of the major threats to public health. According to WHO assessments, contaminated drinking water causes millions of preventable deaths each year, with children being the most affected.

2. Main Causes
Microbiological contamination usually stems from poor sanitation and inadequate waste management. Key sources include:

  • Untreated Sewage: Discharging human waste directly into rivers, lakes, or coastal waters introduces pathogens such as E. coli, cholera, and hepatitis viruses.
  • Animal Waste: Livestock farms produce large amounts of manure. Rainwater runoff can carry bacteria and parasites from these farms into nearby streams and ponds.
  • Poor Hygiene Infrastructure: Open defecation and lack of proper toilets allow fecal matter to seep into both groundwater and surface water.
  • Flooding and Natural Disasters: Heavy rains or floods can overwhelm sanitation systems, mixing sewage with drinking water supplies.

3. Effects on People and the Environment
The impacts of microbiological pollution can be severe and far-reaching:

  • Waterborne Diseases: Contaminated water spreads illnesses like cholera, typhoid fever, dysentery, hepatitis A, and parasitic infections such as giardiasis.
  • High Infant Mortality: Diarrheal diseases linked to unsafe water are a leading cause of child deaths in many developing countries.
  • Economic Burden: Families and governments face increased healthcare costs, lost productivity, and expenses for emergency water supply measures.
  • Threat to Aquatic Life: Some pathogens also harm fish and amphibians, disrupting food chains and biodiversity.

4. Solutions and Prevention
Preventing microbiological pollution requires combined efforts in sanitation, infrastructure, and public education:

  • Invest in Sewage Treatment: Modern facilities can remove most pathogens before wastewater is discharged.
  • Protect Water Sources: Buffer zones around rivers and lakes help prevent contamination from human and animal waste.
  • Educate Communities: Public health campaigns promoting handwashing, latrine use, and safe hygiene practices are essential.
  • Provide Safe Drinking Water: Solutions such as chlorination, filtration, and protected wells can dramatically reduce disease risk.

According to WHO (2024), waterborne pathogens remain a major contributor to illness in low- and middle-income regions.

For more detailed guidance, visit the Centers for Disease Control and Prevention (CDC) on preventing waterborne diseases.

4. Chemical Water Pollution

Chemical water pollution from industrial waste and agricultural runoff contaminating rivers and groundwater
Hazardous chemicals from factories, farms, and households seep into water sources, posing severe risks to people and ecosystems.

Illustrative conceptual graphic used for educational explanation — not a real photograph.

Chemical Water Pollution:

Toxic chemicals from farms, factories, and households can enter water supplies. This section explains which pollutants are most harmful and how they accumulate over time.

1. What It Is
Chemical water pollution occurs when harmful synthetic substances enter natural water sources. Unlike organic waste or bacteria, many chemicals are highly persistent, remaining toxic in the environment for decades. What makes this type of pollution especially concerning is that most chemicals are invisible and tasteless—people may unknowingly consume contaminated water for years.

From heavy metals in industrial effluents to pesticide residues in agricultural runoff, chemical water pollution is a global problem that threatens human health, wildlife, and entire ecosystems.

2. Main Causes
Chemical pollutants reach rivers, lakes, groundwater, and oceans through several channels:

  • Industrial Waste: Factories and mining operations sometimes release wastewater containing heavy metals such as mercury, lead, cadmium, and arsenic. Even at low concentrations, these metals are highly toxic.
  • Agricultural Runoff: Pesticides, herbicides, and fertilizers used on farms can be washed into streams and rivers or seep into underground aquifers during rainfall.
  • Oil Spills: Accidental releases of crude oil from tankers, pipelines, or drilling rigs contaminate coastal waters. Even small spills can significantly harm marine life.
  • Household Chemicals: Everyday products, including cleaning agents, paints, solvents, and pharmaceuticals, often enter water systems that are not equipped to remove them completely.
  • Landfill Leachate: Rainwater filtering through landfills can pick up chemicals that then seep into groundwater.

3. Effects on People and the Environment
The impacts of chemical pollution are severe and long-lasting:

  • Toxic Drinking Water: Consuming water contaminated with heavy metals or industrial chemicals has been associated with neurological effects, increased cancer risk, and reproductive health concerns, according to WHO and EPA research.
  • Harm to Aquatic Life: Chemicals disrupt reproductive systems in fish and amphibians, leading to population declines and sometimes species extinction.
  • Bioaccumulation: Toxic substances accumulate in small organisms, and as predators consume them, these toxins move up the food chain, eventually reaching humans.
  • Soil and Crop Damage: Using polluted water for irrigation introduces toxic substances into soil, reducing agricultural productivity and compromising food safety.

4. Solutions and Prevention
Tackling chemical water pollution requires a mix of regulation, innovation, and personal responsibility:

  • Stricter Regulations: Governments must enforce environmental laws limiting industrial discharge into waterways.
  • Eco-Friendly Farming: Farmers can adopt integrated pest management and organic practices to reduce chemical runoff.
  • Improved Industrial Practices: Modern factories can implement closed-loop systems to recycle wastewater and minimize contamination.
  • Rapid Spill Response: Oil spill teams and containment measures should be ready to address accidental releases quickly.
  • Responsible Household Choices: Consumers can switch to biodegradable cleaning products and properly dispose of unused medications.

EPA guidelines emphasize that agricultural chemicals such as nitrates and phosphates are key contributors to freshwater degradation (EPA, 2024).

For further reading on chemical contamination and its impacts, check the National Geographic Water Pollution Resource.

5. Thermal Pollution

Thermal pollution illustration – factory releasing hot water into river in India
Factories and power plants release warm water into rivers and lakes, lowering oxygen levels and disrupting aquatic life.

Illustrative conceptual graphic used for educational explanation — not a real photograph.

Thermal Pollution:

Heated water from factories and power plants can disrupt aquatic life by lowering oxygen levels. This section explains why temperature changes can be as damaging as some chemical spills.

1. What It Is
Thermal pollution occurs when human activities significantly increase the temperature of natural water bodies. Although it may seem less harmful than chemical spills or oil leaks, excess heat can severely disrupt aquatic ecosystems over time.

Water naturally maintains temperature ranges suitable for countless species. When factories, power plants, or industrial facilities discharge heated water, it lowers oxygen levels and alters habitat conditions, putting fish, amphibians, and other aquatic organisms at risk.

Power plants and factories often release heated water directly into rivers (Thermal Pollution), causing oxygen depletion and fish deaths.

2. Main Causes
Thermal pollution usually stems from a combination of industrial practices and environmental changes:

  • Power Plants and Factories: Facilities using water for cooling often return it to rivers or lakes at much higher temperatures. Sudden temperature changes can harm or displace sensitive aquatic species.
  • Deforestation: Trees and vegetation provide shade that keeps water bodies cool. Removing them allows sunlight to heat water surfaces more quickly.
  • Urban Runoff: Rainwater flowing over concrete, asphalt, and rooftops absorbs heat before entering waterways, raising water temperatures.
  • Climate Change: Rising global temperatures exacerbate local heating effects, further stressing aquatic ecosystems.

3. Effects on People and the Environment
Thermal pollution impacts ecosystems and human activities in several ways:

  • Reduced Oxygen Levels: Warm water holds less dissolved oxygen, causing fish and invertebrates to suffocate or migrate.
  • Loss of Biodiversity: Species adapted to narrow temperature ranges may disappear from affected areas.
  • Algae Blooms: Higher temperatures accelerate algae growth. Algal blooms consume oxygen and release toxins, harming aquatic life and water quality.
  • Disrupted Reproduction: Many fish and amphibians rely on seasonal temperature cues to spawn. Constantly elevated temperatures interfere with their breeding cycles.

While thermal pollution may not always pose immediate human health risks, it can devastate fisheries, recreational water use, and drinking water supplies.

4. Solutions and Prevention
Limiting thermal pollution requires a mix of technological solutions and environmental management:

  • Cooling Ponds and Towers: Power plants can use these systems to dissipate heat before returning water to rivers or lakes.
  • Riparian Planting: Restoring trees and vegetation along waterways shades and cools water naturally.
  • Heat Recovery Technologies: Industries can capture waste heat for reuse, reducing the temperature of discharged water.
  • Urban Planning: Designing cities with green spaces, permeable surfaces, and water-sensitive infrastructure minimizes heat absorption and runoff.

For more detailed information on industrial thermal impacts, visit the Environmental Protection Agency.

6. Oxygen-Depleting Pollution

Oxygen-depleting pollution causing algae blooms and dead zones in water bodies
Areas of severely reduced oxygen levels, often called ‘dead zones,’ where most aquatic species cannot survive.

Illustrative conceptual graphic used for educational explanation — not a real photograph.

Oxygen-Depleting Pollution:

Excess nutrients trigger algae blooms that consume oxygen and create “dead zones.” This section explains how human activities can turn healthy waters into low-oxygen environments.

1. What It Is
Oxygen-depleting pollution occurs when excess organic matter or nutrients enter a water body, triggering uncontrolled growth of microorganisms. As bacteria break down this material, they consume large amounts of dissolved oxygen, leaving insufficient levels for fish, plants, and other aquatic life.

This imbalance can transform healthy rivers, lakes, or coastal waters into “dead zones”—areas where almost no life can survive. Oxygen depletion is widely recognized as a major driver of ecosystem collapse in both freshwater and marine environments.

2. Main Causes
Several human activities contribute to oxygen depletion:

  • Agricultural Runoff: Fertilizers rich in nitrogen and phosphorus wash into streams and rivers, fueling massive algae blooms.
  • Untreated Sewage: Raw sewage or poorly treated wastewater introduces organic matter and bacteria that strip oxygen from water.
  • Industrial Discharges: Food processing plants, slaughterhouses, and paper mills often release nutrient-laden waste.
  • Stormwater Pollution: Heavy rains carry organic debris, animal waste, and yard clippings into waterways, accelerating oxygen loss.

3. Effects on People and the Environment
Oxygen-depleting pollution has significant and sometimes irreversible impacts:

  • Dead Zones: Large areas of freshwater and marine ecosystems become uninhabitable for fish, crustaceans, and other species.
  • Mass Fish Deaths: Sudden drops in oxygen can cause sudden, widespread fish deaths within hours.
  • Toxic Algal Blooms: Nutrient overload encourages cyanobacteria growth, producing toxins that threaten human and animal health.
  • Water Quality Decline: Decomposing organic matter creates foul odors and sludge, rendering water unsafe for drinking, recreation, and fisheries.

One of the largest dead zones in the world forms in the Gulf of Mexico, where nutrient runoff from farms along the Mississippi River causes annual algae blooms that suffocate marine life.

4. Solutions and Prevention
Reducing oxygen-depleting pollution requires sustainable farming, improved waste management, and ecological conservation:

  • Nutrient Management: Farmers can adopt precision agriculture techniques to reduce fertilizer use and prevent runoff.
  • Upgraded Wastewater Treatment: Modern treatment plants remove excess organic material and nutrients before water is discharged.
  • Wetland Protection: Wetlands naturally filter nutrients and sediments, preventing them from reaching rivers and lakes.
  • Buffer Strips: Planting vegetation along waterways absorbs excess nutrients and slows surface runoff.

For more information on nutrient pollution and effective prevention strategies, visit the United States Environmental Protection Agency’s Nutrient Pollution page.

7. Oil Pollution

oil spill pollution in Indian coastal waters 2025
Spills and leaks create toxic slicks that suffocate marine animals, damage coastal ecosystems, and leave long-lasting environmental scars.

Illustrative conceptual graphic used for educational explanation — not a real photograph.

Oil Pollution:

Oil slicks from spills and leaks coat water surfaces, disrupting marine life and habitats. This section explains how small and large oil spills can create long-term environmental impacts.

1. What It Is
Oil pollution occurs when petroleum products spill or leak into oceans, rivers, or coastal areas, forming a thick, toxic layer on the water’s surface. This slick blocks sunlight and reduces oxygen exchange, severely disrupting aquatic ecosystems. While large tanker disasters often grab headlines, smaller but frequent leaks from ships, pipelines, and land-based sources cumulatively cause serious environmental damage.

Unlike some contaminants, oil does not dissolve in water. It spreads rapidly, coating everything it touches in a sticky, poisonous film that can persist for years.

2. Main Causes
Oil pollution stems from both accidental and intentional human activities:

  • Tanker Accidents: Large oil tankers can spill millions of gallons of crude oil during collisions or groundings.
  • Offshore Drilling: Oil platforms extracting from beneath the seabed sometimes experience blowouts or leaks.
  • Pipeline Leaks: Underground or undersea pipelines may rupture due to corrosion, poor maintenance, or natural disasters.
  • Illegal Dumping: Some ships discharge oily waste or bilge water into the sea to avoid disposal fees.
  • Runoff from Land: Used motor oil, lubricants, and industrial residues often enter waterways via storm drains.

3. Effects on People and the Environment
Oil pollution is visually striking and causes significant ecological harm:

  • Marine Animals: Oil can coat birds’ feathers, reducing insulation and buoyancy, increasing the risk of hypothermia or drowning.
  • Fish and Shellfish: Toxic compounds damage gills and organs, causing suffocation, poisoning, or reproductive failure.
  • Beaches and Coastal Communities: Oil slicks ruin beaches, harm tourism, and require expensive cleanup operations.
  • Long-Term Damage: Even after cleanup, residues remain in sediments and food chains for decades.

A historic example is the 1989 Exxon Valdez spill, which released nearly 11 million gallons of crude oil into Alaska’s Prince William Sound. Its ecological effects are still evident today.

4. Solutions and Prevention
Preventing and managing oil pollution requires a mix of regulation, technology, and public awareness:

  • Strict Regulations and Enforcement: Governments must mandate double-hulled tankers, regular inspections, and comprehensive spill response plans.
  • Advanced Cleanup Methods: Skimmers, booms, and bioremediation techniques improve the effectiveness of spill management.
  • Proper Waste Disposal: Mechanics and industries should recycle used oil and avoid illegal dumping.
  • Transition to Renewable Energy: Reducing fossil fuel reliance lowers the risk of oil-related accidents.

For further information on oil spill prevention and response, visit the National Oceanic and Atmospheric Administration (NOAA).

8. Suspended Matter Pollution

Suspended matter pollution showing murky water filled with soil, silt, and debris from erosion and construction
Excessive sediments and particles cloud waterways, block sunlight, and damage aquatic habitats.

Illustrative conceptual graphic used for educational explanation — not a real photograph.

Suspended Matter Pollution:

Sediments, silt, and debris cloud water and damage aquatic habitats. This section explains how everyday erosion and construction activities contribute to this often-overlooked form of pollution.

1. What It Is
Suspended matter pollution occurs when solid particles—such as soil, silt, sand, and industrial debris—remain floating in water rather than dissolving. While some sediment naturally enters rivers and lakes, excessive amounts from human activities can cloud waterways, reduce sunlight penetration, and smother aquatic habitats.

This type of pollution is often referred to as turbidity, as it makes water appear dirty or murky. Although it may seem less immediately harmful than chemical or oil pollution, suspended matter can severely disrupt aquatic ecosystems over time.

2. Main Causes
Suspended matter pollution arises from several land-based activities:

  • Soil Erosion: Deforestation and poor farming practices remove protective vegetation, allowing rainwater to wash exposed soil into streams.
  • Construction Sites: Roads, buildings, and industrial facilities generate loose soil and debris, which runoff carries into waterways.
  • Mining Operations: Open-pit mining and excavation stir up sediment that can travel long distances in rivers.
  • Industrial Waste Discharges: Factories may release particles from manufacturing processes directly into water bodies without proper filtration.

3. Effects on People and the Environment
Suspended particles impact water quality and aquatic life in multiple ways:

  • Reduced Sunlight: Murky water blocks sunlight from reaching underwater plants, slowing photosynthesis and lowering dissolved oxygen levels.
  • Clogged Fish Gills: Fine sediments can damage or obstruct fish gills, causing suffocation or infection.
  • Disrupted Food Chains: Sediment can smother fish eggs and aquatic insects, reducing survival rates and biodiversity.
  • Decreased Drinking Water Quality: Excess sediment increases water treatment costs and may carry attached pollutants like heavy metals and pesticides.

Indirectly, suspended matter pollution also harms fisheries, recreational areas, and local communities dependent on clean water.

4. Solutions and Prevention
Effective management of sediment pollution requires combining sustainable land practices with improved industrial controls:

  • Reforestation and Vegetation Cover: Planting trees and maintaining ground cover stabilizes soil and prevents erosion.
  • Erosion Control Measures: Silt fences, terracing, and sediment ponds at construction sites trap particles before they reach waterways.
  • Responsible Mining Practices: Mining companies should implement runoff control systems to capture sediment.
  • Improved Industrial Filtration: Factories can install filters and sedimentation tanks to remove particles from wastewater before discharge.

Want to explore more?
See how this pollution type connects with broader issues in India in our guide: Point Source Pollution: Causes, Effects & Solutions

Conclusion: How to Reduce Water Pollution

Water pollution is one of the most pressing environmental challenges of our time. But it’s also preventable. By understanding the different types—from oil spills to chemical contamination—and recognizing their causes and effects, we can take meaningful action to protect our health and our planet.

This article provides general educational information about water pollution and its environmental and public health impacts. It is not medical advice. For personal health concerns or diagnosis, please consult a qualified healthcare professional.

Explore More Water Pollution Topics

Frequently Asked Questions (FAQ)

What are the 8 main types of water pollution?

The main types are surface water pollution, groundwater pollution, microbiological pollution, chemical pollution, thermal pollution, oxygen-depleting pollution, oil pollution, and suspended matter pollution.

What is the most common cause of water pollution?

Agricultural runoff is widely considered one of the leading causes of water pollution worldwide. Fertilizers and pesticides from farms often wash into rivers, alongside untreated sewage and factory waste.

How does water pollution affect human health?

Contaminated water can increase the risk of diseases such as diarrhea, cholera, and other waterborne illnesses. Long-term exposure to certain pollutants has been associated with cancer, neurological effects, and reproductive health concerns, according to WHO reports.

What are some examples of chemical water pollution?

Examples include pesticides, heavy metals like mercury and lead, industrial waste, and oil spills—all of which can harm humans and wildlife.

How can individuals reduce water pollution at home?

You can help by using fewer chemicals, avoiding plastic waste, using natural cleaners, reducing lawn fertilizers, and maintaining your septic system.

What is a dead zone in the ocean or rivers?

A dead zone is an area with almost no oxygen in the water. It happens when pollution causes algae to grow, die, and decompose, reducing oxygen levels to the point where marine life cannot survive.

Why is plastic pollution so harmful to water bodies?

Plastic breaks down into microplastics that are eaten by fish and animals. It pollutes oceans, harms ecosystems, and can even end up in our drinking water and food.

What are some modern solutions to stop water pollution?

Modern solutions to stop water pollution include natural methods like bioremediation (using microbes to clean pollutants), stricter environmental regulations, green infrastructure (like rain gardens and permeable pavements), and community clean-up initiatives. These approaches help prevent and reduce pollution at both local and global levels.

About the Author

I’m Soumen Chakraborty, the founder and lead researcher at GreenGlobe25. I specialize in translating complex data on pollution, climate risks, and sustainability into clear, actionable guides for Indian households and communities.

My work is based on a rigorous analysis of authoritative sources like the CPCB and WHO, following our publicly-available Fact-Checking Policy to ensure every piece of content is accurate and trustworthy.
LinkedIn: chakrabortty-soumen
Facebook: Ecoplanet

Last update on December 2025.

References

What You Can Do Today

  • Never dump trash, oil, or chemicals into drains or waterways.
  • Reduce your plastic consumption and recycle whenever possible.
  • Support policies and organizations working to improve water quality.
  • Share knowledge with friends and family to raise awareness.

Together, these efforts help preserve clean, safe water for future generations.

💬 If you have questions or observations about water pollution, you may share them in the comments section below.

All illustrative conceptual graphic used for educational explanation — not a real photograph.