
Disclaimer (Educational Use Only):
This article provides general environmental information for students, educators, and the public. It does not replace official regulatory guidance. For compliance matters, always refer to the latest CPCB/State PCB notifications.
Introduction: What Causes Thermal Pollution?
Thermal pollution occurs when rivers, lakes, estuaries, or coastal waters become warmer than their natural baseline temperature due to either human activities or natural processes. Even small temperature increases can significantly alter the natural thermal conditions of water bodies.
According to the U.S. Environmental Protection Agency (EPA), thermal pollution is a leading stressor in urban rivers and industrial corridors (EPA, 2024).
Note: This article focuses specifically on the causes of thermal pollution.
For a complete explanation of impacts, solutions, and global context, read our main guide on What Is Thermal Pollution.
Table of Contents
Global Hotspots of Thermal Pollution

Global thermal stress is most pronounced where rapid industrialization intersects with energy demand, limited river flow, and coastal development. High-resolution environmental datasets—such as those from NASA Earth Observatory (2023) and UNEP Water Temperature Monitoring (2024)—highlight warming clusters across North America, Europe, Asia, and Africa.
Why These Regions Heat Faster (Expert Explanation)
Research groups such as UNEP, EEA, and NIHWS identify five common drivers:
1. Dense industrial + energy corridors
Examples: Rhine River (EU), Tennessee Valley (USA). Industries withdraw water for cooling and discharge it back several degrees warmer.
2. Coal and nuclear dependence
China’s Yangtze basin and India’s Ganga basin host dozens of thermal plants that create long-term warming plumes.
3. Urban heat reinforcement
In Japan and Australia, stormwater running off superheated pavements elevates river temperatures after rainfall.
4. Desalination clusters
Mediterranean coasts increasingly rely on desalination, which produces high-temperature brine outfalls.
5. Drought-prone or low-flow rivers
Low-flow systems (Vaal, Paraná, Niger Delta) retain heat longer, intensifying thermal spikes during dry months.
Global Hotspots Summary Table (Thermal Stress Patterns)
| Region | Key Water Bodies | Primary Thermal Drivers | Typical Temperature Increase | Observed Thermal Patterns |
|---|---|---|---|---|
| USA (Tennessee Valley) | TVA Rivers | Coal & nuclear cooling discharge | +3–8°C | Persistent localized warming near discharge points |
| USA–Canada | Great Lakes System | Industrial cooling + climate warming | Basin-specific | Seasonal and basin-wide temperature elevation |
| Europe (Rhine Basin) | Rhine River | Industrial corridor discharges | +2–5°C | Continuous thermal plumes in industrial stretches |
| Mediterranean | Coastal zones | Desalination brine + thermal outfalls | Local spikes | Nearshore temperature anomalies |
| China | Yangtze & Yellow Rivers | Coal power clusters | +4–9°C | Long-distance warm-water plumes |
| Japan | Coastal urban zones | Industrial effluent + power plants | Local warming | Repeated short-duration heating events |
| Australia | Urban rivers | Stormwater runoff + climate warming | Seasonal | Heat accumulation during dry periods |
| Brazil | Paraná River | Industrial & energy discharge | Persistent | Elevated baseline temperatures |
| South Africa | Vaal River | Coal-based power generation | Long-term | Chronic thermal elevation |
| Nigeria | Niger Delta | Oil & gas heated effluent | Chronic | Sustained warming near outfalls |
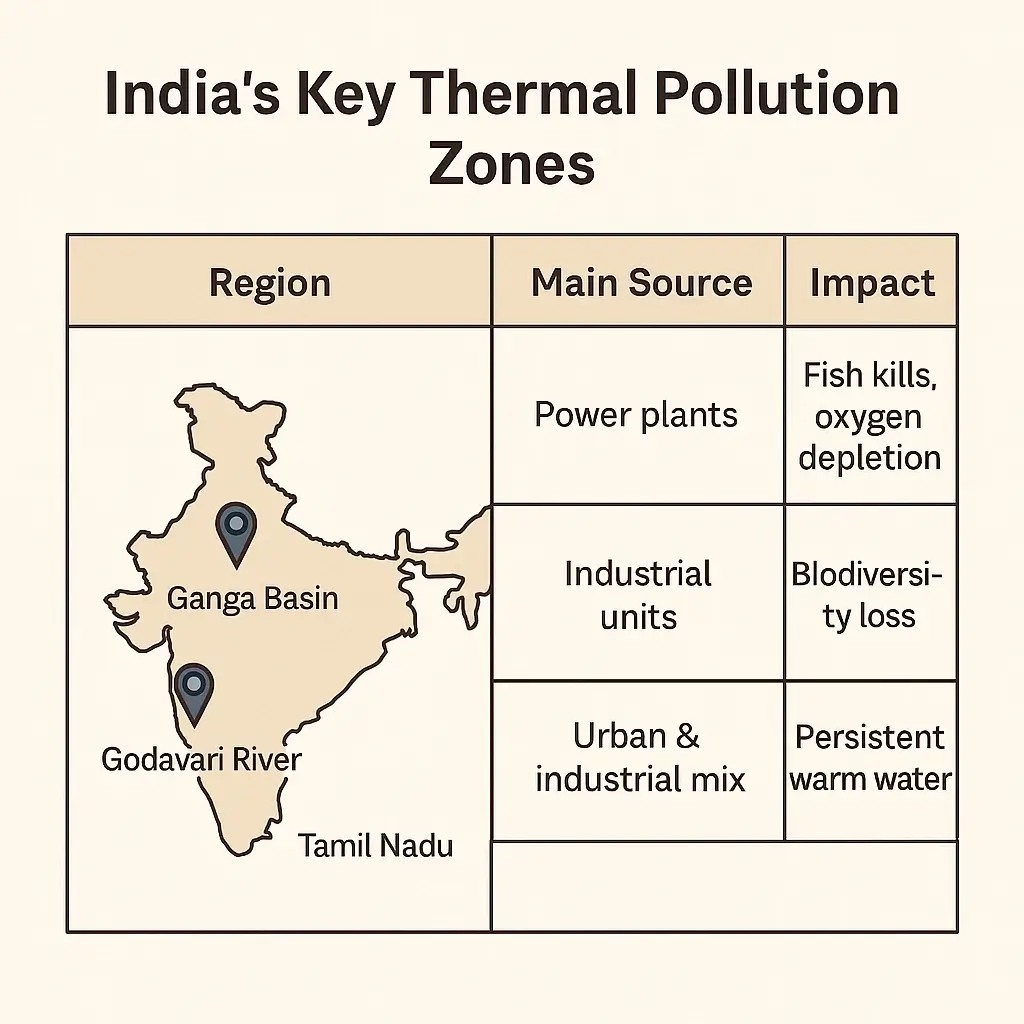
How India Compares to Global Hotspots
India shares thermal stress patterns with several global regions, based on CPCB monitoring, NEERI studies, and Ministry of Environment reports (2020–2024).
1. Dense thermal power corridors (similar to China)
The Ganga basin, Andhra coast, and Tamil Nadu power belt host multiple plants whose warm-water discharge elevates downstream temperatures during peak demand.
2. High coal dependency (similar to South Africa)
India relies heavily on coal-fired power generation, which contributes long-term temperature rise in rivers.
3. Industrial belts along major rivers (similar to Brazil)
The Hooghly, Godavari, and Damodar industrial clusters show consistent warm-water plumes near outfalls.
4. Unique Indian pattern: Monsoon-driven variability
During pre-monsoon low-flow months, the same volume of discharge produces greater warming.
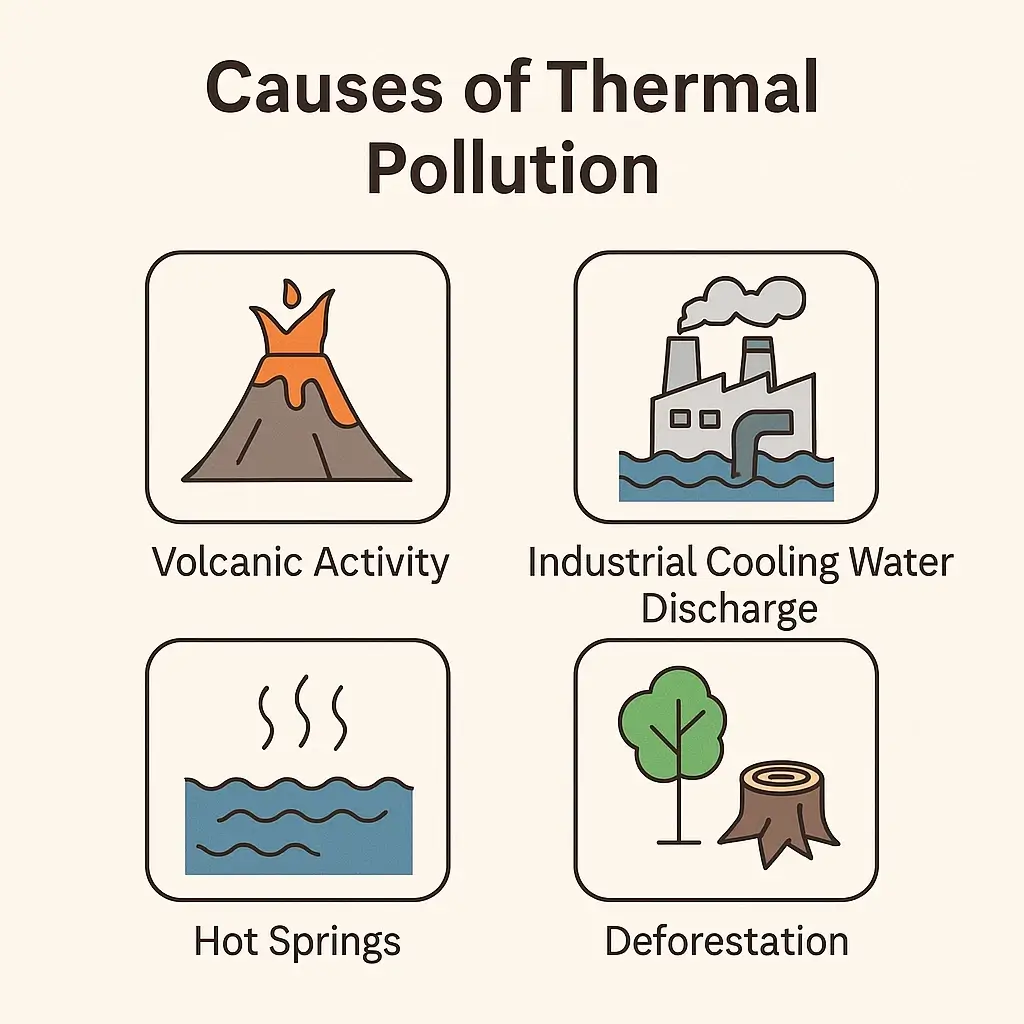
Natural Causes of Thermal Pollution
Although most thermal pollution comes from people, natural processes can also raise water temperatures and alter local thermal conditions. These effects are usually localized or temporary, but they show how sensitive aquatic systems are to temperature shifts.
Volcanic Activity
Lava flows, geothermal vents, and eruptions can raise water temperatures dramatically in nearby rivers or lakes.
Example: In Indonesia, volcanic eruptions have temporarily heated nearby rivers and lakes.
Hot Springs and Geothermal Inputs
Some streams and lakes naturally receive warm water from underground sources, creating “thermal micro-zones” with unique organisms.
Example: Yellowstone National Park has geothermal inputs that naturally warm connected streams.
Flooding and Erosion
Intense rainfall or flooding can erode riverbanks and reduce depth, leaving shallow stretches that warm more quickly under sunlight.
Climate Change and Drought
Rising air temperatures and reduced flows during droughts can sustain warmer baseline conditions in rivers and lakes.
Example: Prolonged droughts in Australia’s Murray-Darling Basin have resulted in sustained elevated water temperatures during low-flow periods.
👉 Key Point: Natural warming events usually affect only small stretches of water for short periods, but ecosystems become far more vulnerable when these natural stresses overlap with human-driven heating.
To understand how these warming factors impact ecosystems, read our full guide on the harmful effects of thermal pollution.

Human Causes of Thermal Pollution
Unlike natural events, human activities create large-scale, long-term warming of rivers, lakes, and coasts. The main drivers include:
Industrial Cooling Discharge
Factories and power plants use water for cooling, then release it back at higher temperatures.
Example: Studies along the Godavari River show that water near industrial discharge points can become significantly warmer, especially during peak power-generation periods.
Nuclear Power Plants
Reactor cooling releases very warm water, adding stress to nearby aquatic habitats.
Urban Runoff
Rainwater flowing over heated pavements and rooftops carries excess heat into rivers, especially in dense urban areas.
Deforestation Along Waterways
Removing riverside trees eliminates shade and accelerates solar heating, making streams shallower and hotter during dry periods.
Construction and Mining
Land clearing and excavation speed up erosion, reducing river depth and allowing water to heat faster.
Accidental or Unregulated Discharges
Equipment failures or poor regulation can lead to sudden releases of overheated water into ecosystems.
👉 Key Point: Human-driven thermal pollution is typically chronic and widespread, especially in regions with dense industrial activity and limited seasonal river flow.
Human-driven thermal inputs tend to persist over long periods, especially in regions with dense industrial activity and limited seasonal river flow.
These temperature changes can lead to a range of ecological effects of thermal pollution in rivers and lakes.
Global Regulatory Approaches (Brief Overview)
• Many countries regulate thermal discharge by limiting temperature increases above ambient water levels.
• Environmental agencies such as the CPCB (India) and EPA (USA) require monitoring and reporting of thermal effluents.
• Regulations primarily aim to prevent excessive warming near industrial and power-plant discharge points.
Conclusion: Key Takeaways on the Causes of Thermal Pollution
Thermal pollution is a growing threat to aquatic ecosystems worldwide. While natural events like hot springs or volcanic activity can warm water locally, human activities—power generation, industrial cooling, urban runoff, and deforestation—are the primary drivers of rising water temperatures.
Understanding these causes is the foundation for addressing thermal pollution. Identifying how and where heat enters water bodies helps inform future mitigation and policy decisions.
Download our free Thermal Pollution Handout PDF with an infographic, summary & mini-quiz
Key takeaway: Thermal pollution is preventable. Identifying the causes of thermal pollution helps inform future environmental planning and water management decisions.
Frequently Asked Questions (FAQs)
Q1: What exactly is thermal pollution?
It’s an abnormal rise in water temperature caused by human or natural factors.
Q2: What are the major human causes in India?
Power plant discharge, industrial cooling, urban heat runoff, loss of riverside forests, and construction-driven shallowing of rivers.
Q3: Can natural events also cause warming?
Yes—volcanoes, hot springs, heatwaves, and shallow-water heating during droughts can raise temperatures temporarily.
Q4: Why is increased water temperature a concern?
Because higher temperatures change the natural physical conditions of water bodies, which can lead to downstream ecological consequences.
(Learn more about the ecological effects of thermal pollution.)
Q5: Why do industries contribute significantly to thermal pollution?
Many industrial and power-generation processes rely on large volumes of water for cooling, which is often discharged back into water bodies at elevated temperatures.
(For mitigation strategies, see solutions to thermal pollution.)
Q6: Are there Indian regulations for thermal discharge?
Yes. CPCB and State PCBs set temperature limits under the Environment Protection Act, 1986, and most large plants are required to use cooling towers.
About the Author
I’m Soumen Chakraborty, the founder and lead researcher at GreenGlobe25. I specialize in translating complex data on pollution, climate risks, and sustainability into clear, actionable guides for Indian households and communities.
My work is based on a rigorous analysis of authoritative sources like the CPCB and WHO, following our publicly-available Fact-Checking Policy to ensure every piece of content is accurate and trustworthy.
LinkedIn: chakrabortty-soumen
Facebook: Ecoplanet
Last update on December 2025.
References
- U.S. Environmental Protection Agency (EPA). (2024). Thermal Pollution Overview.
https://www.epa.gov - NASA Earth Observatory (2023). Global Surface Water Temperature Dataset.
https://earthobservatory.nasa.gov/ - United Nations Environment Programme (UNEP). (2024). Water Temperature Monitoring & Aquatic Ecosystem Impacts.
https://www.unep.org/resources - National Environmental Engineering Research Institute (NEERI). (2019–2023). Thermal Discharge Impact Assessment in the Ganga Basin.
https://www.neeri.res.in/
(Navigate to Research → Water & Wastewater → Thermal Discharge Studies) - Central Pollution Control Board (CPCB). (2024). Thermal Discharge Norms & Compliance Guidelines.
https://cpcb.nic.in/ - European Union. Water Framework Directive – Annex V (2024). Environmental Quality Standards.
https://environment.ec.europa.eu/topics/water/water-framework-directive_en
- Groundwater Pollution in India (2025): Nitrate, Fluoride & Arsenic Contamination Explained - December 1, 2025
- How Air Purifiers Work: Real Science, Real Effectiveness & India-Focused 2025 Guide - November 20, 2025
- Indoor Air Pollution in India (2025 Guide): Hidden Sources & Health Risks - November 16, 2025