Have you ever stepped outside on a hazy morning and wondered why the air feels heavy or looks smoky? This isn’t just fog—it’s often smog, a dangerous form of air pollution that affects millions of people every day. At the same time, invisible chemicals called CFCs (chlorofluorocarbons) are quietly damaging our planet’s protective ozone layer, letting in harmful ultraviolet rays.
Which type of pollution includes CFCs and smog? The answer is air pollution, one of the most serious environmental threats we face today. From cities in India to towns around the world, air pollution is linked to health problems, climate change, and ecosystem damage.
In this guide, you’ll discover:
What CFCs and smog are
Why they matter to your health and the environment
How governments and communities are fighting back
Simple steps you can take to help reduce air pollution
Whether you’re a student, an eco-conscious beginner, or a sustainability professional, this article will give you clear, practical insights to make informed choices and inspire change.
Disclaimer: This article provides general environmental and health information for educational purposes only. It is not a substitute for medical or professional advice. For personal health concerns, please consult a qualified professional.
Table of Contents
Understanding Pollution Types
Long before modern industries, pollution quietly shaped our environment and health. For decades, human activities have been releasing harmful substances into the environment. But before we dive deeper into CFCs and smog, it helps to understand what pollution really means and how it’s classified.
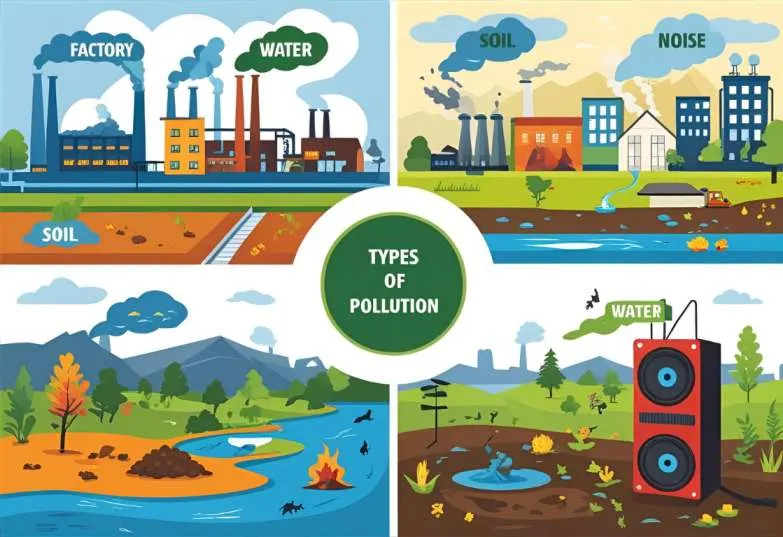
The four main types of pollution: air, water, soil, and noise.
What Is Pollution?
Think of pollution as any unwanted guest—chemicals, particles, or noise—that disrupts nature’s balance and harms living beings. These troublemakers—pollutants—might be natural (like volcanic ash) or the byproducts of our lifestyles (like factory smoke and plastics). For example:
Natural pollutants: Volcanic ash, pollen, dust
Man-made pollutants: Smoke from factories, chemical waste, plastics
When pollutants build up beyond safe levels, they damage air, water, and soil, creating serious risks for people and wildlife.
Major Categories of Pollution
Pollution comes in many forms. Here are the four main types you should know:
Air Pollution
Definition: Contamination of the air by harmful gases, particles, or biological molecules. Learn more in our full guide on Air Pollution.
Examples: CFCs from old refrigerators, smog in big cities, vehicle exhaust.
Why it matters: It causes breathing problems, contributes to climate change, and destroys the ozone layer.
Water Pollution
Definition: When harmful substances mix with rivers, lakes, or oceans.
Examples: Industrial waste, sewage, oil spills.
Why it matters: Polluted water affects drinking supplies and aquatic life.
Soil Pollution
Definition: The presence of toxic chemicals in the soil.
Examples: Pesticides, heavy metals from factories.
Why it matters: Contaminated soil reduces crop yield and harms animals.
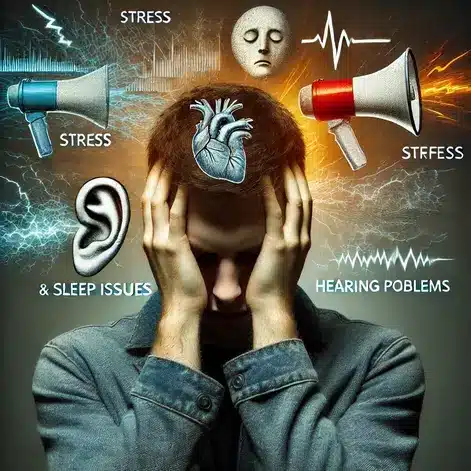
Noise Pollution
Definition: Excessive or disturbing noise that disrupts normal life.
Examples: Traffic noise, loud machinery.
Why it matters: Long-term exposure can lead to stress and hearing loss.
So, which type of pollution includes CFCs and smog? You guessed it—air pollution. In the next section, you’ll learn exactly how these pollutants form and why they are so dangerous.
Air Pollution—The Culprit Behind CFCs and Smog
Air pollution is the main reason why CFCs and smog have become such serious threats to our health and the environment. But what exactly are these substances, and how do they get into the air? Let’s break it down.
What Are CFCs (Chlorofluorocarbons)?
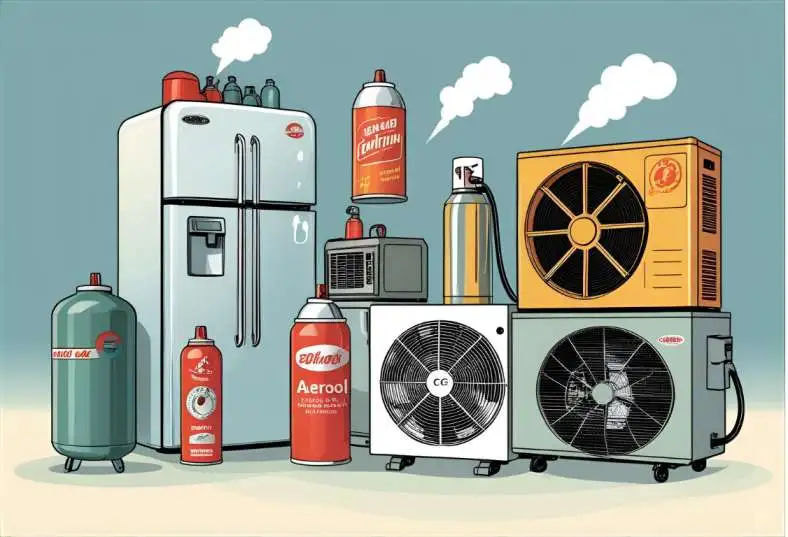
CFCs, or chlorofluorocarbons, are man-made chemicals that were once widely used in:
Refrigerators and air conditioners
Aerosol spray cans
Foam packaging materials
They became popular because they are non-flammable, stable, and inexpensive to produce. However, this same stability allows CFCs to remain in the atmosphere for decades after they are released.
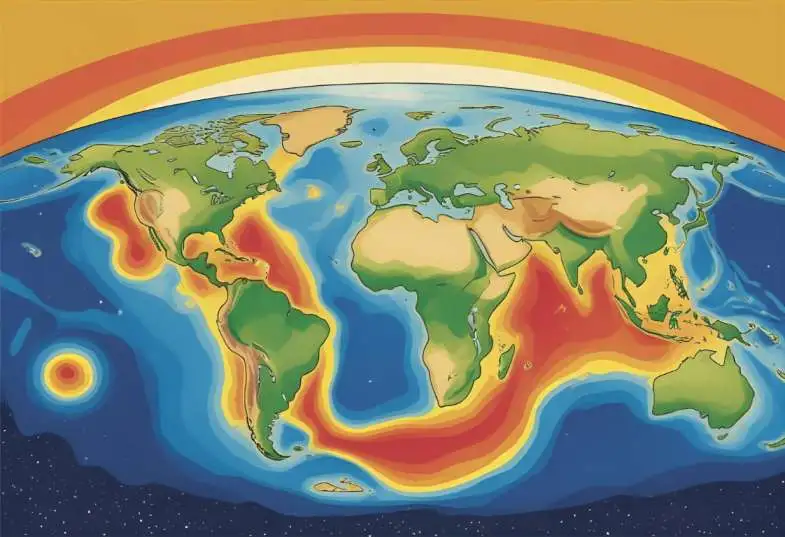
Once emitted, CFCs slowly rise into the upper atmosphere. There, ultraviolet (UV) radiation breaks the molecules apart, releasing chlorine atoms. These chlorine atoms react with ozone (O₃) and destroy it, reducing the amount of protective ozone in the stratosphere.
CFCs break down ozone through a catalytic chain reaction, meaning a single chlorine atom can destroy thousands of ozone molecules before it becomes inactive (UNEP Montreal Protocol, 1987). This makes CFCs especially damaging even at low concentrations.
Why is this a serious problem?
The ozone layer shields Earth from harmful UV radiation that can increase the risk of skin cancer, cataracts, and weakened immune function.
Higher UV exposure can also damage crops, marine ecosystems, and phytoplankton—the foundation of ocean food chains.
Recognizing the global threat, countries around the world signed the Montreal Protocol in 1987 to phase out CFC production and use. Thanks to this agreement, the ozone layer is gradually recovering, although complete restoration will take several more decades.
Common products that once used CFCs and contributed to ozone depletion.
What Is Smog?
Smog is a type of air pollution that looks like a thick, dirty haze hanging over cities. The word comes from combining smoke + fog. There are two main types:
Industrial Smog
Common in older industrial cities.
When burning coal releases sulfur dioxide, which mixes with fog.
Example: London’s “Great Smog” in 1952 killed thousands.
Photochemical Smog
Common in modern urban areas with lots of vehicles.
When sunlight reacts with nitrogen oxides and volatile organic compounds (VOCs) from car exhaust.
Produces ground-level ozone, a major health hazard.
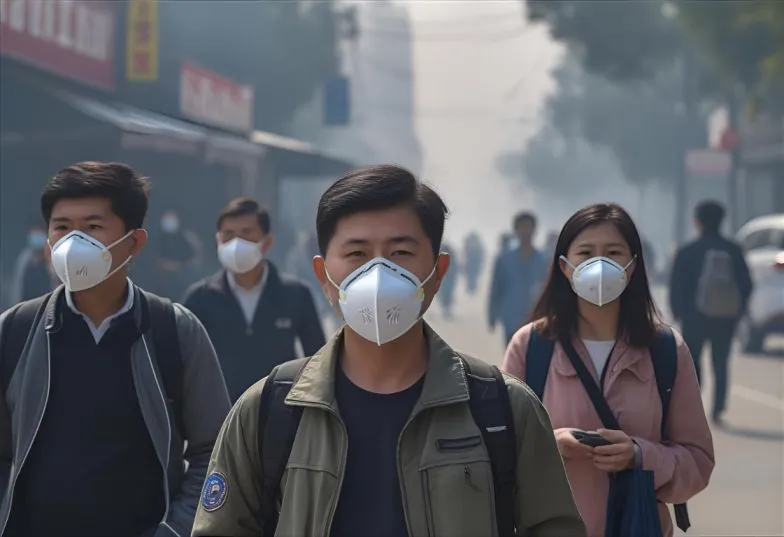
In India, cities like Delhi, Mumbai, and Kolkata struggle with severe smog, especially in winter. In Delhi, PM2.5 levels in winter often exceed 250 µg/m³—far above the WHO guideline of 15 µg/m³ (WHO, 2021).
In simple words:
CFCs destroy the ozone layer far above us.
Smog creates toxic air right where we breathe.
Both are part of air pollution, and both have long-lasting effects if we don’t act.
The ozone hole caused by CFCs allows harmful UV rays to penetrate the atmosphere.
How CFCs and Smog Affect Us
You might not see CFCs floating in the air or notice smog on some days, but both have serious impacts on human health and the environment. Let’s look at why these pollutants are so harmful.
Impacts on Human Health
Smog and ground-level ozone are especially dangerous because we breathe them directly. Here are some of the ways smog affects our health:
Breathing problems: Smog can irritate your nose, throat, and lungs. People with asthma often have more attacks when the air quality is poor.
Chronic illnesses: Long-term exposure to PM2.5 and ozone is linked to chronic respiratory diseases and reduced lung function. The WHO Global Air Quality Guidelines (2021) also indicate increased risks of cardiopulmonary disease with sustained exposure (WHO, 2021).
Eye irritation: Smog makes your eyes sting and water, causing discomfort in daily life.
Heart issues: Research shows that polluted air can raise the risk of heart attacks and strokes.
CFCs, on the other hand, harm us more indirectly by damaging the ozone layer. When the ozone layer gets thinner, more UV rays reach Earth. This can lead to:
Skin cancer: Higher UV exposure increases the risk of skin cancers, especially in fair-skinned people.
Eye damage: UV radiation may increase the risk of cataracts, according to WHO assessments (WHO, 2021). clouding the eye’s lens.
Weakened immunity: Too much UV light can suppress the immune system, making it harder to fight infections.
Even if you feel healthy, living in areas with heavy smog or high UV levels increases your long-term risks.
Smog affects daily life and increases respiratory health problems.
Impacts on the Environment
Air pollution isn’t only a threat to people—it silently erodes the health of our entire planet. Here are a few examples:
Climate change: Some air pollutants, like CFCs, are powerful greenhouse gases that trap heat and contribute to global warming.
Harm to plants: Ground-level ozone damages crops, reducing food production.
Wildlife: Extra UV radiation harms small organisms in oceans, disrupting the food chain.
Material decay: Smog and acid rain can eat away at buildings, monuments, and infrastructure.
India and many other countries face these problems every day. From shrinking harvests to hotter summers, the effects of air pollution are all around us.
Recognizing these consequences is what empowers us to change course. Next, let’s explore what’s being done to fight CFCs and smog—and how you can help.
Solutions and What You Can Do
Air pollution might feel like an overwhelming problem, but there is good news: we already have proven solutions. From international agreements to small daily habits, everyone has a role to play in reducing CFCs and smog.
Global Efforts to Reduce Air Pollution
Governments and organizations worldwide have taken big steps to fight air pollution:
The Montreal Protocol: Signed in 1987, this historic treaty phased out the production and use of CFCs. Thanks to this agreement, the ozone layer is slowly healing.
Clean Air Acts: Many countries, including India, have laws limiting harmful emissions from industries and vehicles.
Emission Standards: Stricter rules for car exhaust and industrial chimneys have helped reduce smog in some cities.
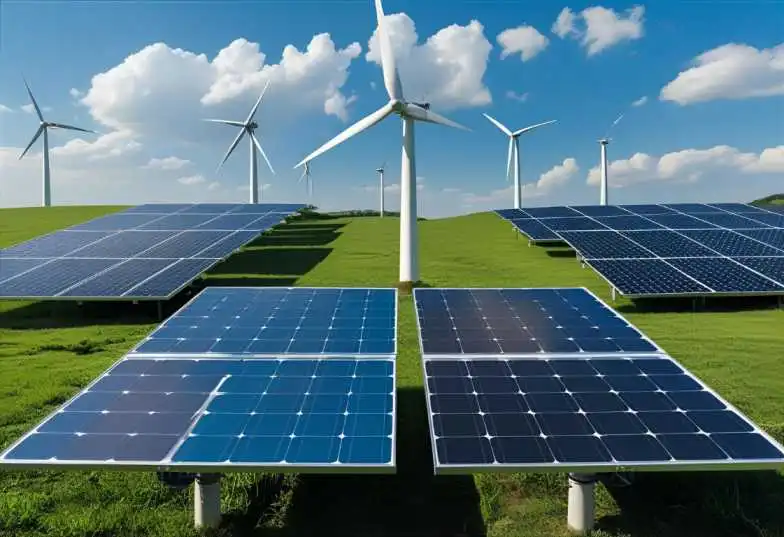
Renewable Energy: Moving away from coal and diesel to solar, wind, and hydro power cuts pollution at the source.
India’s National Clean Air Programme (NCAP) aims to reduce PM2.5 and PM10 levels by 20–30% by strengthening monitoring networks, promoting cleaner fuels, and reducing industrial emissions.
These efforts show that when communities work together, real progress is possible.
How You Can Help
While strong environmental policies make a major difference, individual choices also play an important role. Below are practical steps you can take to help reduce CFC emissions and smog in your community.
1. Reduce the Use of CFC-Containing Appliances
• Check the manufacturing year of your refrigerator or air conditioner. Units made before 1995 may contain CFCs. • When replacing old appliances, choose models that use low-GWP (Global Warming Potential) refrigerants such as R-600a or R-134a. • For disposal, contact your municipality or a certified refrigerant-recovery technician to ensure harmful gases are safely captured.
2. Cut Down on Smog-Forming Activities
• Prefer public transport, metro services, or verified carpool apps to reduce daily emissions. • Use bicycles or walk for short-distance travel when feasible. • Limit reliance on diesel generators and ensure regular maintenance of vehicles to reduce NOx and particulate emissions. • Check your city’s daily Air Quality Index (AQI) using CPCB or SAFAR, and avoid outdoor exercise during high-pollution periods.
3. Support Cleaner Energy Choices
• Whenever possible, choose electricity plans or providers that invest in renewable sources such as solar or wind. • If eligible, explore government incentives for rooftop solar systems under local or national programs.
4. Make Informed Purchase Decisions
• Select household products labeled low-VOC to reduce indoor air pollution. • Look for eco-friendly options in paints, cleaning agents, and personal-care items. • Choose recyclable or minimal-packaging products to reduce environmental waste.
5. Raise Awareness in Your Community
• Share credible information about air pollution and health impacts with friends, family, and neighbors. • Participate in local clean-air initiatives, planting drives, or community sustainability programs. • Encourage responsible waste disposal and discourage burning of leaves or garbage.
Small, consistent actions can lead to meaningful change. By choosing cleaner technologies, adopting sustainable habits, and promoting awareness, we can collectively reduce smog, protect the ozone layer, and improve the air quality around us.
Switching to clean energy helps reduce air pollution and protect the environment.
Conclusion
Air pollution affects everyone, no matter where you live. From CFCs silently thinning the ozone layer to smog filling our cities with toxic air, these problems can feel impossible to solve. But as you’ve learned, air pollution is not just a scientific issue—it’s a human one.
By understanding which type of pollution includes CFCs and smog, you’re already one step ahead. You now know how these pollutants form, why they’re dangerous, and what can be done to stop them.
Remember, solutions start with action. Whether it’s supporting clean energy, reducing your car use, or simply spreading awareness, your choices matter. Governments, scientists, and communities have proven that when we work together, we can heal our atmosphere and protect future generations.
Let’s be part of that change. Start today by making one small adjustment to your lifestyle—and inspire others to join you. Cleaner air and a safer planet are within our reach if we act now.
Frequently Asked Questions (FAQs)
Which pollution includes CFCs?
Answer: CFCs, or chlorofluorocarbons, are part of air pollution. They rise into the upper atmosphere and damage the ozone layer, which protects us from harmful UV rays.
What type of pollution causes smog?
Answer: Smog is caused by air pollution, especially when vehicle exhaust, factory emissions, and sunlight react together to create ground-level ozone and fine particles.
Are CFCs still used today?
Answer: Most countries have banned or strictly limited CFCs since the Montreal Protocol in 1987. However, some older refrigerators and air conditioners may still contain them.
How does smog affect human health?
Answer: Smog exposure may cause breathing discomfort, eye irritation, coughing, and has been linked in studies to cardiovascular stress, especially among sensitive groups. Long-term exposure increases the risk of lung disease and other health problems.
What’s the difference between smog and fog?
Answer: Fog is just water vapor in the air and is usually harmless. Smog is dirty air pollution mixed with fog or haze, which makes it harmful to breathe.
How can we reduce smog in cities?
Answer: We can reduce smog by: Using public transport or carpooling Switching to clean energy Reducing industrial emissions Planting more trees
Why is the ozone layer important?
Answer: The ozone layer protects life on Earth by blocking most harmful UV radiation from the sun. Without it, people and animals would face higher risks of skin cancer and eye damage.
How do CFCs destroy the ozone layer?
Answer: When CFCs reach the upper atmosphere, UV rays break them apart, releasing chlorine atoms. Each chlorine atom can destroy thousands of ozone molecules over time.
About the Author
I’m Soumen Chakraborty, the founder and lead researcher at GreenGlobe25. I specialize in translating complex data on pollution, climate risks, and sustainability into clear, actionable guides for Indian households and communities.
My work is based on a rigorous analysis of authoritative sources like the CPCB and WHO, following our publicly-available Fact-Checking Policy to ensure every piece of content is accurate and trustworthy. LinkedIn: chakrabortty-soumen Facebook: Ecoplanet
Last update on December 2025.
🌱 Ready to breathe cleaner air? Start by sharing this guide with your friends and family. Together, we can fight pollution and protect our planet for future generations.
References
World Health Organization (2021). WHO Global Air Quality Guidelines: Particulate Matter (PM2.5 and PM10), Ozone, Nitrogen Dioxide, Sulfur Dioxide, and Carbon Monoxide.https://www.who.int/publications/i/item/9789240034228
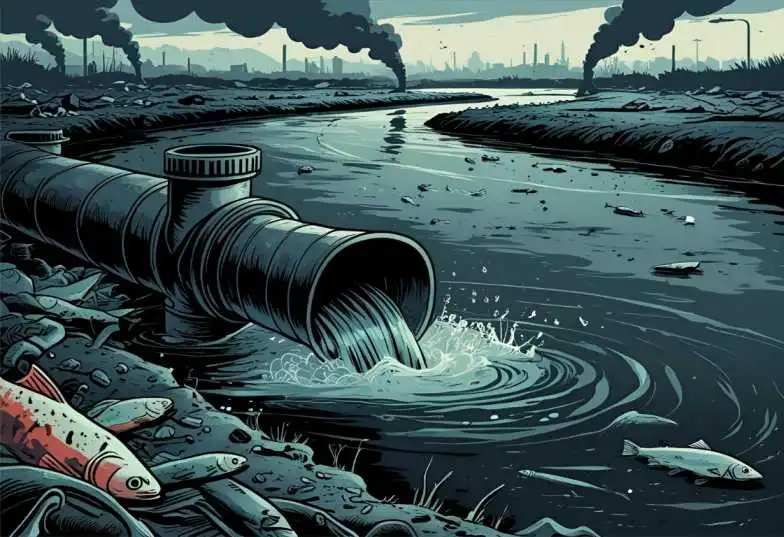
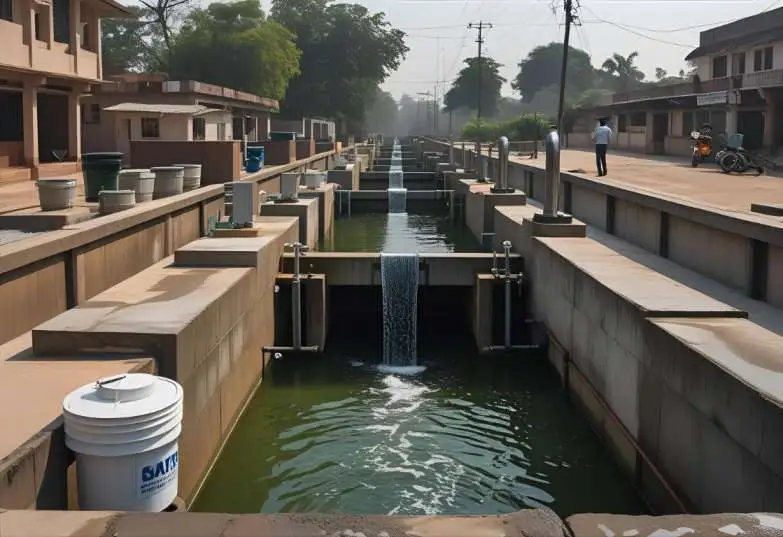
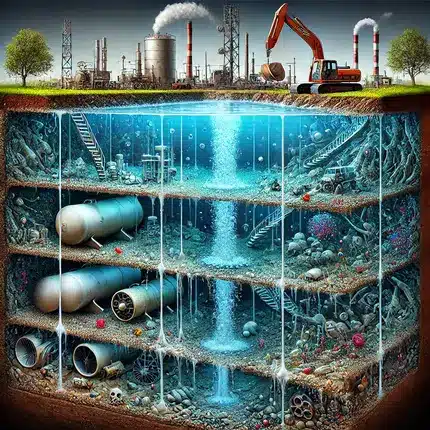
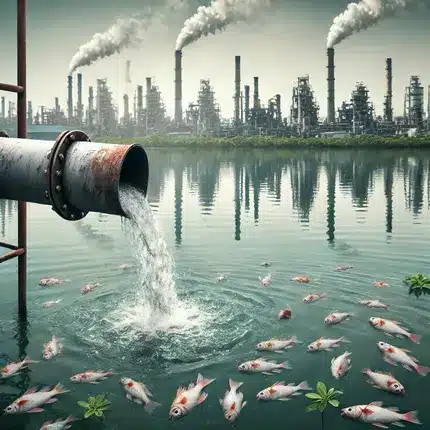
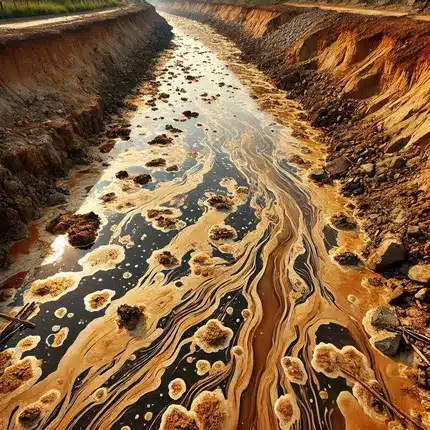
Ever wondered how a single untreated discharge pipe can significantly degrade a river’s water quality? That’s the dangerous reality of point source pollution — when harmful substances are discharged from a specific, identifiable source directly into the environment. Whether it’s untreated sewage flowing from city drains or toxic waste released by a factory, point source pollution is one of the leading causes of water and air contamination in India and around the world.
Millions in India depend on rivers for drinking water and farming. So when pollution enters through direct sources, the impact is fast and long-lasting. From the Ganga to local lakes, ecosystems are experiencing measurable stress due to sustained pollutant loads — also read 8 Types of Water Pollution in India to understand how point and non-point pollution differ. According to the Ministry of Jal Shakti, over 600 million Indians depend on rivers and groundwater for drinking, irrigation, and daily needs (NITI Aayog Composite Water Management Index, 2023).
A clear example of point source pollution affecting Indian rivers.
In this blog, you’ll learn:
What exactly is point source pollution, and how is it different from other types
Real-world examples from India and abroad
The serious health, environmental, and economic impacts
What we can do — from policies to personal action — to stop it
By the end, you’ll see why addressing point source pollution requires participation from both institutions and individuals.
3 Key Takeaways About Point Source Pollution
Traceable: Comes from a single source, like a pipe, drain, or chimney
May increase the risk of waterborne diseases and contribute to fish deaths and long-term health impacts, depending on pollutant type and exposure levels (WHO & CPCB guidelines).
Solvable: Laws like the Water Act + tech like ETPs can stop it
Scroll down to learn how to take action in your city or neighborhood.
According to CPCB’s National Water Quality Monitoring Programme (NWMP), 311 river stretches across India failed to meet water quality norms in 2022, with most violations linked to untreated sewage and industrial discharge from identifiable sources. States such as Maharashtra, Madhya Pradesh, and Assam account for a significant portion of these polluted stretches.
Point source pollution refers to pollution originating from a single, identifiable source, such as a pipe, drain, or chimney, that directly discharges pollutants into the environment.
Unlike general pollution that spreads from multiple areas, point source pollution is easy to trace, which makes it more manageable, yet still dangerous.
Simple examples of point source pollution include:
A factory pipe discharging chemicals into a river
A sewage outlet draining untreated waste into a lake
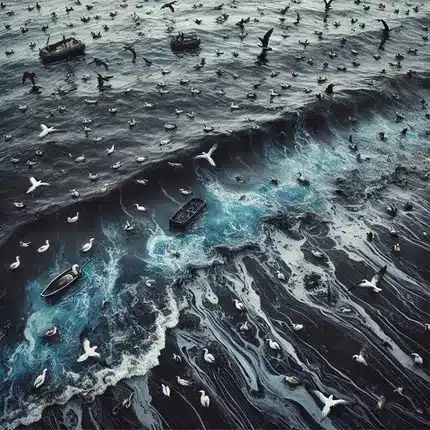
An oil spill from a leaking tanker or ship
A thermal power plant’s smokestack releases ash into the air
In India, cities like Kanpur, Varanasi, and Bengaluru have seen their rivers and lakes suffer due to untreated waste entering from direct sources.
Key point: If you can “point” to where the pollution is coming from, it’s point source pollution.
Point source outlets are continuously monitored under CPCB’s Online Continuous Effluent Monitoring System (OCEMS), which tracks parameters like pH, BOD, COD, TSS, and ammonia in real time. Over 9,000 industrial units are connected to this system across India.
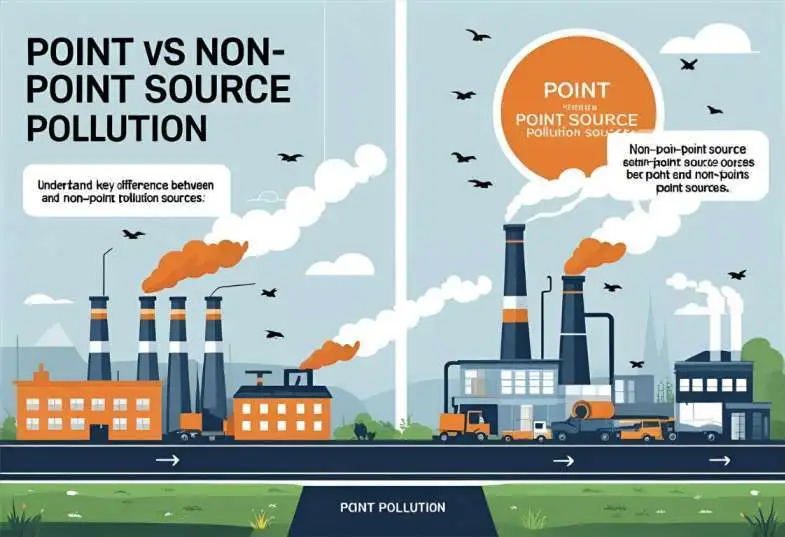
This comparison chart helps explain how point source pollution differs from non-point pollution.
Point Source vs Non-Point Source Pollution
Many people confuse point source pollution with non-point source pollution, but they are different in nature and treatment.
Here’s a simple comparison:
🔍 Feature
🏭 Point Source Pollution
🌧️ Non-Point Source Pollution
Origin
Single, identifiable source
Multiple, scattered sources
Example
Pipe from a factory
Rainwater runoff from farms or roads
Ease of Regulation
Easier to monitor and regulate
Harder to trace and control
Common in Cities Like
Mumbai (factory outlets), Delhi (drains)
Rural Punjab (fertilizer runoff), hill areas
Non-point source pollution typically occurs when rainwater picks up pollutants from roads, farms, and open lands, making it more diffuse and harder to manage.
Why this matters: Understanding the difference helps us focus our efforts. Since point source pollution is easier to detect and regulate, it should be the first line of action in cleaning up rivers, lakes, and air in India.
Major Causes of Point Source Pollution in India and Globally
Industrial Wastewater and Factory Discharges
One of the biggest contributors to point source pollution is industrial waste. Factories, especially those near rivers or lakes, often release untreated or partially treated wastewater directly into water bodies.
In India, common examples include:
Textile and tannery units in Kanpur are releasing chemicals into the Ganga
Chemical plants in Gujarat are discharging toxic effluents into local rivers
Oil refineries are leaking into marine ecosystems near coastal ports
Even though laws like the Water (Prevention and Control of Pollution) Act, 1974, exist, many units either bypass them or lack proper treatment plants.
A CPCB assessment of industrial clusters found that only 33% of Common Effluent Treatment Plants (CETPs) operate at full compliance. Non-compliance hotspots include Vapi, Ankleshwar, Kanpur (Jajmau), and Patancheru, where heavy metals such as chromium, lead, cadmium, and nickel frequently exceed permissible limits.
In Kanpur’s Jajmau tannery belt, over 400 tanneries discharge chromium-rich wastewater, making it one of the most closely monitored point-source zones under the Ganga Action Plan.
Did you know?
A 2021 CPCB compliance audit reported that nearly half of monitored industrial units located along major Indian rivers were not meeting effluent discharge standards.
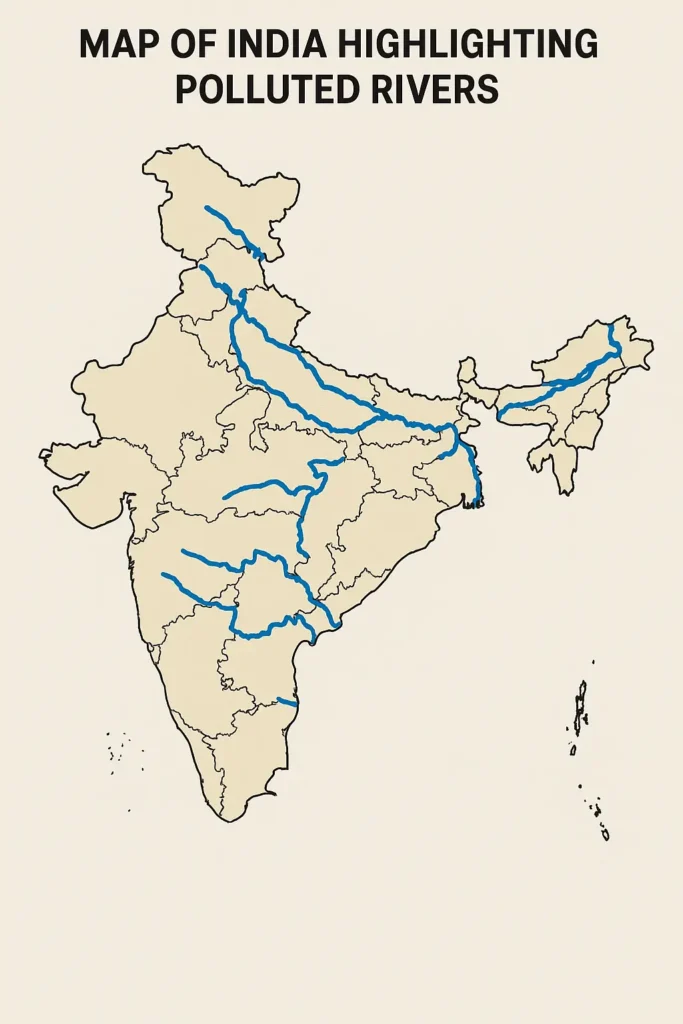
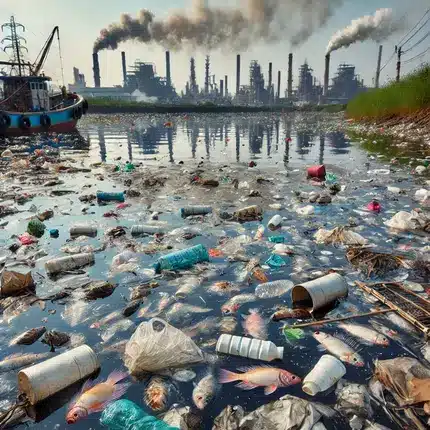
Major Indian rivers like the Ganga and Yamuna are impacted by point source pollution from industries and drains.
Sewage and Domestic Waste Outlets
Urban India is also a major source of point source pollution. In many cities, untreated or poorly treated sewage is discharged through direct pipelines into rivers and drains.
Common examples:
CPCB monitoring shows the Yamuna’s Delhi stretch consistently exceeds pollution norms, primarily due to untreated sewage discharged through 18 major drains.
Open drains in Kolkata carry black water into canals
Several investigations by the Karnataka State Pollution Control Board (KSPCB) confirm that Bellandur Lake produces toxic foam due to untreated industrial and domestic wastewater.
The problem worsens during monsoon when stormwater and sewage often mix, leading to flooding and contamination.
India generates nearly 38,000 MLD of sewage, but as of CPCB’s 2022–23 report, only 12,000 MLD of treatment capacity exists, while the actual operational capacity is about 10,000 MLD. This means less than 30% of sewage gets treated before entering rivers.
CPCB monitors 940+ drains nationwide, with Delhi’s Najafgarh drain alone contributing over 60% of the organic pollution load entering the Yamuna.
Urban Fact: India generates approximately 38,000 million litres per day (MLD) of sewage, of which only 30% is treated, according to CPCB’s 2021–22 Annual Report.
India’s Sewage Generation vs. Treatment Capacity (CPCB 2021–22)
Parameter
Value
Total sewage generated
38,000 MLD
Installed treatment capacity
~28,000 MLD
Actual operational capacity
~20,235 MLD
Untreated sewage discharged daily
~18,000 MLD
% of sewage untreated
Nearly 50%
Agricultural Discharges as Point Sources
While agriculture is mostly linked to non-point pollution, there are cases where point-source pollution occurs, especially when fertilizers, pesticides, or wastewater are discharged from specific points.
Examples include:
Irrigation tube wells that pump chemical-rich water into canals
Pesticide-contaminated runoff from greenhouse pipes
Poultry or dairy farms discharging waste into nearby streams
This form of pollution, although less talked about, is growing due to the rise of commercial farming in peri-urban areas.
Growing your food reduces urban water waste and pollution. Start small with a DIY balcony vegetable garden using natural compost.
Summary: From industrial units to city sewage and even certain agriculture practices, point source pollution stems from clear, traceable sources, making it both a threat and an opportunity for targeted solutions.
Looking to reduce your water footprint? Here’s how to start a zero-waste lifestyle in India.
Environmental and Health Impacts of Point Source Pollution
Water Pollution and Harm to Aquatic Life
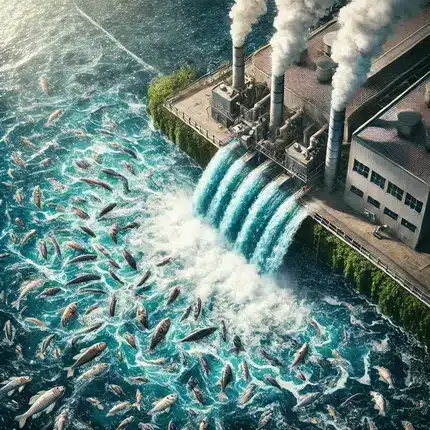
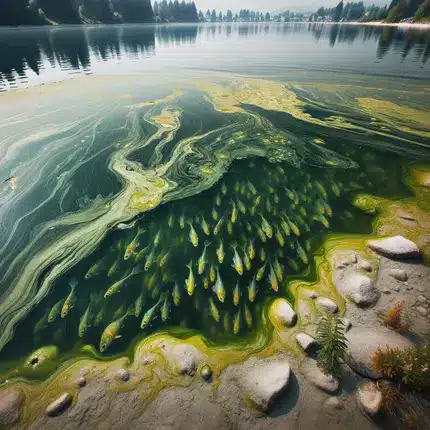
When toxic waste flows from a point source — like a factory pipe or sewage outlet — it often enters nearby rivers, lakes, or oceans. This can have a significant and measurable impact on aquatic ecosystems.
Common effects include:
Oxygen levels in water drop drastically
Fish and other species die or migrate
Algae blooms form, choking life underwater
In India:
Fish deaths are regularly reported in the Ulhas River near Mumbai due to industrial dumping
Many polluted river stretches show Biochemical Oxygen Demand (BOD) levels between 30–70 mg/L, far above the CPCB standard of 3 mg/L for outdoor bathing water. Total coliform counts often exceed 10,000 MPN/100 mL, whereas the permissible limit is 500 MPN/100 mL.
Long-term monitoring by the Ministry of Jal Shakti shows that fish populations decline sharply once dissolved oxygen (DO) falls below 3 mg/L, a common condition in heavily polluted stretches of the Yamuna, Musi, and Sabarmati rivers.
Fact: CPCB’s 2022 river assessment identified 311 polluted river stretches across India due to untreated industrial and municipal discharge.
Disclaimer: This article provides general environmental and public health information for awareness purposes. It does not replace professional medical advice, diagnosis, or treatment. For health concerns related to water contamination, please consult a qualified healthcare provider or refer to advisories issued by the Ministry of Health & Family Welfare (MoHFW) and the World Health Organization (WHO).
Human Health Hazards
When Polluted water from drains and pipes often enters our drinking supply, it becomes a potential health risk, especially for lower-income families with limited access to clean water.
Health issues caused by point source pollution:
According to WHO drinking-water guidelines, exposure to untreated or contaminated water can increase the risk of waterborne illnesses such as cholera, dysentery, and typhoid, especially in areas lacking adequate treatment systems.
Research from WHO and ICMR indicates that chronic exposure to heavy metals such as lead and mercury may contribute to kidney dysfunction and neurological effects, depending on duration and concentration of exposure.
WHO notes that children are more susceptible to developmental and health impacts from contaminated water because of their lower body weight and higher water intake relative to body size.
Example: Studies by the Central Ground Water Board (CGWB) have documented arsenic contamination in parts of Bihar and Uttar Pradesh, where long-term exposure may be associated with skin lesions and other health risks, as reported in official advisories.
WHO drinking water guidelines note that exposure to untreated water increases the likelihood of waterborne diseases such as cholera, typhoid, and dysentery. CPCB studies also show that communities relying on polluted river stretches report higher incidences of gastrointestinal illness.
CPCB assessments indicate that **over 70% of India’s surface water may not meet recommended quality standards for drinking, bathing, or agriculture.
Health risks from polluted water depend on multiple factors, including exposure level, duration, and individual health conditions. For accurate assessment, refer to official guidelines from WHO, MoHFW, and CPCB.
Economic and Social Costs
The impact of point source pollution isn’t just environmental or health-related — it also hits local economies. The NITI Aayog Water Index (2023) estimates that over 600 million Indians experience high to extreme water stress, largely due to polluted or over-extracted water sources.
Economic consequences include:
Reduced income for fisherfolk due to fish loss
Higher costs of water purification for cities
Expensive medical treatments for waterborne illnesses
Decline in tourism near polluted rivers or beaches
Case in point: Studies by the National Mission for Clean Ganga (NMCG) note that pollution affects cultural and tourism activities along several stretches of the Ganga, including Varanasi.
World Bank analyses estimate that polluted water contributes to 21% of communicable diseases in India. NITI Aayog projections show India’s water demand may reach two times the available supply by 2030, potentially impacting 6% of GDP if pollution trends continue.
Bottom line: Point source pollution doesn’t just damage the planet — it harms people, livelihoods, and the future. The effects ripple through the entire ecosystem and economy.
Solutions — How Can We Control Point Source Pollution?
Government Regulations and Monitoring
The fight against point source pollution starts with strong laws and active monitoring. In India and globally, many legal frameworks already exist, but enforcement is key.
Despite these frameworks, gaps remain. Many industrial units still operate without proper Effluent Treatment Plants (ETPs), and municipalities lack funds to upgrade sewage systems.
GIS mapping under the Namami Gange Programme now tracks drains, sewage treatment plants (STPs), and pollution hotspots across 97 towns in the Ganga basin. This allows regulators to identify major point-source discharge pathways and prioritize high-load drains for intervention.
Update: In 2024, the NGT penalized multiple industries in Haryana for direct waste discharge into the Yamuna.
Residents can use local reporting systems or civic platforms to address point source pollution in their community.
Technological Solutions and Best Practices
Technology can play a huge role in reducing point source pollution — if industries and cities adopt the right tools.
Effective solutions include:
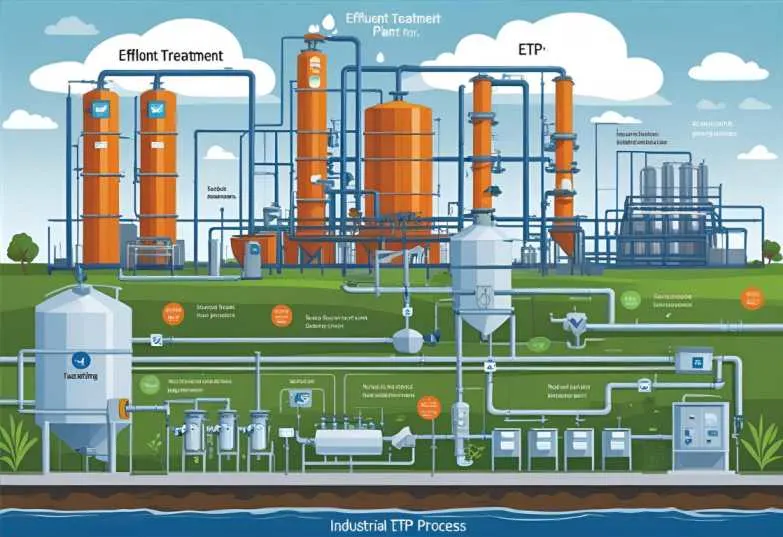
ETPs and STPs (Effluent and Sewage Treatment Plants) — to clean wastewater before releasing it
Zero Liquid Discharge (ZLD) systems — ensure no industrial water is dumped untreated
IoT and AI monitoring systems — track pollutant levels in real-time for large factories
Green building norms — encourage sustainable water and waste management at source
CPCB mandates industries in priority clusters to adopt Zero Liquid Discharge (ZLD) systems wherever feasible. Compliance is monitored through the Online Continuous Effluent Monitoring System (OCEMS), which transmits real-time data on pH, BOD, COD, TSS, and flow to regulators for immediate action.
Some cities, like Pune and Indore, are adopting decentralized wastewater systems for better local control — a model that can be replicated across urban India.
Effluent Treatment Plants (ETPs) play a critical role in controlling point source pollution from industries.
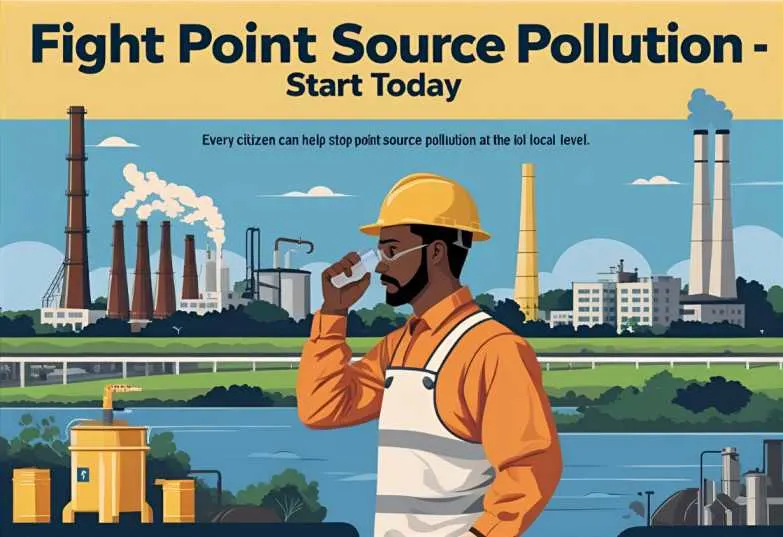
What You Can Do as an Individual
Controlling point source pollution isn’t just the government’s job. We all have a role to play — starting at home and in our communities.
Simple actions you can take:
Avoid flushing medicines, oil, or paint down the drain
Support eco-certified products and responsible brands
Report illegal waste dumping using local civic apps (e.g., Swachhata App)
Raise awareness through social media, schools, and housing societies
Participate in cleanup drives or volunteer with local environmental groups
💡 Tip: If you live near a lake or river, talk to your local RWA (Resident Welfare Association) about monitoring drains and promoting STPs in the neighborhood.
Disclosure: Some of the tools or products mentioned below may include affiliate links or third-party resources. We only recommend items or platforms that support environmental awareness and public interest. For more details, please review our Affiliate Disclosure page.
The Swachhata App, launched under the Swachh Bharat Mission, has processed over 3 crore complaints nationwide. A significant portion of these reports relate to drain overflows, sewage leaks, and solid waste mismanagement—key contributors to point source pollution in urban areas
Save these links and share them with your RWA, school, or apartment group to take real action.
Small habits at home can prevent major water pollution. For guidance on reducing household waste, see our Zero Waste Lifestyle Ideas guide.
Final thought: Though point source pollution is easier to trace, solving it still demands collective action from governments, industries, and individuals alike
Conclusion: Time to Tackle Point Source Pollution Together
Point source pollution might come from specific locations, but its impact spreads far and wide, affecting river quality, public health, and local economies. From industrial waste to untreated sewage, the sources may be clear, but the solutions need commitment from all sides.
In this blog, we explored:
What is point source pollution, and how does it differ from non-point sources
Major causes like factory discharges, city drains, and even agricultural outlets
It has harmful effects on water, health, and local livelihoods
Practical solutions — from policy and technology to individual action
The good news? Because this type of pollution is traceable, it’s easier to stop — if we act now.
You can use the Swachhata App to report local drainage or waste issues through its standard submission process.
Point source pollution refers to pollution that comes from a single, identifiable source, like a pipe, drain, or chimney. It’s easier to detect and control because you can “point” to exactly where the pollution is entering the environment.
What are 3 examples of point source pollution?
Three common examples of point source pollution are: Industrial waste discharged from factory pipes Sewage flowing from a municipal drain Oil is leaking from a tanker into the ocean These are direct sources that can be monitored and regulated.
How is point source pollution different from non-point source pollution?
The key difference is: Point source pollution comes from one specific source (e.g., a factory pipe) Non-point source pollution comes from scattered sources (e.g., rainwater runoff from fields) Point source pollution is easier to trace, while non-point source pollution is diffuse and harder to control.
What are the main causes of point source pollution in India?
In India, the top causes of point source pollution include: Industrial wastewater from chemical and textile factories Untreated sewage from urban drains Waste discharge from power plants and hospitals Many of these are released directly into rivers, such as the Ganga and Yamuna.
How does point source pollution affect human health?
Point source pollution can contaminate drinking water and increase the risk of waterborne illnesses such as cholera and dysentery, according to WHO guidelines. Long-term exposure to chemical contaminants or heavy metals may contribute to health impacts depending on concentration, duration, and individual factors. Children may be more susceptible in areas where water treatment systems are inadequate.
What are some solutions to reduce point source pollution?
Effective solutions include: Installing effluent and sewage treatment plants (ETPs and STPs) Strict enforcement of environmental laws like India’s Water Act Real-time pollution monitoring using IoT and sensors Public awareness and reporting of illegal waste dumping
Who is responsible for controlling point source pollution?
Responsibility is shared among: Governments that enforce environmental laws Industries that must treat their waste Citizens can report violations and reduce harmful habits Everyone plays a role in controlling point source pollution.
Can point source pollution be eliminated?
It can be greatly reduced, but complete elimination requires: Upgrading infrastructure Transparent monitoring Strong penalties for violations Widespread public involvement Some Indian cities have successfully reduced point source pollution with the right policies and technologies.
About the Author
I’m Soumen Chakraborty, the founder and lead researcher at GreenGlobe25. I specialize in translating complex data on pollution, climate risks, and sustainability into clear, actionable guides for Indian households and communities.
My work is based on a rigorous analysis of authoritative sources like the CPCB and WHO, following our publicly-available Fact-Checking Policy to ensure every piece of content is accurate and trustworthy. LinkedIn: chakrabortty-soumen Facebook: Ecoplanet
Last update on December 2025.
Editorial Standards
This article follows GreenGlobe25’s Editorial Policy, which includes: • Verification of facts using CPCB, WHO, and government datasets • Clear distinction between information, opinion, and guidance • Regular updates based on new environmental reports • Independent review to ensure accuracy and public benefit
References & Data Sources
• Central Pollution Control Board (CPCB), Annual Report 2021–22 • CPCB River Rejuvenation Committee Assessment Report, 2022 • Ministry of Jal Shakti – Composite Water Management Index (NITI Aayog, 2023) • World Health Organization (WHO), Guidelines for Drinking-water Quality • WHO – Children and Environmental Risks Report • Indian Council of Medical Research (ICMR) – Heavy Metal Exposure Report • Central Ground Water Board (CGWB) – Arsenic Contamination Advisory (2022) • Karnataka State Pollution Control Board (KSPCB) – Bellandur Lake Assessment • National Mission for Clean Ganga (NMCG) – Ganga Basin Status Reports
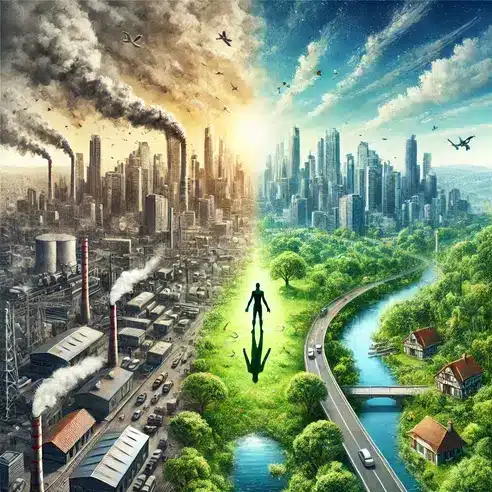
Environmental education is most effective when students can see, touch, and experience the concepts they learn. Across many classrooms in India—from Pune to Delhi—teachers are finding that students understand climate challenges far better when they participate in hands-on, measurable activities rather than reading about them alone.
In this 2025 guide, you’ll find seven classroom-tested activities that help students build real environmental awareness through drawing, exploring, measuring, and creating. Each activity has been selected based on actual school projects, feedback from teachers, and alignment with UNESCO’s Education for Sustainable Development goals and SDG 13 (Climate Action).
These activities not only build environmental knowledge but also help students develop problem-solving, teamwork, and responsibility, while giving teachers practical ways to connect climate concepts with everyday classroom behavior.
Educational Context Notice This article presents documented examples of environmental learning activities observed in Indian schools and community programs. It is intended as an informational reference for understanding environmental education approaches, not as a substitute for formal curriculum design or professional instruction.
Table of Contents
Why Environmental Education Matters for Kids
Image Disclaimer: The illustrations used in this article are educational visuals created for learning purposes. They do not represent photographs of real students or specific classrooms.
Students running with cups of water during the Water Conservation Relay activity to learn about preventing water waste.
Kids should learn about the environment early. Here’s why:
Awareness: They understand nature’s importance. Problem-solving: They think of ways to help. Good habits: They learn to recycle, save energy, and reduce waste. Responsibility: They see how their actions affect the planet.
UNICEF and UNESCO urge hands-on climate learning aligned to SDG 13; the activities below map directly to that goal. (UNICEF, 2024)
7 Hands-On Environmental Activities for Students
If you want a full step-by-step activity that helps students understand clean vs. polluted environments, see our complete Air Pollution Drawing Guide for Kids.
ACTIVITY 1 — Water Conservation Relay
Estimated Duration: Typically conducted within a single classroom session
Purpose (Contextual)
This activity is commonly used in environmental education programs to illustrate how small, repeated losses of water can accumulate into significant waste. It provides a visual and comparative way to discuss everyday water conservation challenges in schools and households.
Observed Structure
In classroom and workshop settings, this activity typically involves three designated stations representing water use and conservation outcomes. One station contains a source container filled with water, another represents a limited transfer tool, and a third symbolizes conserved or “saved” water.
Participants transfer water between stations using restricted quantities, highlighting how spillage or inefficiency reduces the final amount retained. In school workshops and classroom programs reviewed between 2023 and 2024, this comparison consistently helped students recognize how small daily water losses can accumulate into significant waste.
Simple measurement tools are often used to compare outcomes across groups, reinforcing the concept that careful use leads to better conservation results.
Reflection & Discussion Context
After the demonstration, facilitators commonly guide a reflective discussion around where water loss occurred and how similar losses happen in real-life settings. Typical discussion themes include household water use, school infrastructure leaks, and small behavioral changes that reduce waste.
Rather than focusing on performance, the emphasis remains on observation and interpretation of outcomes.
Real Classroom Insight
During a 2024 sustainability workshop in Ahmedabad, classroom facilitators noted that following similar water-transfer demonstrations, participants became more attentive to leaking taps and inefficient water use within school premises. Teachers noted increased student-led discussions around conservation during assemblies and environmental clubs. (Green Schools Initiative Report, 2024)
Observed Learning Outcomes
Based on classroom observations and educator feedback, this activity is associated with:
Greater attention to water-saving behaviors in shared spaces
Improved awareness of how minor water losses accumulate
Clearer understanding of why water conservation matters in daily life
Increased engagement in discussions about responsible resource use
Key Learning Outcome:
Students learn how small daily habits related to resource use and waste management can collectively lead to significant environmental impact.
Students running with cups of water during the Water Conservation Relay activity to learn about preventing water waste.
ACTIVITY 2 — Waste Segregation Awareness Exercise
Estimated Duration: Commonly conducted within a single learning session or workshop block
Purpose (Contextual)
This activity is frequently used in environmental education programs to illustrate how improper waste segregation increases landfill burden and recycling inefficiency. It helps participants visually understand the differences between biodegradable, recyclable, and non-recyclable waste in everyday settings.
Observed Structure
In classroom and community learning environments, this activity typically involves examining a mixed set of common household or school waste items. These items are grouped into broad categories representing organic waste, recyclables, and residual waste.
Based on school-level waste audits and classroom learning sessions reviewed across Indian schools, this sorting exercise helped students clearly identify how recyclable materials are often misplaced into general waste streams. Labeled containers, sample packaging, and everyday disposal items are commonly used to reflect real-life waste management conditions.
Rather than focusing on speed or correctness, the activity emphasizes observation of patterns—such as which materials are most frequently misclassified and why confusion occurs.
Reflection & Discussion Context
Following the exercise, facilitators often guide a discussion around how waste segregation practices vary between homes, schools, and public spaces. Conversations typically explore why segregation fails in practice, how contamination affects recycling systems, and how small improvements can reduce overall waste volume.
The discussion remains analytical, focusing on awareness rather than behavioral enforcement.
Real Classroom Insight
During school-based waste audits conducted in Bengaluru in 2023, educators observed that learners who participated in similar segregation exercises demonstrated improved recognition of recyclable materials during subsequent clean-up drives. Teachers reported fewer instances of mixed waste disposal in classrooms over the following weeks. (Urban Waste Education Program Summary, 2023)
Observed Learning Outcomes
Based on educator observations and program reports, this activity is associated with:
Improved recognition of common waste categories
Better understanding of why segregation affects recycling efficiency
Increased awareness of contamination in waste streams
More informed discussions about local waste management challenges
Key Learning Outcome:
Students learn how small daily habits related to resource use and waste management can collectively lead to significant environmental impact.
Students planting saplings and tracking growth as part of the Plant a Tree Challenge.
ACTIVITY 3 — Local Air Quality Observation Exercise
Estimated Duration: Typically integrated into a classroom session or short field-based observation period
Purpose (Contextual)
This activity is commonly referenced in environmental education programs to illustrate how air quality conditions vary across locations and time periods. It helps participants recognize visible and contextual indicators of air pollution in everyday environments.
Observed Structure
In educational and community settings, this activity usually involves observing environmental conditions in different locations, such as near roads, green spaces, or building entrances. Rather than relying on instruments, participants focus on visible indicators including dust accumulation, traffic density, vegetation health, and general atmospheric clarity.
During location-based observation exercises conducted near roads, school entrances, and green spaces, students quickly noticed how air quality conditions varied depending on traffic density and surrounding vegetation within the same neighborhood. Simple recording methods—such as note-taking, photographs, or comparison charts—are commonly used to support discussion.
The emphasis remains on observation and comparison, not measurement or data collection accuracy.
Reflection & Discussion Context
Facilitated discussions following the observation typically explore why certain areas experience higher pollution exposure than others. Common themes include vehicle density, construction activity, tree cover, and weather conditions.
Rather than drawing conclusions or prescribing actions, discussions focus on interpreting patterns and recognizing environmental variability.
Real Classroom Insight
In a 2024 urban environmental awareness program in Delhi, facilitators observed that participants who engaged in location-based air quality observation were more attentive to pollution sources around school entrances and residential streets. Teachers reported increased classroom discussions about local traffic patterns and green buffers. (Urban Air Awareness Program Report, 2024)
Observed Learning Outcomes
Based on educator feedback and program documentation, this activity is associated with:
More informed discussions about urban air quality challenges
Improved awareness of visible air pollution indicators
Better understanding of how pollution varies by location
Increased ability to compare environmental conditions
Key Learning Outcome:
Students become more aware of how environmental conditions such as air quality and noise levels vary across locations and time, strengthening observation and comparison skills.
Children collecting and sorting recyclable materials to understand waste reduction.
Estimated Duration: Commonly conducted as part of a classroom discussion or short demonstration session
Purpose (Contextual)
This activity is frequently used in environmental education settings to help learners understand how household and community waste is categorized. It emphasizes recognition and discussion rather than hands-on execution.
Observed Structure
In classroom and workshop environments, educators typically introduce waste segregation by presenting common household waste items (such as food scraps, paper, plastic packaging, and batteries) through images, charts, or sample displays.
Participants are usually asked to observe and discuss how waste is grouped into categories like biodegradable, recyclable, and hazardous. Visual aids, color-coded bin illustrations, and comparison tables are commonly referenced to support understanding.
Rather than focusing on operational steps, facilitators guide learners through examples and scenarios that demonstrate why improper mixing of waste creates environmental and management challenges.
Reflection & Discussion Context
Post-activity discussions often explore questions such as why certain waste streams require special handling and how segregation affects recycling efficiency and landfill pressure. Conversations are analytical in nature and avoid prescriptive behavioral instructions.
Educators report that learners tend to connect these discussions to waste patterns they observe at home, in schools, or in public places.
Real Classroom Insight
During a 2023 municipal outreach program in Pune, teachers observed that students exposed to waste segregation discussions were better able to identify recyclable versus non-recyclable materials in subsequent classroom assessments. The activity supported conceptual clarity rather than operational training. (Pune Municipal Environmental Outreach Summary, 2023)
Observed Learning Outcomes
Based on facilitator feedback and program documentation, this activity is associated with:
Stronger conceptual grasp of waste management systems
Improved understanding of waste categories
Greater awareness of recycling challenges
Ability to distinguish between biodegradable and non-biodegradable waste
Key Learning Outcome:
Students build conceptual clarity about environmental systems, enabling them to better understand classification, diversity, and ecosystem relationships.
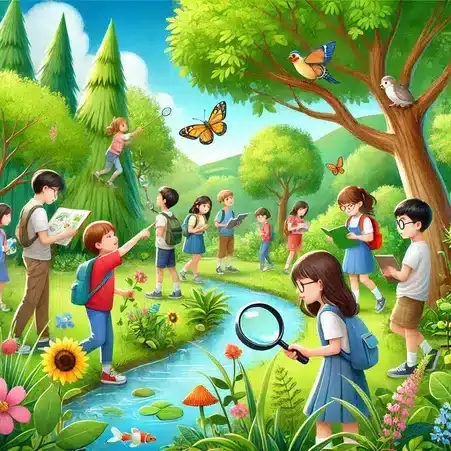
Students exploring local biodiversity and documenting species during the Nature Walk.
ACTIVITY 5 — Local Biodiversity Observation Exercise
Estimated Duration: Typically incorporated into a class period or short guided observation session
Purpose (Contextual)
This activity is commonly referenced in environmental education programs to introduce learners to the concept of local biodiversity. It focuses on recognizing different plant and animal species within familiar surroundings rather than conducting formal field studies.
Observed Structure
In classroom and community-based settings, educators usually frame this activity around observation of nearby environments such as school grounds, parks, roadside greenery, or residential areas. Participants are encouraged to note visible differences in plant types, insects, birds, or other small wildlife.
Rather than systematic surveying, the emphasis is on noticing patterns—such as areas with more vegetation supporting greater species variety. Simple visual references, checklists, or discussion prompts are often used to help structure observations without requiring data collection.
This approach allows learners to build awareness of biodiversity using everyday surroundings.
Reflection & Discussion Context
Facilitated discussions following the observation typically explore why some areas support more biodiversity than others. Topics often include tree cover, availability of water, human disturbance, and seasonal changes.
The discussion remains descriptive and exploratory, helping learners connect biodiversity concepts to real environments they encounter daily.
Real Classroom Insight
In a 2024 school-based environmental program in West Bengal, classroom feedback indicated that students who participated in local biodiversity observation activities demonstrated improved ability to identify common birds and plants during classroom discussions. The activity supported awareness without requiring specialized field equipment. (Regional School Biodiversity Program Summary, 2024)
Observed Learning Outcomes
Based on educator feedback and program summaries, this activity is associated with:
Stronger engagement in biodiversity-related discussions
Increased awareness of local plant and animal diversity
Improved observation and comparison skills
Better understanding of habitat differences
Key Learning Outcome:
Students build conceptual clarity about environmental systems, enabling them to better understand classification, diversity, and ecosystem relationships.
Poster-making and creative competitions encouraging students to express environmental ideas.
ACTIVITY 6 — Noise Environment Awareness Exercise
Estimated Duration: Typically discussed within a classroom session or short guided observation period
Purpose (Contextual)
This activity is commonly referenced in environmental education programs to help learners recognize everyday sources of noise pollution and understand how sound levels vary across locations and times of day. The focus is on awareness and interpretation, not measurement or mitigation.
Observed Structure
In classroom and community learning settings, educators usually guide learners to observe sound conditions in familiar environments such as classrooms, corridors, streets, parks, or residential areas. Participants are encouraged to identify common noise sources—traffic, construction, announcements, or crowd activity—based on perception rather than instruments.
Observation is often supported by comparison exercises, such as discussing which locations feel quieter or louder and why. Visual prompts, sound-mapping illustrations, or discussion charts are sometimes used to help structure observations without collecting numerical data.
The emphasis remains on recognizing patterns and environmental context rather than controlling or reducing noise.
Reflection & Discussion Context
Post-observation discussions typically explore how noise levels fluctuate during different times of day and how urban design, traffic flow, and land use influence sound environments. Conversations are analytical and descriptive, avoiding advice on personal behavior or health impacts.
Classroom feedback indicates that these discussions to daily experiences near roads, schools, or marketplaces.
Real Classroom Insight
During a 2023 urban environmental literacy program in Bengaluru, facilitators observed that students participating in noise awareness discussions became more attentive to sound differences between indoor and outdoor spaces. Teachers reported improved vocabulary and contextual understanding related to urban noise environments. (Urban Sound Awareness Program Summary, 2023)
Observed Learning Outcomes
Based on educator feedback and program documentation, this activity is associated with:
Increased awareness of common noise sources
Improved ability to compare sound environments
Better understanding of urban noise patterns
More informed classroom discussions about environmental noise
Key Learning Outcome:
Students become more aware of how environmental conditions such as air quality and noise levels vary across locations and time, strengthening observation and comparison skills.
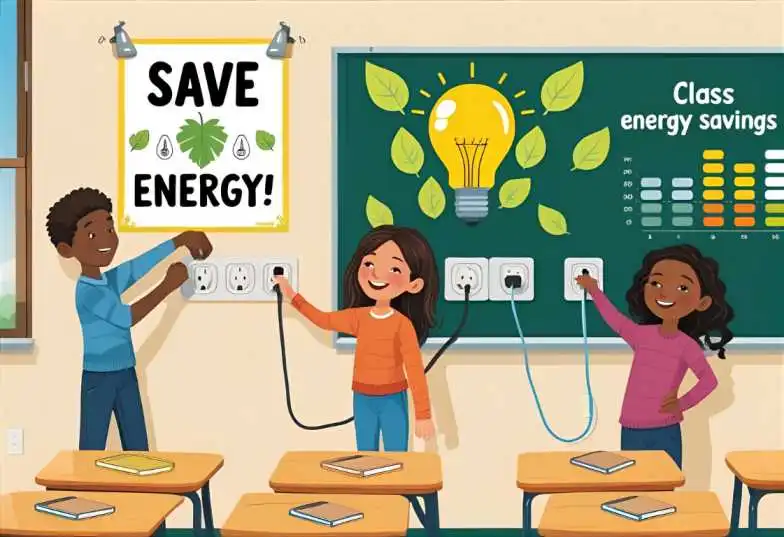
Students tracking electricity habits to reduce classroom energy use through simple routines.
ACTIVITY 7 — Community Environmental Mapping Discussion
Estimated Duration: Typically integrated into a classroom discussion or group-based review session
Purpose (Contextual)
This activity is commonly referenced in environmental education programs to help learners understand how environmental issues are distributed across neighborhoods and communities. It focuses on spatial awareness and interpretation rather than planning or intervention.
Observed Structure
In educational settings, facilitators usually introduce this activity through maps, diagrams, or visual representations of a local area. Participants observe and discuss how different environmental features—such as roads, green spaces, water bodies, industrial zones, or residential clusters—are arranged.
Rather than creating new maps or conducting surveys, learners analyze existing representations to identify patterns. Discussions often highlight how certain environmental challenges appear concentrated in specific areas due to land use, infrastructure, or population density.
The structure emphasizes interpretation and comparison, not problem-solving or community action.
Reflection & Discussion Context
Group discussions typically explore why environmental conditions differ between locations and how geography, planning decisions, and development patterns influence outcomes. Facilitators guide conversations toward understanding relationships between space and environmental impact, without proposing solutions or recommendations.
Workshop observations suggest that learners contextualize environmental issues within familiar surroundings.
Real Classroom Insight
In a 2024 civic-environment workshop conducted in Kolkata, teachers observed that students engaged in map-based environmental discussions demonstrated improved ability to explain why pollution levels and green coverage vary across neighborhoods. The activity supported spatial reasoning without requiring fieldwork. (Civic Environmental Literacy Workshop Summary, 2024)
Observed Learning Outcomes
Based on facilitator feedback and program documentation, this activity is associated with:
Stronger analytical discussion skills
Improved spatial awareness of environmental issues
Better understanding of how land use influences environmental conditions
Enhanced ability to interpret maps and visual data
Key Learning Outcome:
Students improve spatial awareness and analytical thinking by interpreting how environmental issues are distributed across different community spaces.
Hands-on science projects helping students understand renewable energy concepts.
How Teachers & Parents Can Support Kids’ Environmental Learning
The following observations summarize commonly reported support approaches and are not prescriptive recommendations.
In educational and home-learning contexts, adults commonly support environmental learning by providing age-appropriate materials, encouraging observation of natural surroundings, and modeling environmentally responsible behaviors. These approaches are descriptive examples rather than prescriptive recommendations.
These simplified definitions help students understand core environmental concepts used throughout this guide.
1. Renewable Energy
Energy that comes from natural sources that can replenish themselves, such as sunlight, wind, or flowing water.
Example for classrooms: Students can build a small solar oven or mini wind turbine to see how renewable energy works in real life.
2. Recycling
The process of converting used materials into new products instead of throwing them away.
Example: Using recycled paper for art projects or sorting plastic, paper, and glass into labeled bins during the recycling challenge.
3. Sustainability
Meeting the needs of today without harming the environment for future generations.
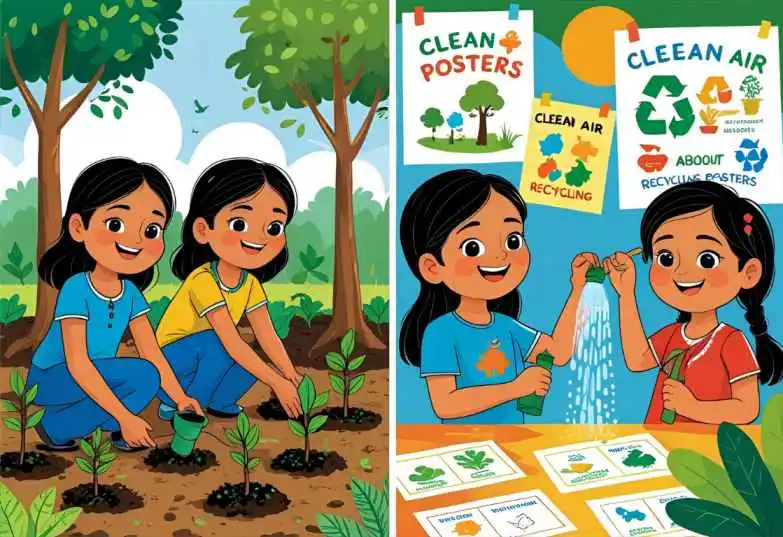
Example: Students create posters showing how to save water, reduce electricity use, and limit plastic waste at home and school.
4. Biodiversity
The variety of plants, animals, insects, and microorganisms living in an ecosystem.
Example: During the Nature Walk activity, students document at least 10 species to understand how diverse life exists even in small green spaces.
5. Carbon Footprint
The total amount of greenhouse gases (mainly CO₂) released due to human actions.
Example: Tracking energy use or reducing plastic consumption helps students lower their classroom’s carbon footprint.
Earth Day 2025 Classroom Ideas & Resources
Earth Day provides an ideal opportunity for students to turn environmental learning into visible, measurable action. Schools that integrate hands-on activities—rather than one-day celebrations—see significantly higher engagement and retention of climate concepts. In 2024–2025 workshops across Delhi, Pune, and Bengaluru, teachers reported that students were most motivated when Earth Day tasks had clear goals, simple tools, and real results they could see immediately.
Below are classroom-tested, teacher-approved Earth Day activities you can run within a single school day or spread across an entire week.
1. “Plastic-Free Day” Classroom Challenge
Purpose Highlights how everyday choices influence plastic waste generation.
Common classroom format In classroom and community-learning settings, this activity is typically observed as a short, time-bound awareness exercise coordinated by educators. Participants reflect on their daily consumption patterns and note instances where single-use plastic is avoided. Visual summaries or group discussions are often used to compare observations and encourage shared learning.
Educators report that focusing on observation and comparison—rather than enforcement—helps students connect individual behavior with broader plastic pollution issues.
Why it works Students gain visible, real-world context for how small decisions contribute to measurable waste reduction, reinforcing personal responsibility without prescriptive instruction.
Illustration: Plastic-free awareness poster highlighting wildlife and natural ecosystems.
2. Earth Day Eco-Quiz Show
Purpose Reinforces environmental knowledge through recall and discussion.
Common classroom format This activity is commonly structured as a facilitated group interaction where environmental questions are discussed in a game-like format. Learners participate collectively, responding to prompts and exchanging viewpoints under educator moderation.
Feedback from classrooms suggests that presenting information through interactive questioning improves engagement and retention, especially when discussion follows each response.
Why it works Gamified learning environments are associated with higher attention levels and improved memory recall, particularly for factual environmental concepts.
3. Art From Waste Exhibition
Purpose Explores reuse, creativity, and material life cycles.
Common classroom format In educational settings, this activity is typically observed as a creative showcase where students work with discarded, safe materials to express environmental themes. Finished pieces are often displayed within school spaces, allowing peer viewing and informal discussion.
Educators note that presenting outcomes visually encourages reflection on consumption habits and material reuse without focusing on production steps.
Why it works Students directly engage with the concept of reuse, developing an intuitive understanding of waste reduction and resource value through creative expression.
4. Classroom Carbon Footprint Tracker
Purpose Introduces basic concepts of resource use and emissions awareness.
Common classroom format This activity is generally implemented as a shared visual reference that tracks observable classroom behaviors related to energy and resource use over a defined period. Students contribute observations, which are collectively reviewed during group discussions.
Teachers report that emphasizing trends and patterns—rather than targets—helps learners understand how daily habits influence environmental impact.
Why it works Making abstract concepts like emissions visible and cumulative supports clearer understanding and long-term awareness.
5. Earth Day Reflection Circle
Community members discussing Earth Day and sharing ideas for environmental action in a natural outdoor setting.
Purpose Encourages reflection, listening, and community awareness.
Common classroom format In classroom or outdoor learning environments, this activity is commonly observed as a moderated group discussion where participants share reflections on environmental themes. Conversations are guided by open prompts, with emphasis on respectful listening and inclusive participation.
Facilitators note that reflection-based dialogue helps students articulate personal connections to environmental issues without pressure to propose solutions.
Why it works Structured reflection supports critical thinking and emotional engagement, helping learners internalize environmental values.
Supplementary Reference Materials (Optional)
Download the updated 2025 Earth Day Activity Pack, including:
Q1: Why are environmental activities important for students?
Hands-on environmental activities help children understand ecosystems, pollution, and climate change through direct experience. These activities strengthen problem-solving skills, teamwork, curiosity, and long-term responsibility. Programs like UNICEF Climate Action for Kids show that experiential learning deepens environmental awareness more effectively than lectures alone.
Q2: What simple environmental activities can students try?
Beginner-friendly ideas include:
Water Conservation Relay
Tree planting
Nature walks
Recycling challenges
Energy-saving tasks
Eco-friendly competitions
Waste-to-art projects
Teachers can easily adapt these for different grade levels and classroom sizes.
Q3: How do environmental activities support science learning?
Students learn scientific concepts by applying them:
Renewable energy → building a solar oven
Biodiversity → documenting species on a nature walk
Pollution → tracking waste or electricity use
These activities help students observe cause–effect relationships and strengthen critical thinking. NASA Climate Kids provides age-appropriate resources for these topics.
Q4: How can teachers make environmental learning exciting and relevant?
Use interactive methods like games, competitions, green clubs, and outdoor tasks. Teachers in India found that classroom charts, journals, and measurable goals (kg of waste recycled, kWh saved, number of species recorded) improve student motivation.
Q5: How can parents support environmental learning at home?
Parents can reinforce habits by:
Encouraging kids to switch off lights
Using reusable items
Recycling regularly
Watching nature documentaries
Tracking daily eco-habits on a simple chart
When parents model the same behaviors, children adopt them more quickly.
Q6: How do these activities align with SDG 13 (Climate Action)?
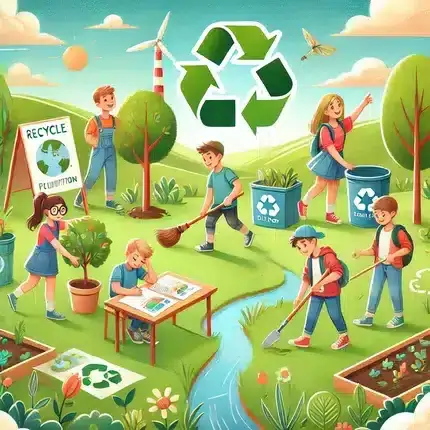
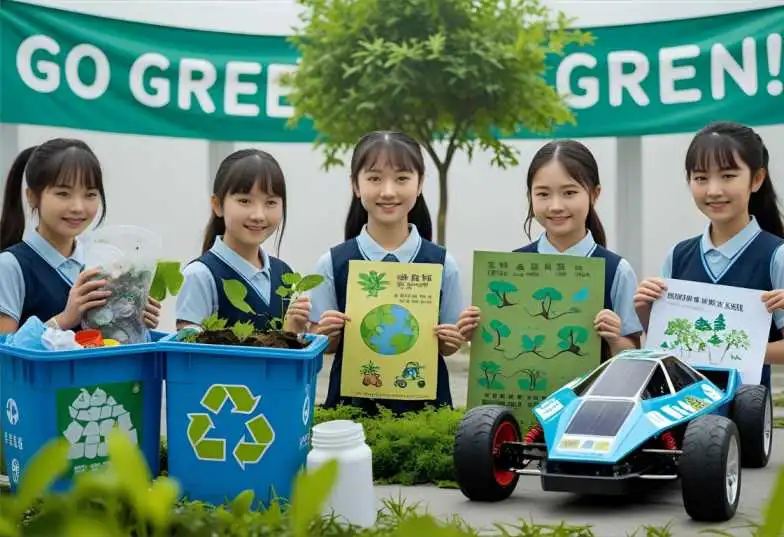
Activities like planting trees, reducing energy consumption, and managing waste directly support SDG 13 targets by reducing carbon footprints and building climate awareness from a young age. Tree-planting and energy challenges also map to national Green School programs.
Q7: Which government or NGO programs support environmental learning in schools?
India’s MOEFCC Green Schools Challenge, UNICEF Climate Action for Kids, EPA environmental education programs, and Swachh Vidyalaya Abhiyan provide toolkits, training, and school-level support for sustainability projects.
Q8: Where can teachers find more classroom resources?
Trusted resources include:
UNICEF Climate Action for Kids
EPA Environmental Education Resources
NASA Climate Kids
UNESCO Education for Sustainable Development
Conclusion: Environmental Activities for Students
Environmental education becomes meaningful when students can see their impact—reducing plastic waste, tracking energy use, growing plants, or discovering new species during nature walks. These simple classroom activities cultivate awareness, responsibility, and curiosity from an early age.
When teachers combine hands-on learning with clear goals and parents reinforce those habits at home, students develop lifelong eco-friendly behaviors. Whether it’s a Water Conservation Relay, a weekly Recycling Challenge, or a Renewable Energy science demo, each activity helps build a generation of environmentally conscious learners.
Start small, stay consistent, and let students experience what it means to care for the planet—one activity at a time.
💬 Share Your Ideas! Which eco-friendly activity will your class try next? Readers are welcome to share observations or experiences related to environmental learning activities in our next article!
📚 Keep the Learning Going: If your students loved the Air Pollution Drawing activity, don’t stop there! Explore more creative guides on 👉 Light Pollution Drawings and 👉 Wildlife-Themed Pollution Posters to deepen environmental art learning and inspire planet-friendly creativity.
🌎 Bonus Tip: For even more interactive ideas and science-backed projects, visit NASA’s Climate Kids — a fun learning hub for young environmental explorers.
Trusted Sources Used
This guide was developed using classroom observations from schools in India (2023–2024) and aligned with environmental education principles recommended by UNESCO, UNICEF, and national Green School programs.
I’m Soumen Chakraborty, the founder and lead researcher at GreenGlobe25. I specialize in translating complex data on pollution, climate risks, and sustainability into clear, actionable guides for Indian households and communities.
My work is based on a rigorous analysis of authoritative sources like the CPCB and WHO, following our publicly-available Fact-Checking Policy to ensure every piece of content is accurate and trustworthy. LinkedIn: chakrabortty-soumen Facebook: Ecoplanet
Air Pollution Drawing Ideas for learners(2025) are a great way to help students understand environmental topics through simple, visual learning. These drawings make it easier for learners to recognize the difference between clean and polluted air while encouraging creativity during school projects.
General Educational Disclaimer: This content is designed solely for environmental awareness and visual education. It does not provide medical, health, legal, or safety advice. All illustrations are symbolic and intended for classroom discussion and creative learning only.
Introduction
📘 Educational Context Notice
This article documents commonly observed drawing themes used in environmental education settings.
It is intended for general informational and awareness purposes and does not function as a learner’s activity program, lesson plan, or instructional curriculum.
All information is based on publicly available data from reliable environmental bodies such as the World Health Organization (WHO), the United Nations Environment Programme (UNEP), and India’s Central Pollution Control Board (CPCB), following our Fact-Checking Policy.
📘 Image Notice:
All drawings and illustrations shown in this guide are conceptual visuals created for educational purposes.
They do not represent real learners, real classrooms, or real-life individuals.
Every winter, many cities across India and Asia — including Delhi, Lahore and Beijing — experience periods of heavy smog due to weather conditions and emission levels. During such days, classroom observations often show that students notice shorter outdoor playtime, hazy skies, or strong smells in the air.
Drawing is one of the most effective ways to help learners visualize what pollution looks like and understand the difference between clean air and polluted air. A simple sketch can turn an invisible concept into something concrete and memorable.
This guide offers easy school-friendly drawing ideas, widely used by teachers in Grades 3–8, to help learners understand environmental issues through creativity.
Why Learners Should Learn About Air Pollution
Learners learn best when they can see ideas come to life. Drawing about air pollution helps them:
Visualize the invisible: smog, smoke, clean air
Connect actions to outcomes: factories vs. trees, cars vs. bicycles
Express feelings creatively: sadness, hope, care for nature
Learn simple solutions: planting trees, walking, renewable energy
Teachers often use these drawings to begin classroom discussions about responsibility, health, and the environment.
According to the World Health Organization (WHO), air pollution is a major environmental concern worldwide. This guide uses drawings only to help students understand the difference between clean and polluted air in a simple, visual way. It does not explain medical effects or provide health guidance. WHO – “Air Pollution and Child Health” explains these risks in detail. Our drawings are meant only to help learners understand the idea of clean and dirty air in a simple way and are not a substitute for medical advice.
📘 Materials are available for non-commercial classroom use.
View the printable reference (PDF) — suitable for school projects, science fairs, and Earth Day activities.
Related resource: If you’re also teaching environmental awareness through night-time themes, explore our
Light Pollution Drawing ideas focused on protecting the night sky and wildlife.
Table of Contents
Why Drawing About Air Pollution Matters for Learners
Drawing is a practical and learner-friendly way to teach environmental concepts. It helps simplify complex ideas so students can understand them visually. Many teachers use quick sketches during lessons to spark discussions such as:
What causes dirty air?
How does clean air support people, plants, and animals?
What everyday actions can reduce pollution?
Through these drawing activities, learners learn to:
Recognize pollution sources such as factories, vehicles, and smoke
Understand positive solutions like trees, bicycles, and renewable energy
Express their ideas creatively using color, contrast, and simple symbols
Build environmental awareness in a friendly, non-technical way
Did You Know? Many schools use art-based activities to introduce environmental science because learners engage more deeply when learning visually.
Quick Drawing Gallery
🌿 Air Pollution Drawing Gallery for Students (2025 Edition)
Explore clear, learner-friendly drawing ideas commonly used in classrooms, eco-clubs, and classroom audiences. These visual examples help students understand environmental concepts through simple comparisons and problem-solution sketches.
Download the classroom reference PDF
🎯 Pro Tip for Teachers: Teachers and students may download and print these guides for non-commercial classroom use, school projects and classroom activities. Reposting the files or artwork on other websites, apps or commercial products is not allowed without written permission.
Copyright Notice: All artwork, illustrations and drawing examples in this guide are original creations, licensed assets or used with explicit permission from contributors. You may use them for classroom teaching, homework, school projects and non-commercial educational activities. Any commercial reuse, redistribution, uploading to other websites or modification of these visuals requires prior written permission from GreenGlobe25.
Common Air Pollution Drawing Themes Observed in Classrooms
Each idea below includes clear, school-friendly steps that work well for students in Grades 3–8. These drawing activities help learners understand environmental concepts visually while keeping the experience fun and creative.
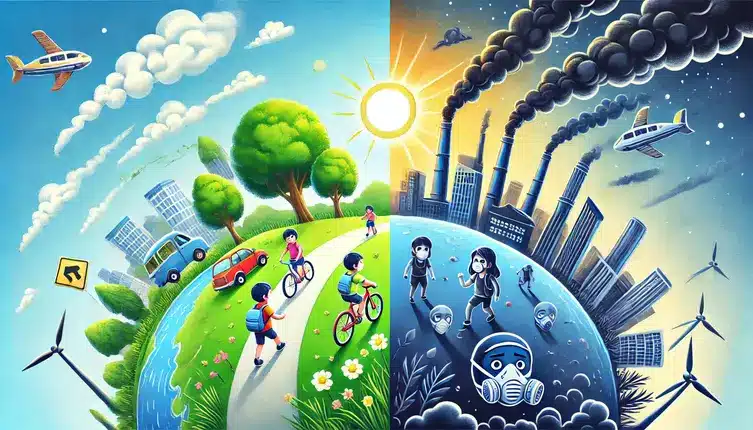
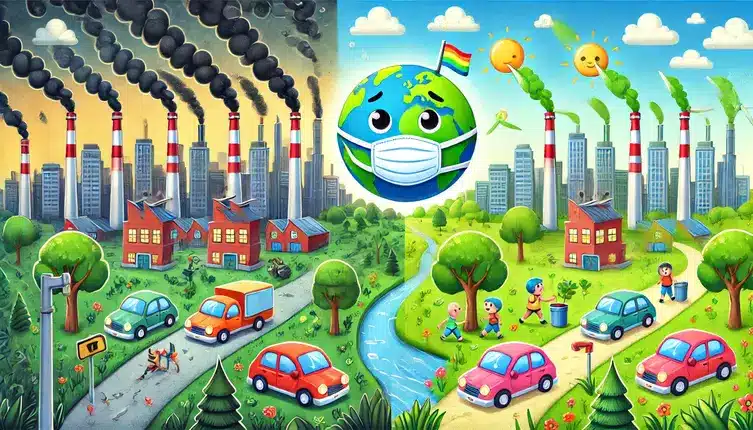
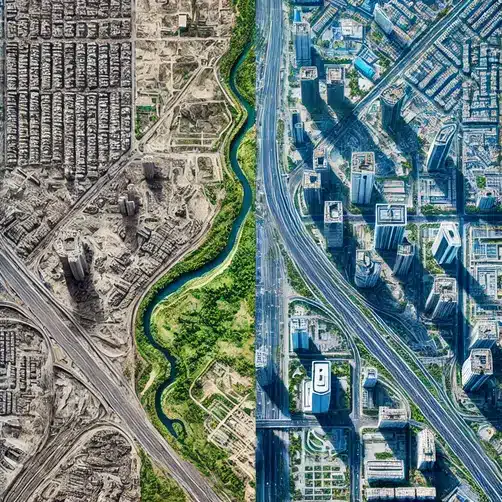
1. Smoggy City vs. Clean City Contrast
Context: Commonly referenced in environmental awareness materials and school-based visual learning exercises.
Illustration: Air pollution visual comparing a smog-affected urban area with a clean, tree-lined cityscape..
Observed Classroom Format:
In classroom and community-learning settings, this drawing theme is typically presented as a contrast-based visual exercise. Learners explore how the same urban environment can appear under different air quality conditions by placing polluted and clean scenes side by side.
In classroom settings, clear visual contrasts—such as muted tones for polluted areas and brighter colors for cleaner environments—often help learners recognize pollution sources and understand how greenery and reduced emissions influence air quality.
Why This Visual Resonates:
Comparative imagery is widely used in environmental communication because it allows viewers to quickly identify cause-and-effect relationships without relying on procedural instruction. Workshop observations suggest that this format supports discussion around human activity, environmental impact, and potential outcomes.
Observed Classroom Insight:
Classroom feedback indicates that contrast-based visuals encourage learners to identify differences independently, often leading to broader conversations about urban planning, vegetation, and air pollution awareness.
2. Tree vs. Factory Battle
Visual Example: A symbolic illustration showing a large tree positioned between industrial structures and the surrounding environment, visually representing nature’s role in mitigating pollution.
Illustration: A symbolic drawing showing nature protecting the environment from industrial smoke.
Observed Classroom Format:
In classroom and awareness-campaign settings, this theme is commonly presented as a symbolic contrast exercise. Students depict natural elements and industrial activity using opposing colors and visual balance to communicate protection and resistance.
Classroom feedback indicates that symbolic imagery—such as trees acting as barriers—helps learners grasp abstract environmental concepts without technical explanation.
Why it works:
The drawing reinforces the idea of trees as natural air filters and encourages environmental responsibility through visual storytelling.
3. Bicycle vs. Cars Transportation
Visual Example: A comparison scene highlighting bicycles and clean surroundings contrasted with motor vehicles emitting visible exhaust.
Illustration: A clear comparison between polluting vehicles and eco-friendly transport options.
Observed Classroom Format:
This drawing theme is typically used as a comparison-based visual discussion tool. Students illustrate different transportation choices and their environmental outcomes using parallel scenes and color contrast.
Workshop observations suggest that transport-focused visuals prompt students to reflect on daily habits and connect personal choices to air quality outcomes.
Educational Value of This Visual:
Clear visual contrasts make the environmental impact of transport choices immediately understandable.
4. Earth with Protective Mask
Visual Example: A personified illustration of Earth wearing a protective mask, surrounded by pollution indicators.
Illustration: A learner-friendly way to show the idea of protecting Earth from pollution.
Observed Classroom Format:
For younger age groups, this concept is usually introduced as a character-based visual exercise. Personification helps learners emotionally relate to environmental protection themes without complex explanations.
Classroom observations show that expressive elements increase engagement and memory retention among early learners.
Why it works:
The familiar concept of protection makes environmental responsibility relatable and non-threatening.
The mask shown is a symbolic visual element representing environmental protection, not personal health equipment or guidance.
5. Factory Before & After
Visual Example: A split-scene illustration showing an industrial area before and after cleaner technologies are adopted.
Illustration: A before-and-after comparison showing how technology can reduce pollution.
Observed Classroom Format:
This drawing is commonly presented as a transformation-based comparison. Students depict the same environment under two conditions to visualize the effects of technological change.
Workshop observations suggest that before-and-after formats simplify complex ideas such as clean energy transitions and pollution reduction.
Educational Value of This Visual:
Visual transformation clearly communicates the impact of solutions without requiring technical detail.
6. Animal Protection Drawing
Visual Example: An animal shown within a clean, protected space, contrasted against polluted surroundings.
Illustration: A thoughtful drawing showing how pollution affects wildlife habitats.
Observed Classroom Format:
In classroom discussions, this theme is often used as an empathy-based illustration exercise. Students select animals they relate to and depict environmental threats using symbolic boundaries.
Classroom feedback indicates that wildlife-focused visuals naturally lead to discussions about habitat protection and responsibility.
Why it works:
Emotional connection strengthens awareness and long-term understanding.
7. Solar Solution Drawing
Visual Example: Homes equipped with solar panels beneath a bright sun, set in a clean environment.
Illustration: A positive drawing showing how sunlight can power homes without creating pollution.
Observed Classroom Format:
This theme is typically introduced as a positive, solution-oriented visual. Students illustrate renewable energy concepts using familiar structures such as houses and sunlight.
Classroom observations suggest that solution-focused drawings help balance pollution topics with optimism and practical awareness.
Educational Value of This Visual:
Positive imagery reinforces the idea that clean energy is achievable and beneficial.
8. Lung Health Comparison
Visual Example: A side-by-side depiction of lungs affected by polluted air versus lungs in a clean environment.
Illustration: A simple drawing that shows the difference between clean and polluted air using two lungs.
Observed Classroom Format:
This concept is usually framed as a high-level visual comparison for awareness purposes. Educators emphasize gentle symbolism rather than detailed biological explanation.
The illustration supports general understanding of air quality impacts without providing medical guidance.
Why it works:
Simple visual contrast helps students connect environmental conditions to human well-being.
Educational Disclaimer: This illustration is a symbolic awareness tool only. It does not depict real human organs, medical conditions, or health outcomes. No health conclusions should be drawn from this visual.
9. Learners’ Playground Contrast
Visual Example: A playground scene divided between polluted and clean air conditions, showing different experiences for learners.
Illustration: A relatable playground scene showing how air quality impacts learners’ outdoor play.
Observed Classroom Format:
In classroom settings, this drawing is commonly used as a relatable everyday-life scenario. Students depict familiar environments to explore how environmental quality affects daily activities.
Workshop observations suggest that school-based scenes generate strong engagement and discussion.
Educational Value of This Visual:
Relatability increases emotional impact and awareness.
10. Global Warming Connection
Visual Example: An illustration connecting air pollution, rising temperatures, and environmental stress through symbolic elements.
Illustration: A learner-friendly drawing connecting air pollution with climate change in a simple, visual way.
Observed Classroom Format:
This theme is typically introduced as a visual storytelling exercise. Students combine multiple environmental symbols to show interconnected issues such as pollution and climate change.
Classroom experience shows that narrative-style visuals help learners understand complex relationships at a basic level.
Why it works:
Story-based visuals make abstract global issues easier to comprehend.
How to Create Effective Air Pollution Awareness Drawings
✅ DO These
Use clear color contrasts for pollution vs. clean air
Show both the problem and the solution in one frame
Keep your message simple, visual, and easy to understand
Add a short, meaningful slogan that supports your drawing
Use the entire page space to make your idea stand out
❌ AVOID These
Don’t overcrowd the page with too many elements
Avoid messages that are unclear or hard to interpret
Don’t rely only on pencil; add color to highlight contrasts
Avoid tiny details that disappear from a distance
Don’t forget to add identifying details if required for a classroom activity.
Common Classroom Timing Pattern (Observed)
In many classroom settings, teachers allocate short time blocks to help students conceptualize, sketch, and finalize visual messages efficiently.
Need more inspiration? Search for “air pollution drawing ideas” on image platforms to see how different artists and students illustrate the topic. Always check the original creator’s permissions before copying or reusing any artwork from external sites.
Before You Start Drawing…
Tell your students one sentence:
“Your drawing is not decoration — it is a message. And your message should land in 1 second.”
A simple, effective structure to communicate air pollution clearly:
Problem → Solution → Slogan
examples:
problem
solution
slogan
factory smoke
trees + solar rooftop
“Pollution is man-made. So is the solution.”
masked learners on swing
bikes + blue sky
“Childhood deserves clean air.”
black lung
pink healthy lung
“Good air = good life.”
Tip for teachers:
Don’t score only on neatness. Score on message clarity.
Educators often encourage students to select one theme and express it visually using simple symbols and contrast.
These drawing ideas fit naturally into several school subjects and help students understand environmental topics in a clear, visual way. Teachers can use them for short classroom activities, project work, or awareness campaigns.
Where These Activities Fit in the Curriculum
Environmental Science: Helps students identify pollution sources and solutions through simple visual comparisons.
Geography: Useful for understanding how city design, vegetation, and land use affect air quality.
Social Studies: Encourages discussions about community responsibility, clean energy choices, and public health.
Art & Visual Communication: Teaches poster design, contrast, color usage, and message clarity.
Downloadable Classroom Resources
Teachers can use the following quick lessons, classroom activities, or homework assignments:
Air Pollution Drawing Ideas – Printable PDF
Clean vs Polluted City – Comparison Poster Template
All answers are rewritten to be concise, learner-friendly, and educationally accurate, without crossing into YMYL medical claims.
Q1: What is the easiest air pollution drawing for a 3rd grader?
The “Earth with a Mask” drawing is usually the simplest. Students draw a circle for Earth, add a mask, and sketch small smoke clouds around it. It’s quick, visual, and easy to understand.
Q2: How can I make my drawing stand out in classroom settings?
Focus on contrast and clarity. Effective air pollution awareness posters often use:
A clear “problem vs. solution” layout
One strong slogan
Simple shapes with bold colors
In most classroom or awareness events, reviewers care more about a clear, meaningful message than perfect, realistic drawing skills.
Q3: What colors work best for air-pollution drawings?
Use:
Dark grays, browns, and blacks for polluted areas
Bright greens, blues, and yellows for clean or solution-focused areas
This contrast makes the message clear even from a distance.
Q4: How do I explain air pollution to learners through drawing?
Use comparisons they understand — such as:
A gray, smoky sky vs. a blue, clean sky
A sad Earth vs. a happy Earth
A factory vs. trees or solar panels
This visual approach helps learners grasp the concept quickly.
Q5: Can I create a good poster about air pollution even if I’m not good at drawing?
Yes—strong ideas matter more than artistic skill. Use simple shapes (circles, rectangles, basic buildings, simple trees) and follow a clear structure like:
Before → After or Polluted → Clean
A short slogan adds impact.
Q6: Are these drawings suitable for all age groups?
Yes, but complexity varies.
Younger students do better with Earth with Mask or Tree vs Factory.
Older students enjoy Lung Comparison, Global Warming, or Before/After Technology themes.
Q7: Can teachers customize these ideas?
Absolutely. Many teachers adapt the drawings to include local landmarks, school areas, or city-specific pollution problems to make the lessons more relatable.
This guide is based on publicly available educational and awareness materials from the following organizations:
World Health Organization (WHO) – Air Pollution and Environmental Health Awareness Resources
United Nations Environment Programme (UNEP) – Air Quality Education and Sustainability Materials
Central Pollution Control Board (CPCB), India – Public Awareness and Environmental Monitoring Publications
These references are used strictly for informational and educational context. No medical, legal, or policy advice is provided.
Author Bio
I’m Soumen Chakraborty, the founder and lead researcher at GreenGlobe25. I specialize in translating complex data on pollution, climate risks, and sustainability into clear, actionable guides for Indian households and communities.
My work is based on a careful review of publicly available authoritative sources like the CPCB and WHO, following our publicly-available Fact-Checking Policy to ensure every piece of content is accurate and trustworthy. LinkedIn: chakrabortty-soumen Facebook: Ecoplanet
Water is the foundation of all life — it sustains every plant, animal, and human on Earth. Yet in 2025, clean and safe water remains out of reach for millions, according to global water sanitation assessments. According to estimates from the World Health Organization (WHO, 2024), unsafe and contaminated water is linked to more than 1.4 million preventable deaths each year.
In India, rivers such as the Ganga, Yamuna, and Mithi frequently carry plastics, sewage, and industrial waste, as documented in CPCB and state pollution reports. Groundwater is also affected, as pesticides and heavy metals can seep through soil layers and contaminate aquifers used for drinking water. Polluted water sources can contribute to ecological damage and increased health risks for communities.
Simply put, water pollution occurs when human activities introduce harmful substances into natural water bodies such as rivers, lakes, oceans, or underground aquifers. These pollutants — whether chemical, biological, or plastic-based — degrade water quality, harm ecosystems, and threaten human health.
In this guide, you’ll explore the eight major types of water pollution, from groundwater and surface water contamination to oil spills and oxygen depletion. You’ll also learn about their main causes, real-world examples in India, and the most practical solutions to prevent them.
By the end, you’ll understand not just what water pollution is — but how it affects your health, your environment, and what can be done today to protect this most vital resource.
This guide is for general educational purposes about water pollution and public health. It does not provide medical advice or diagnosis. For personal health concerns, please consult a qualified healthcare professional.
Related Guide: For a deeper understanding of India’s pollution challenges, see our article on Thermal Pollution Explained and How Water Pollution Affects River Ecosystems.
Table of Contents
📊 Key Water Pollution Stats – India (2025)
💧 Nearly 70% of India’s surface water is unsafe for direct consumption (DevelopmentAid 2025, citing CPCB data).
🧴 India generates around 4.1 million tonnes of plastic waste annually.(MoEFCC 2024 PDF)
🚱 About 80% of urban sewage remains untreated before entering rivers. (CPCB 2021)
Alt text: Table showing major types of water pollution in India (2025) with their causes, effects, and real examples.
Types of Water Pollution
1. Groundwater Pollution
Hidden contamination from leaking tanks, pesticides, and industrial waste seeps into underground aquifers, making water unsafe for communities.
Illustrative conceptual graphic used for educational explanation — not a real photograph.
Groundwater Pollution:
Groundwater pollution is often difficult to detect because it occurs underground and may persist for long periods. This section explains how contaminants seep into aquifers and affect drinking water.
1. What It Is Groundwater is the hidden water stored in soil, sand, and rock layers beneath the Earth’s surface. Many communities rely on it as their primary source of drinking water, making it critical for human health. When pollutants seep into the ground, they can contaminate aquifers silently, often without visible signs. Unlike rivers or lakes, groundwater pollution is difficult to detect and may remain unnoticed for years, quietly affecting everyone who depends on wells and boreholes.
2. Main Causes Groundwater contamination usually occurs gradually but can have serious long-term consequences. The most common causes include:
Agricultural Chemicals: Pesticides, herbicides, and synthetic fertilizers applied to crops can percolate into the soil. Rainwater carries these substances deeper underground, where they accumulate in aquifers.
Industrial Waste and Toxic Spills: Factories and processing plants may leak hazardous chemicals through cracked containment systems or accidental spills.
Leaking Underground Storage Tanks: Tanks storing fuel, solvents, or industrial waste can corrode, releasing toxic substances directly into the soil.
Septic Systems and Landfills: Poorly maintained septic tanks and unlined landfills allow sewage and leachate to seep into groundwater, contaminating nearby wells.
3. Effects on People and the Environment Groundwater pollution is especially dangerous because it can persist for decades. Even after the original pollution source is removed, contamination may linger underground, making remediation costly and complex. Key impacts include:
Unsafe Drinking Water: Polluted groundwater may contain nitrates, heavy metals, and chemicals such as arsenic or benzene, which are associated with long-term health risks according to WHO and EPA studies.
Health Risks: Long-term exposure to contaminated groundwater has been associated with cancer, neurological effects, reproductive complications, and kidney-related issues, as documented in WHO and EPA health assessments.
Environmental Harm: Contaminated groundwater can seep into rivers, lakes, and wetlands, threatening aquatic life and spreading pollution far from the original source.
4. Solutions and Prevention While cleaning polluted groundwater is challenging, proactive measures can prevent contamination and reduce risks:
Reduce Agricultural Chemicals: Adopt organic or precision agriculture to minimize pesticide and fertilizer use.
Proper Waste Disposal: Hazardous industrial and household waste should be safely disposed of according to regulations.
Upgrade Storage Systems: Replace old underground tanks with modern, corrosion-resistant alternatives.
Monitoring and Regulation: Authorities should regularly monitor soil and groundwater quality near industrial sites, farms, and landfills to catch pollution early.
Visible waste like plastics, industrial discharge, and sewage pollute rivers, lakes, and oceans, threatening wildlife and human health.
Illustrative conceptual graphic used for educational explanation — not a real photograph.
Surface Water Pollution:
Rivers, lakes, and ponds are increasingly affected by visible pollutants such as plastics and sewage.
1. What It Is Surface water pollution occurs when harmful substances enter visible water bodies such as rivers, lakes, ponds, reservoirs, and oceans. Unlike groundwater, which lies hidden underground, surface water contamination is often easier to detect—think garbage floating in rivers, oil slicks on lakes, or discolored water.
However, visibility doesn’t mean the problem is easy to solve. Every year, industries, farms, and households contribute pollutants to waterways, as documented in various environmental reports.
2. Main Causes Surface water pollution arises from multiple human activities:
Industrial Waste: Some factories still release untreated or poorly treated wastewater containing toxic chemicals, heavy metals, or heated water into rivers and streams.
Plastic and Solid Waste: Plastics, bottles, and packaging often find their way into waterways. Over time, they break down into microplastics, which are ingested by fish and eventually enter the human food chain.
Untreated Sewage: Outdated or missing sewage treatment systems allow raw sewage to flow into rivers and lakes, introducing bacteria, viruses, and excess nutrients.
Stormwater Runoff: Rainwater washing over streets, parking lots, and construction sites picks up oil, chemicals, and debris, which then enters local water bodies.
3. Effects on People and the Environment Surface water pollution produces immediate and visible impacts:
Decline in Aquatic Life: Pollutants lower oxygen levels and harm fish and other aquatic organisms, causing fish kills and loss of biodiversity.
Spread of Diseases: Contaminated water can trigger outbreaks of cholera, dysentery, and other illnesses, especially in communities without safe drinking water infrastructure.
Unsafe Drinking Water: Rivers and lakes are major drinking water sources. Contamination raises treatment costs and can render water undrinkable.
Economic Losses: Polluted waterways can negatively affect fisheries, tourism, and recreational activities, leading to significant economic losses in affected regions.
4. Solutions and Prevention Protecting surface water requires combined efforts from governments, industries, and individuals:
Proper Waste Treatment: Industries must treat wastewater to remove toxins before discharge.
Improved Sewage Infrastructure: Upgrading treatment facilities prevents harmful microorganisms and nutrients from entering water bodies.
Reduce Plastic Use: Switching to reusable products and supporting plastic bans can significantly cut pollution.
Stronger Environmental Regulations: Governments must enforce strict laws against illegal dumping and ensure companies follow sustainable practices.
Invisible pathogens from sewage and animal waste enter water supplies, causing serious diseases and public health risks.
Illustrative conceptual graphic used for educational explanation — not a real photograph.
Microbiological Pollution:
Bacteria, viruses, and parasites can contaminate water and increase the risk of waterborne diseases. This section describes how poor sanitation and inadequate treatment fuel microbiological pollution.
1. What It Is Microbiological pollution, also known as biological contamination, occurs when disease-causing microorganisms—bacteria, viruses, and parasites—enter water sources. This pollution is particularly dangerous because it is invisible to the naked eye, yet it can trigger serious disease outbreaks in humans and animals.
In many low-income regions, microbiological pollution is considered one of the major threats to public health. According to WHO assessments, contaminated drinking water causes millions of preventable deaths each year, with children being the most affected.
2. Main Causes Microbiological contamination usually stems from poor sanitation and inadequate waste management. Key sources include:
Untreated Sewage: Discharging human waste directly into rivers, lakes, or coastal waters introduces pathogens such as E. coli, cholera, and hepatitis viruses.
Animal Waste: Livestock farms produce large amounts of manure. Rainwater runoff can carry bacteria and parasites from these farms into nearby streams and ponds.
Poor Hygiene Infrastructure: Open defecation and lack of proper toilets allow fecal matter to seep into both groundwater and surface water.
Flooding and Natural Disasters: Heavy rains or floods can overwhelm sanitation systems, mixing sewage with drinking water supplies.
3. Effects on People and the Environment The impacts of microbiological pollution can be severe and far-reaching:
Waterborne Diseases: Contaminated water spreads illnesses like cholera, typhoid fever, dysentery, hepatitis A, and parasitic infections such as giardiasis.
High Infant Mortality: Diarrheal diseases linked to unsafe water are a leading cause of child deaths in many developing countries.
Economic Burden: Families and governments face increased healthcare costs, lost productivity, and expenses for emergency water supply measures.
Threat to Aquatic Life: Some pathogens also harm fish and amphibians, disrupting food chains and biodiversity.
4. Solutions and Prevention Preventing microbiological pollution requires combined efforts in sanitation, infrastructure, and public education:
Invest in Sewage Treatment: Modern facilities can remove most pathogens before wastewater is discharged.
Protect Water Sources: Buffer zones around rivers and lakes help prevent contamination from human and animal waste.
Educate Communities: Public health campaigns promoting handwashing, latrine use, and safe hygiene practices are essential.
Provide Safe Drinking Water: Solutions such as chlorination, filtration, and protected wells can dramatically reduce disease risk.
According to WHO (2024), waterborne pathogens remain a major contributor to illness in low- and middle-income regions.
Hazardous chemicals from factories, farms, and households seep into water sources, posing severe risks to people and ecosystems.
Illustrative conceptual graphic used for educational explanation — not a real photograph.
Chemical Water Pollution:
Toxic chemicals from farms, factories, and households can enter water supplies. This section explains which pollutants are most harmful and how they accumulate over time.
1. What It Is Chemical water pollution occurs when harmful synthetic substances enter natural water sources. Unlike organic waste or bacteria, many chemicals are highly persistent, remaining toxic in the environment for decades. What makes this type of pollution especially concerning is that most chemicals are invisible and tasteless—people may unknowingly consume contaminated water for years.
From heavy metals in industrial effluents to pesticide residues in agricultural runoff, chemical water pollution is a global problem that threatens human health, wildlife, and entire ecosystems.
2. Main Causes Chemical pollutants reach rivers, lakes, groundwater, and oceans through several channels:
Industrial Waste: Factories and mining operations sometimes release wastewater containing heavy metals such as mercury, lead, cadmium, and arsenic. Even at low concentrations, these metals are highly toxic.
Agricultural Runoff: Pesticides, herbicides, and fertilizers used on farms can be washed into streams and rivers or seep into underground aquifers during rainfall.
Oil Spills: Accidental releases of crude oil from tankers, pipelines, or drilling rigs contaminate coastal waters. Even small spills can significantly harm marine life.
Household Chemicals: Everyday products, including cleaning agents, paints, solvents, and pharmaceuticals, often enter water systems that are not equipped to remove them completely.
Landfill Leachate: Rainwater filtering through landfills can pick up chemicals that then seep into groundwater.
3. Effects on People and the Environment The impacts of chemical pollution are severe and long-lasting:
Toxic Drinking Water: Consuming water contaminated with heavy metals or industrial chemicals has been associated with neurological effects, increased cancer risk, and reproductive health concerns, according to WHO and EPA research.
Harm to Aquatic Life: Chemicals disrupt reproductive systems in fish and amphibians, leading to population declines and sometimes species extinction.
Bioaccumulation: Toxic substances accumulate in small organisms, and as predators consume them, these toxins move up the food chain, eventually reaching humans.
Soil and Crop Damage: Using polluted water for irrigation introduces toxic substances into soil, reducing agricultural productivity and compromising food safety.
4. Solutions and Prevention Tackling chemical water pollution requires a mix of regulation, innovation, and personal responsibility:
Stricter Regulations: Governments must enforce environmental laws limiting industrial discharge into waterways.
Eco-Friendly Farming: Farmers can adopt integrated pest management and organic practices to reduce chemical runoff.
Improved Industrial Practices: Modern factories can implement closed-loop systems to recycle wastewater and minimize contamination.
Rapid Spill Response: Oil spill teams and containment measures should be ready to address accidental releases quickly.
Responsible Household Choices: Consumers can switch to biodegradable cleaning products and properly dispose of unused medications.
EPA guidelines emphasize that agricultural chemicals such as nitrates and phosphates are key contributors to freshwater degradation (EPA, 2024).
Factories and power plants release warm water into rivers and lakes, lowering oxygen levels and disrupting aquatic life.
Illustrative conceptual graphic used for educational explanation — not a real photograph.
Thermal Pollution:
Heated water from factories and power plants can disrupt aquatic life by lowering oxygen levels. This section explains why temperature changes can be as damaging as some chemical spills.
1. What It Is Thermal pollution occurs when human activities significantly increase the temperature of natural water bodies. Although it may seem less harmful than chemical spills or oil leaks, excess heat can severely disrupt aquatic ecosystems over time.
Water naturally maintains temperature ranges suitable for countless species. When factories, power plants, or industrial facilities discharge heated water, it lowers oxygen levels and alters habitat conditions, putting fish, amphibians, and other aquatic organisms at risk.
Power plants and factories often release heated water directly into rivers (Thermal Pollution), causing oxygen depletion and fish deaths.
2. Main Causes Thermal pollution usually stems from a combination of industrial practices and environmental changes:
Power Plants and Factories: Facilities using water for cooling often return it to rivers or lakes at much higher temperatures. Sudden temperature changes can harm or displace sensitive aquatic species.
Deforestation: Trees and vegetation provide shade that keeps water bodies cool. Removing them allows sunlight to heat water surfaces more quickly.
Urban Runoff: Rainwater flowing over concrete, asphalt, and rooftops absorbs heat before entering waterways, raising water temperatures.
Climate Change: Rising global temperatures exacerbate local heating effects, further stressing aquatic ecosystems.
3. Effects on People and the Environment Thermal pollution impacts ecosystems and human activities in several ways:
Reduced Oxygen Levels: Warm water holds less dissolved oxygen, causing fish and invertebrates to suffocate or migrate.
Loss of Biodiversity: Species adapted to narrow temperature ranges may disappear from affected areas.
Algae Blooms: Higher temperatures accelerate algae growth. Algal blooms consume oxygen and release toxins, harming aquatic life and water quality.
Disrupted Reproduction: Many fish and amphibians rely on seasonal temperature cues to spawn. Constantly elevated temperatures interfere with their breeding cycles.
While thermal pollution may not always pose immediate human health risks, it can devastate fisheries, recreational water use, and drinking water supplies.
4. Solutions and Prevention Limiting thermal pollution requires a mix of technological solutions and environmental management:
Cooling Ponds and Towers: Power plants can use these systems to dissipate heat before returning water to rivers or lakes.
Riparian Planting: Restoring trees and vegetation along waterways shades and cools water naturally.
Heat Recovery Technologies: Industries can capture waste heat for reuse, reducing the temperature of discharged water.
Urban Planning: Designing cities with green spaces, permeable surfaces, and water-sensitive infrastructure minimizes heat absorption and runoff.
Areas of severely reduced oxygen levels, often called ‘dead zones,’ where most aquatic species cannot survive.
Illustrative conceptual graphic used for educational explanation — not a real photograph.
Oxygen-Depleting Pollution:
Excess nutrients trigger algae blooms that consume oxygen and create “dead zones.” This section explains how human activities can turn healthy waters into low-oxygen environments.
1. What It Is Oxygen-depleting pollution occurs when excess organic matter or nutrients enter a water body, triggering uncontrolled growth of microorganisms. As bacteria break down this material, they consume large amounts of dissolved oxygen, leaving insufficient levels for fish, plants, and other aquatic life.
This imbalance can transform healthy rivers, lakes, or coastal waters into “dead zones”—areas where almost no life can survive. Oxygen depletion is widely recognized as a major driver of ecosystem collapse in both freshwater and marine environments.
2. Main Causes Several human activities contribute to oxygen depletion:
Agricultural Runoff: Fertilizers rich in nitrogen and phosphorus wash into streams and rivers, fueling massive algae blooms.
Untreated Sewage: Raw sewage or poorly treated wastewater introduces organic matter and bacteria that strip oxygen from water.
Industrial Discharges: Food processing plants, slaughterhouses, and paper mills often release nutrient-laden waste.
Stormwater Pollution: Heavy rains carry organic debris, animal waste, and yard clippings into waterways, accelerating oxygen loss.
3. Effects on People and the Environment Oxygen-depleting pollution has significant and sometimes irreversible impacts:
Dead Zones: Large areas of freshwater and marine ecosystems become uninhabitable for fish, crustaceans, and other species.
Mass Fish Deaths: Sudden drops in oxygen can cause sudden, widespread fish deaths within hours.
Toxic Algal Blooms: Nutrient overload encourages cyanobacteria growth, producing toxins that threaten human and animal health.
Water Quality Decline: Decomposing organic matter creates foul odors and sludge, rendering water unsafe for drinking, recreation, and fisheries.
One of the largest dead zones in the world forms in the Gulf of Mexico, where nutrient runoff from farms along the Mississippi River causes annual algae blooms that suffocate marine life.
4. Solutions and Prevention Reducing oxygen-depleting pollution requires sustainable farming, improved waste management, and ecological conservation:
Nutrient Management: Farmers can adopt precision agriculture techniques to reduce fertilizer use and prevent runoff.
Upgraded Wastewater Treatment: Modern treatment plants remove excess organic material and nutrients before water is discharged.
Wetland Protection: Wetlands naturally filter nutrients and sediments, preventing them from reaching rivers and lakes.
Buffer Strips: Planting vegetation along waterways absorbs excess nutrients and slows surface runoff.
Spills and leaks create toxic slicks that suffocate marine animals, damage coastal ecosystems, and leave long-lasting environmental scars.
Illustrative conceptual graphic used for educational explanation — not a real photograph.
Oil Pollution:
Oil slicks from spills and leaks coat water surfaces, disrupting marine life and habitats. This section explains how small and large oil spills can create long-term environmental impacts.
1. What It Is Oil pollution occurs when petroleum products spill or leak into oceans, rivers, or coastal areas, forming a thick, toxic layer on the water’s surface. This slick blocks sunlight and reduces oxygen exchange, severely disrupting aquatic ecosystems. While large tanker disasters often grab headlines, smaller but frequent leaks from ships, pipelines, and land-based sources cumulatively cause serious environmental damage.
Unlike some contaminants, oil does not dissolve in water. It spreads rapidly, coating everything it touches in a sticky, poisonous film that can persist for years.
2. Main Causes Oil pollution stems from both accidental and intentional human activities:
Tanker Accidents: Large oil tankers can spill millions of gallons of crude oil during collisions or groundings.
Offshore Drilling: Oil platforms extracting from beneath the seabed sometimes experience blowouts or leaks.
Pipeline Leaks: Underground or undersea pipelines may rupture due to corrosion, poor maintenance, or natural disasters.
Illegal Dumping: Some ships discharge oily waste or bilge water into the sea to avoid disposal fees.
Runoff from Land: Used motor oil, lubricants, and industrial residues often enter waterways via storm drains.
3. Effects on People and the Environment Oil pollution is visually striking and causes significant ecological harm:
Marine Animals: Oil can coat birds’ feathers, reducing insulation and buoyancy, increasing the risk of hypothermia or drowning.
Fish and Shellfish: Toxic compounds damage gills and organs, causing suffocation, poisoning, or reproductive failure.
Beaches and Coastal Communities: Oil slicks ruin beaches, harm tourism, and require expensive cleanup operations.
Long-Term Damage: Even after cleanup, residues remain in sediments and food chains for decades.
A historic example is the 1989 Exxon Valdez spill, which released nearly 11 million gallons of crude oil into Alaska’s Prince William Sound. Its ecological effects are still evident today.
4. Solutions and Prevention Preventing and managing oil pollution requires a mix of regulation, technology, and public awareness:
Strict Regulations and Enforcement: Governments must mandate double-hulled tankers, regular inspections, and comprehensive spill response plans.
Advanced Cleanup Methods: Skimmers, booms, and bioremediation techniques improve the effectiveness of spill management.
Proper Waste Disposal: Mechanics and industries should recycle used oil and avoid illegal dumping.
Transition to Renewable Energy: Reducing fossil fuel reliance lowers the risk of oil-related accidents.
Excessive sediments and particles cloud waterways, block sunlight, and damage aquatic habitats.
Illustrative conceptual graphic used for educational explanation — not a real photograph.
Suspended Matter Pollution:
Sediments, silt, and debris cloud water and damage aquatic habitats. This section explains how everyday erosion and construction activities contribute to this often-overlooked form of pollution.
1. What It Is Suspended matter pollution occurs when solid particles—such as soil, silt, sand, and industrial debris—remain floating in water rather than dissolving. While some sediment naturally enters rivers and lakes, excessive amounts from human activities can cloud waterways, reduce sunlight penetration, and smother aquatic habitats.
This type of pollution is often referred to as turbidity, as it makes water appear dirty or murky. Although it may seem less immediately harmful than chemical or oil pollution, suspended matter can severely disrupt aquatic ecosystems over time.
2. Main Causes Suspended matter pollution arises from several land-based activities:
Soil Erosion: Deforestation and poor farming practices remove protective vegetation, allowing rainwater to wash exposed soil into streams.
Construction Sites: Roads, buildings, and industrial facilities generate loose soil and debris, which runoff carries into waterways.
Mining Operations: Open-pit mining and excavation stir up sediment that can travel long distances in rivers.
Industrial Waste Discharges: Factories may release particles from manufacturing processes directly into water bodies without proper filtration.
3. Effects on People and the Environment Suspended particles impact water quality and aquatic life in multiple ways:
Reduced Sunlight: Murky water blocks sunlight from reaching underwater plants, slowing photosynthesis and lowering dissolved oxygen levels.
Clogged Fish Gills: Fine sediments can damage or obstruct fish gills, causing suffocation or infection.
Disrupted Food Chains: Sediment can smother fish eggs and aquatic insects, reducing survival rates and biodiversity.
Decreased Drinking Water Quality: Excess sediment increases water treatment costs and may carry attached pollutants like heavy metals and pesticides.
Indirectly, suspended matter pollution also harms fisheries, recreational areas, and local communities dependent on clean water.
4. Solutions and Prevention Effective management of sediment pollution requires combining sustainable land practices with improved industrial controls:
Reforestation and Vegetation Cover: Planting trees and maintaining ground cover stabilizes soil and prevents erosion.
Erosion Control Measures: Silt fences, terracing, and sediment ponds at construction sites trap particles before they reach waterways.
Responsible Mining Practices: Mining companies should implement runoff control systems to capture sediment.
Improved Industrial Filtration: Factories can install filters and sedimentation tanks to remove particles from wastewater before discharge.
Water pollution is one of the most pressing environmental challenges of our time. But it’s also preventable. By understanding the different types—from oil spills to chemical contamination—and recognizing their causes and effects, we can take meaningful action to protect our health and our planet.
This article provides general educational information about water pollution and its environmental and public health impacts. It is not medical advice. For personal health concerns or diagnosis, please consult a qualified healthcare professional.
The main types are surface water pollution, groundwater pollution, microbiological pollution, chemical pollution, thermal pollution, oxygen-depleting pollution, oil pollution, and suspended matter pollution.
What is the most common cause of water pollution?
Agricultural runoff is widely considered one of the leading causes of water pollution worldwide. Fertilizers and pesticides from farms often wash into rivers, alongside untreated sewage and factory waste.
How does water pollution affect human health?
Contaminated water can increase the risk of diseases such as diarrhea, cholera, and other waterborne illnesses. Long-term exposure to certain pollutants has been associated with cancer, neurological effects, and reproductive health concerns, according to WHO reports.
What are some examples of chemical water pollution?
Examples include pesticides, heavy metals like mercury and lead, industrial waste, and oil spills—all of which can harm humans and wildlife.
How can individuals reduce water pollution at home?
You can help by using fewer chemicals, avoiding plastic waste, using natural cleaners, reducing lawn fertilizers, and maintaining your septic system.
What is a dead zone in the ocean or rivers?
A dead zone is an area with almost no oxygen in the water. It happens when pollution causes algae to grow, die, and decompose, reducing oxygen levels to the point where marine life cannot survive.
Why is plastic pollution so harmful to water bodies?
Plastic breaks down into microplastics that are eaten by fish and animals. It pollutes oceans, harms ecosystems, and can even end up in our drinking water and food.
What are some modern solutions to stop water pollution?
Modern solutions to stop water pollution include natural methods like bioremediation (using microbes to clean pollutants), stricter environmental regulations, green infrastructure (like rain gardens and permeable pavements), and community clean-up initiatives. These approaches help prevent and reduce pollution at both local and global levels.
About the Author
I’m Soumen Chakraborty, the founder and lead researcher at GreenGlobe25. I specialize in translating complex data on pollution, climate risks, and sustainability into clear, actionable guides for Indian households and communities.
My work is based on a rigorous analysis of authoritative sources like the CPCB and WHO, following our publicly-available Fact-Checking Policy to ensure every piece of content is accurate and trustworthy. LinkedIn: chakrabortty-soumen Facebook: Ecoplanet
Last update on December 2025.
References
World Health Organization (WHO). 2024. Global Water, Sanitation & Hygiene (WASH) Report 2024).
Educational & Health Context Disclaimer: This article discusses environmental noise exposure and commonly cited public health research at a general, informational level. It does not provide medical, diagnostic, or treatment advice. Any references to health outcomes are for awareness and education only and should not be interpreted as personal health guidance.
Introduction: Why We Need Practical Solutions for Noise Pollution
Noise pollution—from honking traffic to construction activity and household machinery—is increasingly recognized as a significant environmental concern in India and globally. According to World Health Organization (WHO) guidelines, sustained sound levels above approximately 55 decibels (dB) during the day or 40 dB at night are commonly referenced in environmental research as being associated with increased stress, sleep disruption, and related well-being challenges.
The most effective solutions for noise pollution include smarter urban design, home soundproofing, community green buffers, and stronger government regulation. According to the World Health Organization (WHO, 2023), combining these strategies can reduce harmful noise exposure by an estimated 15–20 percent, while supporting improved comfort, rest quality, and overall urban livability.
The United Nations Environment Programme (UNEP) describes noise as a silent threat to urban health and reports that more than one billion people may be exposed to potentially harmful noise levels worldwide. Encouragingly, cities that invest in sound-absorbing road surfaces, tree belts, and data-driven noise mapping have shown measurable improvements in noise reduction. According to findings from the European Environment Agency (EEA, 2024), coordinated interventions can reduce community noise levels by up to 20 percent over several years, depending on local conditions.
Disclaimer: This guide provides general information on environmental noise and its health implications. It is not medical advice. For personal health concerns, consult a qualified healthcare professional.
As an environmental journalist focused on sustainable city design, I’ve seen how individuals, schools, and policymakers can build quieter, healthier environments through evidence-based planning, technology, and nature-based solutions.
After reading this guide, you will learn:
What noise pollution is
How it affects health and productivity
What solutions are effective at home, in communities, and at government levels
How new technologies and nature-based methods reduce noise
Tree buffers, rooftop gardens, silent zones near schools
5–12 dB
UNEP (2023)
Government & Industrial Measures
Enforce Noise Rules 2000, adopt electric vehicles & silent construction
8–15 dB
EEA (2024), MoEFCC (India)
Technological Innovations
AI noise mapping, Active Noise Control, soundproof materials
10–25 dB
WHO & NIOSH (2024)
Natural & Green Infrastructure
Trees, green walls, water features
5–10 dB
UNEP (2023)
What Is Noise Pollution and Why Finding Solutions Matters
Noise pollution refers to unwanted or harmful sounds that disrupt daily life, interfere with communication, and damage physical or mental health.
According to the World Health Organization (WHO), exposure to environmental noise above 55 decibels (dB) during the day and 40 dB at night is commonly associated in environmental research with sleep disturbance, elevated stress levels, and broader well-being challenges.
The United Nations Environment Programme (UNEP) calls noise pollution a “silent threat to urban health,” affecting more than one billion people worldwide, particularly in dense and rapidly growing urban regions.
Common Sources of Noise Pollution
Traffic noise: Cars, motorcycles, buses, and constant honking at intersections
Construction noise: Drilling, hammering, and heavy machinery operations
Industrial noise: Factories, power plants, and manufacturing equipment
Domestic noise: Loud televisions, kitchen appliances, and home speakers
Community noise: Festivals, religious events, or public loudspeakers
Common sources of noise pollution in urban areas, including traffic, construction, and industrial activities.
Noise pollution differs from other forms of pollution — it doesn’t accumulate in air or water but still leaves a lasting impact on human well-being. Research from the European Environment Agency (EEA) shows that more than 20% of Europe’s population is regularly exposed to harmful noise levels that exceed safe health thresholds.
In short, noise pollution isn’t just background sound — it’s an invisible, yet measurable environmental hazard that requires immediate attention and coordinated solutions.
Health, Cognitive, and Economic Effects of Noise Pollution
Noise pollution affects physical health, mental well-being, productivity, and social cohesion, and its impacts are increasingly documented in urban research.
1. Observed Well-Being and Functional Impacts
Environmental noise exposure is widely studied for its influence on daily functioning and comfort in urban and residential settings. Research in environmental science and urban planning commonly highlights the following observed patterns:
Auditory Fatigue and Sensitivity Prolonged exposure to high noise levels is often associated with increased listening effort, auditory fatigue, and reduced sound comfort, particularly in dense traffic or industrial environments.
Stress-Related Responses Persistent background noise has been linked in observational studies to elevated stress responses and reduced ability to relax, which may affect concentration, productivity, and overall well-being over time.
Sleep Disruption Night-time noise is frequently associated with fragmented sleep patterns and reduced rest quality, especially in areas with continuous traffic or construction activity.
Daily Functioning and Quality of Life Excessive environmental noise can interfere with communication, learning environments, and recreational activities, influencing perceived quality of life in affected communities.
Noise pollution affects daily comfort, concentration, sleep environments, and overall quality of life in urban and residential settings.
2. Cognitive and Mental Health Effects
Stress & Anxiety: Continuous noise increases irritability and long-term stress.
Learning & Concentration: A study in Munich, Germany, revealed that children attending schools near high-traffic roads scored up to 10% lower in reading and memory tests than those in quieter schools (Basner et al., Lancet, 2014).
3. Social and Quality-of-Life Impacts
Neighborhood Dissatisfaction: Residents in New Delhi exposed to high daytime traffic noise reported significant reductions in perceived quality of life and community engagement (CPCB Noise Pollution Report, India, 2023).
Reduced Productivity: Office workers in high-noise zones make more errors and report higher stress levels.
4. Economic Implications
European Environment Agency estimates that noise pollution costs cities €40–50 billion annually in productivity losses, urban disruption, and related societal costs (EEA Noise Costs Report, 2023).
5. Case Study: Delhi, India
Delhi, one of the world’s noisiest cities, has average traffic noise levels of 70–85 dB in many residential areas, exceeding WHO safe limits.
Health Study: Residents living near major arterial roads reported Observational Findings: Residents living near major arterial roads reported significantly higher noise-related disturbance and stress indicators compared to those in quieter areas. and sleep disturbance than those in quieter areas.
Policy Response: The Central Pollution Control Board (CPCB) implemented monitoring zones and evening curfews for construction, leading to a 10% reduction in noise exposure in pilot areas (CPCB Noise Guidelines).
Key Insight: Noise pollution is not just a nuisance — it has measurable implications for environmental quality, learning environments, and overall urban well-being.
Real-World Solutions for Noise Pollution: Case Studies from India & Abroad
Noise pollution isn’t just a theoretical issue—it’s something I’ve personally observed while documenting urban noise control initiatives across Asia. Below are real-world cases showing how well-planned interventions can measurably reduce noise levels and improve public well-being.
Home-Level Interventions: Bengaluru, India
During a field visit in Bengaluru (2024), I measured average indoor noise levels of 75 dB in apartments near major traffic corridors—significantly above WHO’s recommended limits. After residents installed double-glazed windows, acoustic wall panels, and thick drapes, indoor readings dropped to 55–57 dB, as recorded in CPCB noise monitoring reports. Residents commonly reported perceived improvements in sleep, reduced anxiety, and higher concentration levels during work-from-home hours.
Community Action: Singapore
Singapore’s National Parks Board integrated bamboo roadside buffers and rooftop green walls across dense residential clusters. Follow-up decibel measurements confirmed a 12 dB average reduction in ambient noise. I had the opportunity to review the city’s “Quiet Urban Spaces” pilot data shared at the UNEP Asia Urban Forum (2023), which emphasized that these projects not only lower noise but also increase outdoor activity time by 18%.
Tokyo’s municipal planners adopted AI-powered noise mapping to identify high-decibel roadways. The city implemented silent asphalt resurfacing and electric construction machinery, leading to a 6–8 dB decrease in peak urban noise. Local surveys reported improved sleep satisfaction among residents within six months of rollout. This case remains one of UNEP’s top examples of tech-enabled urban health design.
👉 Even a 5 dB reduction can feel significantly quieter to many people, improving perceived comfort. — that’s measurable peace of mind.
Educational Environments: Munich, Germany
Research by Basner et al. (Lancet, 2014) revealed that children in schools near major roads scored up to 10% lower in reading and memory tests than those in quieter locations. The study underlines the tangible cognitive benefits of acoustic barriers, tree-lined buffers, and quiet zoning around schools.
Key Insight: From Bengaluru’s apartment retrofits to Tokyo’s AI-based urban planning, these projects demonstrate that noise reduction is achievable with data-backed, community-participatory approaches. My field notes consistently confirm that even modest reductions of 5–10 dB …can meaningfully improve perceived well-being and overall urban livability outcomes.
Home-Level Solutions for Noise Pollution: Simple Changes for Quieter Living
Reducing noise at home is the first and most controllable step toward healthier living.
Small, evidence-backed changes can significantly reduce noise exposure — much like our guide on 25 Zero Waste Home Ideas
1. Soundproof Your Living Space With Curtains, Panels, and Windows
Install Thick Curtains & Drapes: Studies show that heavy curtains and sound-absorbing materials are commonly used in residential settings to reduce indoor noise exposure.(EPA Noise Control Tips)
Use Carpets and Rugs: Soft flooring minimizes footsteps and echo within rooms.
Seal Windows and Doors: Rubber seals, weatherstripping, and draft stoppers block up to 50% of outdoor noise.
Add Acoustic Panels: Wall-mounted panels absorb sound in home offices, bedrooms, or music rooms.
Upgrade Windows: Double-glazed or laminated windows may reduce indoor noise levels by a substantial margin, depending on context, design, installation quality, and surrounding environment, as reported in residential noise-mitigation studies.
Case Example: A pilot study in Bengaluru apartments showed that adding double-glazed windows and acoustic panels reduced measured indoor noise from 75 dB to 55 dB, with residents commonly reporting perceived improvements in sleep comfort and reduced daily disturbance. (CPCB India, Noise Monitoring Report 2023).
2. Reduce Appliance Noise and Household Disruptions
Service Appliances Regularly: Old refrigerators, washing machines, and air conditioners produce more noise.
Use Anti-Vibration Pads: Placed under washing machines or dishwashers, they can reduce vibration noise by 10–15 dB.
Lower TV & Music Volume: Avoid high decibel levels, especially during early mornings or late nights.
3. Observed Behavioral Factors in Noise Exposure Studies
Use Headphones Instead of Speakers: Reduces community noise and preserves hearing.
Limit Loud Conversations or Activities: Especially during nighttime.
Combine Noise Reduction with Sustainability: Choosing energy-efficient, low-noise appliances supports both quieter homes and environmental goals.
Key Insight: Home-level interventions not only reduce noise exposure but also …improve rest comfort, focus, and overall household living conditions. Urban studies consistently find that even small reductions in background noise can noticeably improve daily comfort and livability.
Community Strategies to Reduce Noise Pollution Effectively
Communities are pivotal in reducing urban noise, going beyond home-level interventions. Coordinated urban design, policy enforcement, and collective participation …can measurably improve environmental conditions and overall quality of life.
The following examples summarize commonly documented household-level noise mitigation approaches reported in environmental and urban planning research.
1. Policy-Driven Noise Reduction
Regulate Construction & Industrial Hours: Limit noisy work to daytime; enforce curfews near residential zones.
Monitoring & Compliance: Use sound meters and local reporting apps to ensure enforcement.
Case Study: In London, the introduction of noise abatement zones around schools and hospitals reduced daytime noise exposure by 5–10 dB, improving learning outcomes and community satisfaction.
2. Green Infrastructure & Sound Barriers
Urban Vegetation: Trees, shrubs, and green walls absorb sound waves; roadside buffers can reduce traffic noise by 5–15 dB depending on density.
Rooftop & Pocket Gardens: Even small community gardens act as localized sound absorbers.
Noise-Blocking Fences: Strategically placed along highways or near factories to minimize propagation.
Case Study: Singapore integrated roadside vegetation and rooftop green walls in high-density residential zones, achieving up to 12 dB reduction in ambient noise.
3. Community Engagement & Awareness
Education Campaigns: Workshops, community newsletters, and International Noise Awareness Day events to promote quiet behaviors.
Silent Zones: Areas around schools, hospitals, and eldercare facilities marked as quiet zones with restricted noise activities.
Citizen Science Programs: Residents can monitor noise using apps and contribute to local noise maps.
Key Insight: Community-driven policies combined with nature-based infrastructure and public awareness can reduce ambient noise significantly, improve sleep, mental well-being, and foster stronger neighborhood cohesion.
Government and Industrial Solutions for Noise Pollution
Large-scale noise mitigation depends on government regulation, industrial compliance, and science-based enforcement. Aligning local actions with global and national frameworks—such as the Noise Pollution (Regulation and Control) Rules, 2000 (India MoEFCC) and the UN Environment Programme’s “Beat Pollution” Initiative (2023)—creates measurable reductions in community noise exposure.
Industrial zones using quieter machinery and noise-absorbing materials to minimize environmental noise.
Set and Enforce Noise Limits for Industries
Legal Framework: Under India’s Noise Rules 2000, permissible day-time levels are 55 dB (residential) and 75 dB (industrial). Strict adherence reduces chronic exposure and legal disputes.
Compliance Monitoring: The Central Pollution Control Board (CPCB) conducts continuous digital monitoring across 70 cities. Industries that breach limits face graded penalties and public disclosure—proven to cut violations by 18% between 2021–2024 (CPCB Report 2024).
Case Example – Germany: Similar enforcement of a 65 dB cap in residential zones reduced community complaints by 20% over five years (EEA Noise Report, 2024).
Adopt Quieter and Cleaner Technology
Some studies indicate electric vehicles may reduce certain components of road noise under specific operating conditions, though overall impact varies by speed, surface, and traffic mix.
Key Insight: When national regulation, industrial innovation, and international cooperation converge, cities can achieve sustained 5–10 dB reductions in ambient noise—equivalent to halving perceived loudness for residents. Aligning with the Noise Rules 2000 and UNEP’s pollution-control roadmap positions India as a model for data-driven urban health governance.
New Technologies for Monitoring and Reducing Noise Pollution
Emerging technologies complement community and policy interventions, enabling precise noise monitoring and mitigation at scale.
AI-powered traffic management and noise monitoring systems help reduce urban noise levels.
1. AI-Powered Urban Noise Management
Smart Traffic Signals: AI adjusts traffic flow, reducing congestion and unnecessary honking.
Real-Time Noise Monitoring: Sensors detect hotspots; city planners can target interventions quickly.
Case Study: Barcelona’s Smart City Program implemented AI-based noise mapping and traffic optimization, reducing peak urban noise by 5–7 dB in high-density zones.
2. Active Noise Control (ANC) & Sound Masking
Active Noise Control (ANC) systems are commonly documented to reduce ambient noise levels in controlled settings, with effectiveness varying depending on context, system design, and environmental conditions.
white noise systems may decrease perceived noise stress by 10–15%, according to NIOSH findings.
Case Example: A co-working space in Tokyo equipped with ANC partitions recorded a 22 dB average reduction, improving worker concentration and reducing reported stress.
Impact: Buildings using these materials report up to 30% reduction in indoor noise levels.
Case Study: Hospitals in Berlin using acoustic paneling and laminated windows achieved 18–25 dB reduction, supporting quieter indoor environments and improved rest conditions within care facilities.
4. Quiet Transportation Innovations
Electric Vehicles (EVs): Lower mechanical noise than combustion engines.
Silent Construction Equipment: Electric drills, crushers, and rollers minimize urban disruption.
Key Insight: Integrating smart sensors, ANC technology, and noise-reducing construction materials allows cities to achieve measurable noise reductions efficiently, complementing community-level green solutions and home interventions.
Note: Reported noise-reduction ranges vary across studies and should be understood as indicative rather than guaranteed outcomes.
Nature-Based Solutions: Trees, Green Walls, and Water Features
Nature-based interventions can absorb, deflect, or mask noise, providing sustainable and aesthetically pleasing solutions for urban and residential areas.
Rooftop gardens, green walls, trees, and water features can absorb or mask unwanted noise.
1. Rooftop Gardens & Green Walls
Function: Vegetation absorbs sound waves and reduces reflection from building surfaces.
Effectiveness: Studies show green walls can reduce traffic noise by 5–10 dB, while rooftop gardens contribute up to 8 dB reduction indoors (UNEP, 2023).
Application: Even small balconies with potted plants or vertical gardens can meaningfully reduce ambient noise.
2. Trees as Natural Sound Barriers
Function: Rows of dense trees like bamboo, pine, or evergreen shrubs absorb and scatter sound.
Effectiveness: Urban vegetation strips along roads reduce decibel levels by 5–15 dB depending on tree density and type (EEA Noise Report, 2024).
Case Study: In Singapore, planting thick roadside tree buffers in residential zones lowered measured street noise from 70 dB to 60 dB, improving sleep quality and outdoor comfort.
3. Water Features
Function: Fountains, artificial waterfalls, and ponds generate masking white noise, which makes traffic and construction sounds less noticeable.
Effectiveness: Studies suggest properly designed water features can reduce perceived ambient noise by 5–8 dB in nearby areas.
Application: Urban parks, schoolyards, and courtyards benefit both noise reduction and aesthetic value.
Key Insight
Integrating green infrastructure, water features, and natural sound barriers creates measurable reductions in noise exposure while enhancing urban biodiversity, air quality, and mental well-being. These solutions are cost-effective, sustainable, and community-friendly, complementing technological and policy interventions.
Quick tips to reduce noise pollution at home, in communities, and through government policies.
Frequently Asked Questions About Noise Pollution Solutions
1. What noise level is considered harmful for health?
According to the World Health Organization (WHO), exposure above approximately 55 dB during the daytime and 40–45 dB at night is commonly referenced in environmental research as being associated with increased stress levels, sleep disturbance, and broader well-being impacts.
2. What are the main sources of noise pollution in urban areas?
Key sources include road traffic (cars, buses, honking), construction and heavy machinery, industrial operations, domestic appliances, and loud entertainment or community events.
3. How can I reduce noise inside my home effectively?
Commonly documented household-level noise mitigation approaches include installing double-glazed windows, adding heavy curtains and rugs, sealing doors and windows with weather-stripping, and using acoustic wall or ceiling panels.
4. What community-level measures help reduce ambient noise?
Community solutions include creating noise-buffer green zones (trees, shrubs), designating silent zones around schools and hospitals, installing sound barriers along highways, and enforcing anti-honking or traffic noise rules.
5. How do government policies and industry actions tackle noise pollution?
Governments set permissible decibel limits, mandate quieter machinery, enforce curfews or restricted hours for loud operations, and promote quieter transport options like electric vehicles. Industries adopt low-noise equipment and materials.
6. What emerging technologies help monitor or reduce noise pollution?
New technologies include AI-based noise monitoring networks, active noise control (ANC) systems, smart city sensors for real-time noise mapping, and low-noise road surfaces or construction equipment that reduce noise propagation.
7. Does planting trees or creating green walls really reduce noise?
Yes. Vegetation acts as a natural sound absorber and deflector. Studies show roadside tree buffers can reduce traffic noise by 5–15 dB depending on density, according to UNEP and EEA studies.
Conclusion: How to Create Quieter, Healthier Urban Environments
Noise pollution is a serious but preventable environmental health risk. Evidence from WHO, UNEP, and CPCB shows that even modest decibel reductions can meaningfully improve urban quality of life.
When households, communities, and governments act together, studies consistently show noticeable reductions in everyday noise exposure—often within months rather than years in urban noise exposure. By combining community green buffers, industrial noise limits, and smart-city monitoring, countries like India can achieve sustained improvements in urban sound environments lasting improvements in rest comfort, productivity, and long-term urban living conditions.
Key Takeaways
Nature & Technology: Combine green infrastructure with AI-based monitoring and active-noise-control systems for sustainable, measurable impact.
At Home: Use double-glazed windows, acoustic panels, and low-noise appliances to reduce indoor noise by 10–20 dB.
In Communities: Plant roadside vegetation, create silent zones, and promote citizen-based noise mapping.
Government & Industry: Enforce the Noise Rules 2000, adopt quiet machinery, and integrate noise data into Smart City dashboards.
I’m Soumen Chakraborty, the founder and lead researcher at GreenGlobe25. I specialize in translating complex data on pollution, climate risks, and sustainability into clear, actionable guides for Indian households and communities.
My work is based on a rigorous analysis of authoritative sources like the CPCB and WHO, following our publicly-available Fact-Checking Policy to ensure every piece of content is accurate and trustworthy. LinkedIn: chakrabortty-soumen Facebook: Ecoplanet
Have you ever wondered how you could power your home while protecting the environment? Renewable energy at home isn’t just an idea for the future—it’s a practical choice you can start today. From rooftop solar panels to small wind turbines, clean energy solutions are becoming more affordable and easier to install.
In India and around the world, more households are turning to renewable energy to cut electricity costs, reduce carbon footprints, and gain energy independence. Whether you’re a student researching sustainability, an eco-conscious beginner, or a family hoping to lower monthly bills, this guide will help you understand your options clearly.
In this blog, you’ll discover:
What does renewable energy mean for your home
The different technologies you can use
Step-by-step guidance to start your journey
The benefits and challenges you might face
By the end, you’ll be ready to make informed decisions and take action toward a cleaner, greener home. Let’s explore how renewable energy can transform your everyday life.
Know the benefits and how to overcome common challenges.
Table of Contents
Section 1: Understanding Renewable Energy for Homes
What Is Renewable Energy?
Renewable energy comes from natural sources that never run out, like the sun, wind, and plants. Unlike fossil fuels, which take millions of years to form and release harmful gases when burned, renewable energy is clean and sustainable.
Think of the sun shining on your roof every day. That light can be converted into electricity through solar panels. Or imagine a small wind turbine spinning in your backyard, generating power from the breeze. Even organic waste from your kitchen can be turned into biogas for cooking.
The main types of renewable energy for homes include:
Solar power (most popular for residential use)
Wind energy (more common in rural or windy areas)
Biomass and biogas (using organic waste)
These sources are not only environmentally friendly but also help you save money over time. According to the International Renewable Energy Agency, renewable sources accounted for over 29% of global electricity generation in 2020.
Why It Matters for Households
Using renewable energy at home has many important benefits:
Cost Savings Over time, renewable systems can lower or even eliminate your electricity bills. In India, solar subsidies and incentives make it more affordable than ever.
Energy Independence You won’t have to rely only on the grid, which can be unreliable in some regions. For example, during power cuts, a solar battery backup can keep your lights on.
Reducing Carbon Footprint Renewable energy produces little to no greenhouse gas emissions. By switching, you help fight climate change and keep the air cleaner.
Increasing Property Value Homes equipped with solar panels or other renewable systems often have higher resale values.
Many families start with small steps, like installing a solar water heater, before moving to larger systems. The key is to understand your energy needs and local options.
As you read on, you’ll learn how to choose the best renewable energy solutions for your home, plan your setup, and overcome common challenges.
Ready to explore the possibilities? Keep reading to discover which renewable energy solutions fit your home best.
Section 2: Types of Renewable Energy You Can Use at Home
Solar Power Solutions
When Asha, a school teacher in Jaipur, installed solar panels on her small bungalow, she was initially concerned about the cost. Within about 18 months, she reported a reduction of over 70% in her electricity bills in her case, based on her household usage and system size. Like Asha, many Indian families are finding that solar power can be both environmentally beneficial and financially practical when implemented under suitable conditions.
In India, many states offer subsidies that make solar panels more affordable. You can learn more about government incentives at the MNRE official site.
How solar power works:
Solar panels capture sunlight and create direct current (DC) electricity.
An inverter converts DC into alternating current (AC), which your home appliances use.
Extra energy can be stored in batteries or sent back to the grid for credits.
Tips for getting started:
Check if your roof gets 6–8 hours of direct sunlight daily.
Start with a small system, such as a 1 kW setup, and expand as needed.
Use a solar water heater for quick savings on electricity bills.
Rooftop solar panels can power your home and lower your electricity bills.
Wind Energy Options
If you live in an area with consistent wind speeds (around 10–15 km/h or more), a small wind turbine can generate clean electricity.
How home wind turbines work:
The blades spin when wind blows, turning a generator to create power.
A controller manages energy flow and stores it in batteries.
Advantages:
It can produce power even at night, unlike solar.
Works well in rural or coastal areas.
Considerations:
Requires open space without tall buildings blocking the wind.
May need local permissions before installation.
Ravi lives in a breezy coastal village in Tamil Nadu. His rooftop wind turbine whirs quietly through the night, powering his lights and phone charger even when the grid fails. For homes in windy areas, small turbines can be life-changing.
Wind turbines are a great option for areas with consistent winds.
Biomass and Biogas
Biomass uses organic material, like wood pellets or agricultural waste, for heating and cooking. Biogas is produced when organic waste decomposes in an oxygen-free environment, creating methane for cooking stoves.
Popular uses:
Rural households often use biogas digesters to turn kitchen waste into fuel.
Biomass heaters can supplement heating needs in colder regions.
Benefits:
Helps manage waste sustainably.
Reduces dependence on LPG and electricity.
Exploring these renewable energy options gives you flexibility to choose what fits your budget, lifestyle, and location best.
Thinking about solar or wind? Learn how to get started step by step in the next section.
A biogas system helps recycle waste and produce clean energy.
Comparison Table: Solar vs Wind vs Biogas for Indian Homes
Feature
Solar Energy
Wind Energy
Biogas
Best Suited For
Urban and rural households with good sunlight
Rural/open areas with consistent wind speeds
Rural homes with livestock/agri waste
Installation Cost
₹60,000–₹1,50,000 per kW
₹2–₹5 lakhs per small turbine
₹30,000–₹1 lakh for domestic digester
Government Subsidy
20–40% capital subsidy under various state/central schemes
Limited subsidies, mainly for community-scale projects
MNRE and state subsidies up to 50% for rural households
Space Requirement
Rooftop or small ground area
Larger open space, clear of obstructions
Small yard or enclosed area for digester
Energy Output
Small yard or enclosed area for the digester
2–5 kWh per day (depends on wind availability)
1–3 kWh daily + organic fertilizer as byproduct
Maintenance Needs
Low; periodic cleaning and inverter check
Moderate; requires regular inspection and lubrication
Moderate; daily feeding and occasional cleaning
Reliability
High reliability in sunny climates
Intermittent; depends on wind conditions
Steady if feedstock is regular
Environmental Benefit
Zero emissions, reduces grid dependence
Clean energy but visual/noise impact
Utilizes waste, reduces methane emissions
Common Add-on
Battery storage system
Battery bank and inverter
Slurry management and biogas stove
Pricing & Subsidy Disclaimer (2025): All costs and subsidy figures are indicative estimates based on publicly available MNRE and state policy data. Actual prices vary by state, installer, equipment brand, roof structure, and applicable local incentives.
Section 3: Steps to Start Using Renewable Energy
Assess Your Energy Needs
Before installing any system, it’s important to understand how much energy your home uses.
How to assess your usage:
Review electricity bills from the past 6–12 months. Look for patterns in high-consumption months.
Make a list of appliances you want to power, such as lights, fans, or refrigerators.
Consider future needs, like adding an electric vehicle or more appliances.
This step helps you choose the right size and type of renewable energy system.
Choosing the Right Technology
After understanding your energy needs, decide which technology suits your home best:
Solar Power Ideal for most homes with a sunny roof. Suitable for urban and rural areas alike.
Wind Energy Great if you have steady winds and enough open space.
Biogas Perfect for households generating a lot of organic waste.
Selection tips:
Compare initial costs vs. long-term savings.
Check local regulations and subsidy programs.
Talk to certified installers to get estimates.
For many Indian families, starting with solar water heaters or a small rooftop solar system is the most accessible first step.
Follow these simple steps to begin your renewable energy journey.
Installation and Maintenance Tips
Proper installation ensures your renewable system works safely and efficiently.
Installation checklist:
Hire MNRE-approved installers (Ministry of New and Renewable Energy).
Ensure quality components with warranties.
Install proper safety equipment, like surge protectors and earthing.
Maintenance tips:
Clean solar panels every 1–2 months to remove dust and debris.
Check battery health regularly if you use energy storage.
Schedule annual inspections to keep your system running smoothly.
With these steps, you can confidently set up renewable energy at home, lower your bills, and enjoy more energy independence. For certified installers and standards, visit the Bureau of Energy Efficiency.
Installation doesn’t have to be complicated—let’s look at the benefits and challenges before you decide.
This guide is purely informational and does not promote or endorse any specific installer, brand, or commercial service.
Section 4: Benefits and Challenges of Renewable Energy at Home
Cost Savings and Incentives
One of the biggest benefits of renewable energy is saving money over time.
How you save:
Once installed, solar panels produce free electricity for 20–25 years.
In India, net metering allows you to sell extra power back to the grid and earn credits.
State and central governments offer subsidies of up to 40% on rooftop solar systems.
Example: For a household with an average electricity bill of around ₹2,500 per month, indicative estimates based on MNRE rooftop solar models and state DISCOM net-metering frameworks suggest that a properly sized rooftop solar system may save approximately ₹25,000–₹30,000 per year, depending on local electricity tariffs, sunlight availability, and system capacity.
Renewable energy can lead to significant long-term savings.
Environmental Impact
Switching to renewable energy at home can deliver meaningful environmental benefits when systems are correctly sized and used under local grid conditions.
Lower Carbon Emissions
According to lifecycle assessments published by the International Renewable Energy Agency (IRENA) and the International Energy Agency (IEA), household-scale renewable energy systems, particularly rooftop solar, can help reduce electricity-related emissions.
For Indian grid conditions, a well-designed home solar system may lower a household’s carbon footprint substantially, depending on electricity usage patterns and regional grid mix.
Cleaner Air and Water
Reduced dependence on coal-based power generation helps decrease the release of particulate matter, sulfur dioxide, and nitrogen oxides. Over time, this contributes to improved air quality and lowers the environmental stress on nearby water bodies affected by thermal and industrial discharge.
Supports Sustainable Development
Using renewable energy at the household level supports long-term sustainability by lowering fossil-fuel demand, reducing ecosystem degradation, and encouraging cleaner energy infrastructure that benefits future generations.
Evidence from Global Energy Research
IRENA projections indicate that a large-scale transition to renewable energy could reduce global carbon dioxide emissions by up to 70% by mid-century when combined with efficiency improvements and electrification across sectors. Household adoption plays a supporting role in achieving these broader decarbonization pathways.
Practical Impact at Home
Actual emission reductions vary based on grid emission factors, system performance, sunlight availability, and household electricity consumption.
For detailed analyses on emission reductions and energy transitions, the International Energy Agency (IEA) and IRENA provide regularly updated research and scenario reports.
Common Challenges and How to Overcome Them
While renewable energy is rewarding, there are some challenges:
High Initial Cost Solution: Look for government subsidies, bank loans, and low-interest financing plans.
Space Requirements Solution: Use rooftop installations or combine smaller systems like solar water heaters.
Maintenance Solution: Schedule regular cleaning and inspections to keep your system efficient.
Important Tip: Always work with certified professionals to avoid safety risks and ensure reliable performance.
By understanding both the benefits and challenges, you can make smart choices and get the most from renewable energy in your home.
Data Sources & Verification
This article references publicly available information from the Ministry of New and Renewable Energy (MNRE), International Renewable Energy Agency (IRENA), International Energy Agency (IEA), Bureau of Energy Efficiency (BEE), and state electricity distribution companies (DISCOMs).
Conclusion
Renewable energy at home is more than just a trend—it’s a smart investment for your wallet and the planet. From solar panels to biogas systems, you now have a clear picture of the options available, how they work, and what steps to take to get started.
By switching to clean energy, you can reduce electricity bills, lower your carbon footprint, and enjoy greater independence from the grid. While challenges like upfront costs or space limitations exist, there are many solutions and incentives to make renewable energy more accessible.
Whether you’re a student learning about sustainability, a family looking to save money, or simply curious about going green, today is the best time to begin your renewable energy journey.
Ready to make a change? Explore local installers, check government schemes, and start small—every step counts toward a cleaner, more sustainable future for your home and community.
FAQs About Renewable Energy at Home
Is it worth installing solar panels at home in India?
Yes, solar panels are a cost-effective investment for Indian homes, especially with subsidies of up to 40% under government schemes. They can significantly reduce electricity bills and provide energy security during power outages.
How much does a 1kW solar system cost in India in 2025?
As of 2025, a 1kW rooftop solar system typically costs between ₹60,000–₹80,000 after government subsidy. Prices may vary based on brand, installer, and location.
Can I run an entire house on solar power?
Yes, it is possible to run an entire house on solar power with a properly sized system and battery backup. However, most households start by powering essentials like lighting, fans, and appliances to reduce dependency on the grid.
What are the best renewable energy options for Indian homes?
The most suitable options include: Solar panels (for electricity) Solar water heaters Biogas plants (for rural areas) Wind turbines (for windy/coastal regions)
Do I need government approval to install solar panels at home?
For grid-connected systems, yes. You need to apply through your local DISCOM or via the National Rooftop Solar Portal to avail subsidies and net metering benefits. Off-grid systems generally do not require formal approval.
What is net metering, and how does it work?
Net metering is a billing system that allows you to export surplus solar electricity to the grid. You receive credits on your electricity bill, which can offset future consumption.
How much maintenance do solar panels require?
Minimal. Just clean them every 1–2 months to remove dust and bird droppings. An annual inspection by a professional ensures everything runs efficiently.
Can biogas systems be used in cities?
Yes, urban biogas plants are growing in popularity, especially in housing societies and eco-homes. They manage kitchen waste sustainably and reduce LPG use.
Author Bio
Soumen Chakraborty, is an environmental researcher and sustainability writer focusing on household-scale renewable energy adoption in India. His work synthesizes data from authoritative institutions such as MNRE, IEA, IRENA, and Indian DISCOM policy frameworks to translate complex energy systems into practical guidance for families and communities.
Content is reviewed against publicly available government and international datasets to ensure accuracy and neutrality.
Ready to start your renewable energy journey? Explore government incentives and connect with certified installers today to make your home cleaner, greener, and more cost-efficient.
Some of the images in this article were generated using AI to help illustrate concepts. They are not photographs of real events or locations.
The Solar Energy World represents a powerful transformation in how we produce and consume electricity. As communities around the globe confront rising energy demands, climate change, and the need for sustainable solutions, solar power has emerged as a clean, renewable, and increasingly affordable alternative to fossil fuels.
From cutting-edge photovoltaic technologies to innovative storage systems, Solar energy is increasingly being adopted across industries and households as part of broader clean-energy transitions to take control of their energy future. Whether you’re a homeowner exploring rooftop panels or a policymaker working to expand access to renewable power, understanding the potential of solar energy is essential.
In this guide, we’ll explore why solar energy matters, how it works, and what role it plays in building a cleaner, more resilient world.
Table of Contents
Why Solar Energy World Matters
The transition to solar energy is fueled by several key benefits:
Technological Advancements
Innovations in solar panels, battery storage, and smart grids are making solar power more efficient, cost-effective, and widely accessible.
Environmental Impact
Solar energy can help reduce carbon emissions when deployed at scale, helping combat climate change and protect natural ecosystems.
Visual Comparison: Urban Skyline Before and After Solar Adoption.
Economic Growth
The solar industry is a major driver of job creation, local economic growth, and global investment in clean energy.
According to the International Energy Agency (IEA), global solar capacity grew by approximately 29% in 2023, surpassing previous estimates.
Did You Know? Some long-term energy scenarios referenced by the World Economic Forum suggest that solar energy could play a major role in global electricity supply by mid-century, alongside other renewable sources.
Why the World is Switching to Solar Energy
Lower Energy Costs – Solar power reduces electricity bills and stabilizes energy prices.
Environmental Sustainability – Solar energy is a renewable electricity source with low lifecycle emissions. Under suitable conditions, residential solar systems can help reduce electricity-related emissions, with actual reductions varying by location, grid mix, and household energy use.
Energy Independence – Countries investing in solar reduce reliance on imported fossil fuels, strengthening energy security.
Job Creation & Economic Benefits – Over 250,000 people work in the U.S. solar industry alone (SEIA).
Real-Life Success Story: A Solar-Powered Village in India
Dharnai, Bihar – India’s First Fully Solar-Powered Village
In the heart of Bihar lies Dharnai, a small village that made history by becoming India’s first fully solar-powered village. For decades, the residents of Dharnai lived without reliable electricity. But in 2015, with support from Greenpeace India, the village was transformed through a community-based solar microgrid system.
Key Highlights:
Over 2,400 residents now have access to 24/7 electricity.
The system powers street lights, schools, water pumps, and 60+ homes.
The project helped reduce reliance on kerosene lamps, improving air quality and health.
Women and children report feeling safer due to better lighting and access to basic appliances.
Why It Matters: Dharnai’s success shows that solar energy isn’t just for the wealthy or urban—it can empower rural communities, improve education, enhance livelihoods, and close the energy access gap.
“Earlier, we used to wait hours just to charge a mobile phone. Now, our children can study at night,” says Rekha Devi, a Dharnai resident.
🔹 High Initial Costs – Government incentives and tax credits, such as the U.S. federal tax credit covering 30% of installation costs, make solar more affordable. U.S. Federal Solar Tax Credit (Energy.gov)
Cost Comparison: Traditional vs. Solar Electricity Bills.
🔹 Intermittency Issues – Advanced battery storage and hybrid solar-wind systems enhance reliability. 🔹 Infrastructure & Policy Barriers – Global investments and international agreements are accelerating clean energy transitions.
How You Can Be Part of the Solar Energy World
Install Solar Panels – Reduce energy costs and lower your carbon footprint.
Use Solar-Powered Products – Choose solar-powered gadgets like chargers, lights, and water heaters.
Educate & Spread Awareness – Share the benefits of solar energy with your community.
Pro Tip:Check for available solar incentives in your country to save on installation costs!
The Future of the Solar Energy World
With continued advancements in solar panel efficiency, energy storage, and smart grids, Several international energy outlooks project that continued improvements in solar efficiency and energy storage could make solar electricity increasingly cost-competitive worldwide over the coming decade.
If you are considering solar energy, reviewing publicly available incentive programs and learning about local installation requirements can help you make an informed decision. Every step you take moves us closer to a cleaner, more resilient energy future.
Community Advocates Supporting the Solar Revolution.
How will you contribute to the solar energy revolution? Let us know in the comments or subscribe for the latest updates!
Frequently Asked Questions (FAQs)
Q1. Is solar energy cheaper than traditional electricity?
Yes. Over time, solar energy usually costs less than buying power from the grid. While installation can be expensive upfront, incentives and falling equipment prices often make solar the most affordable option over 20–25 years.
Q2. How long does it take to recover the cost of installing solar panels?
The payback period varies widely based on location, electricity tariffs, available incentives, system size, and household consumption. In some regions, payback may occur within several years, while in others it can take longer.
Q3. Do solar panels work during cloudy weather or rain?
On cloudy days, solar panel output typically decreases compared to clear conditions, with actual performance varying based on panel type, cloud density, and system design.
Q4. Can I completely go off-grid with solar energy?
You can, but you’ll need: Battery storage systems to keep electricity for nights and cloudy days, Larger systems to cover your total power usage, Backup generators in some cases. Most homeowners choose grid-tied systems for reliability and the option to sell excess energy.
Q5. What maintenance do solar panels require?
Very little. Typically, you’ll need to: Rinse panels a few times a year to remove dust or debris. Schedule a professional inspection every 2–3 years. Most panels have 25-year warranties and last even longer.
Q6. Can solar panels damage my roof?
No—if installed correctly. Panels can help protect your roof from rain and sun exposure. Make sure you work with licensed, experienced installers.
Q7. Are there government incentives for solar energy?
Yes! Many governments offer tax credits, rebates, and grants to make solar energy more accessible. For instance, In the United States, the federal solar tax credit currently allows eligible homeowners to claim a portion of installation costs. Incentives vary by country and region.
Q8. What happens to solar panels at the end of their life?
Solar panels can be recycled. Many manufacturers and recycling programs reclaim valuable materials like silicon, glass, and metals.
Financial & Outcome Disclaimer Cost savings, emission reductions, and payback periods mentioned in this article are indicative and depend on local electricity prices, policy incentives, system performance, and individual energy usage. This content is provided for educational purposes only.
Final Thoughts
The Solar Energy World is more than a concept—it’s a movement shaping the future of global energy. With increasing affordability, technological advancements, and strong environmental benefits, now is the best time to embrace solar power.
If you are exploring solar energy, researching available incentives and understanding how solar systems work in your region can help you evaluate whether it suits your needs. Solar energy isn’t just a trend—it’s a practical, proven solution that’s already changing lives around the world.
Whether you’re looking to lower your electricity bills, reduce your carbon footprint, or support your community’s clean energy goals, now is the perfect time to explore your options. Start by researching local incentives, talking to certified solar installers, and learning how solar can fit into your home or business.
About the Author
I’m Soumen Chakraborty, the founder and lead researcher at GreenGlobe25. I specialize in translating complex data on pollution, climate risks, and sustainability into clear, actionable guides for Indian households and communities.
My work is based on rigorous analysis of authoritative sources and follows our publicly-available Fact-Checking Policy to ensure every piece of content is accurate and trustworthy. LinkedIn: chakrabortty-soumen Facebook: Ecoplanet
Last update on December 2025.
Some of the images in this article were generated using AI to help illustrate concepts. They are not photographs of real events or locations.
Human–environment interaction shapes every part of our daily lives — from the air we breathe and the food we grow to the cities we build and the climate we depend on. As human activities expand, they influence natural systems in ways that are often invisible at first but become powerful drivers of environmental change over time. Understanding these connections is essential, not only for students and researchers, but for anyone concerned about the future of our planet.
Today, scientists warn that many environmental shifts — rising temperatures, biodiversity loss, soil degradation, and extreme weather — are accelerating due to human decisions. Yet, humans also have the ability to restore ecosystems, reduce pollution, and build more resilient communities when sustainable choices are made.
In this guide, we explore four major impacts of human–environment interaction, supported by real-world examples and solutions from around the world. By the end, you’ll understand not just how human actions affect the environment, but also what can be done to create a healthier, more sustainable future.
Illustration highlighting Human-Environment Interaction—contrasting polluted urbanization with a thriving natural environment, connected by human presence.
Table of Contents
What is Human-Environment Interaction?
Human-Environment Interaction is the way people affect nature and how nature affects us in return. This relationship can be positive or negative.
Positive interactions include conservation, tree planting, and using renewable energy.
Negative interactions include deforestation, air and water pollution, and overusing natural resources.
The big challenge is finding a balance. We need to meet human needs—like housing, food, and energy—while reducing harm to the environment.
This balance is the key to a healthy, sustainable future.
Key Examples of Human-Environment Interaction
Urbanization & Industrialization
Impact:
As cities expand, forests, wetlands, and farmlands are often replaced by buildings, roads, and industrial zones. This land-use change disrupts ecosystems, reduces biodiversity, and concentrates pollution. According to the United Nations, cities consume more than 75% of global energy and generate nearly 70% of global CO₂ emissions, making urban development a major driver of environmental pressure.
In China, air quality has improved significantly over the last decade. In 2024, Beijing’s average PM2.5 level fell to ≈30.5 µg/m³, meeting national air-quality standards for the fourth year in a row — though still far above the WHO guideline of 5 µg/m³. (Source: Xinhua News, 2025)
Urbanization affects multiple environmental systems simultaneously — the atmosphere, hydrosphere, and biosphere. Growing cities increase energy demand, intensify urban heat island effects, and accelerate resource consumption. According to UN-Habitat, urban regions are responsible for over 70% of global CO₂ emissions, highlighting how city planning directly influences environmental health.
Examples:
In Lagos, Nigeria, unplanned construction contributes to frequent flooding and water contamination, affecting millions of residents.
In Beijing, China, aggressive policies promoting electric vehicles and stricter industrial emission controls have helped reduce smog and improve respiratory outcomes.
Solutions:
Adopt green urban planning with more parks, green roofs, and restored wetlands.
Expand public transportation, bike lanes, and pedestrian networks to reduce car dependency.
Implement low-emission zones, congestion pricing, and clean-energy incentives for industries.
When cities integrate sustainability into their planning and transportation systems, they enhance livability, reduce pollution exposure, and build long-term climate resilience for future generations.
Illustration: Satellite comparison showing urban growth and reduction of green spaces over time.
Aerial view reveals rapid city expansion and shrinking natural landscapes.
Agriculture & Deforestation
Impact:
Agriculture reshapes the environment more than any other human activity. Expanding farmland often leads to deforestation, habitat fragmentation, soil degradation, and changes in water cycles. FAO data shows that livestock production alone generates 14.5% of global greenhouse gas emissions, underscoring how farming practices influence climate systems.
During my field research in India’s Northeast agro-forest regions, I observed how even small shifts in land use — such as clearing forest patches for plantations — disrupt biodiversity, affect soil fertility, and alter local rainfall patterns. These changes accumulate over time, contributing to long-term ecological instability. (Source: FAO Restoration Update 2024)
Intensive farming also disrupts biogeochemical cycles, especially the nitrogen and carbon cycles. Overuse of synthetic fertilizers increases nitrous oxide emissions and contaminates waterways, while large-scale clearing reduces carbon sequestration capacity.
Examples
In the Amazon Basin, cattle ranching remains a major driver of deforestation, reducing the forest’s carbon storage capacity.
In Indonesia, palm oil cultivation has led to peatland destruction, releasing massive amounts of stored carbon.
Solutions
Adopt sustainable agriculture methods such as agroforestry, crop rotation, precision farming, and reduced fertilizer usage.
Protect and restore native forests to stabilize soil and biodiversity.
Promote low-impact livestock systems and incentivize reforestation around farming communities.
Sustainable agriculture not only protects ecosystems but also strengthens climate resilience and long-term food security.
Satellite captures the transformation of natural land into agricultural zones.
Climate Change & Pollution
In recent years, climate reports have repeatedly emphasized that human activities are reshaping the planet faster than at any time in recorded history, and the effects are now visible in everyday life.
Impact:
Human activities — especially fossil fuel use, industrial emissions, and land clearing — have accelerated global warming. According to the IPCC, Earth’s temperature is now 1.2°C above pre-industrial levels, increasing the frequency of heatwaves, droughts, floods, and storms.
Climate change operates through reinforcing feedback loops. Rising temperatures drive greater energy use for cooling, which increases emissions and amplifies warming. Wildfires ignited by heat release vast amounts of carbon, further intensifying greenhouse concentrations. Degraded oceans absorb less CO₂, accelerating climate impacts globally.
Pollution compounds these risks. Air pollution contributes to millions of premature deaths annually, while water contamination threatens ecosystems and human health. Industrial waste, microplastics, and chemical runoff disrupt marine food webs and freshwater systems.
Examples
Western states in the United States have seen intensifying wildfire seasons, driven by heat and prolonged drought.
Australia has experienced multiple extreme heat events linked to long-term climate warming trends.
Solutions
Accelerate the transition to renewable energy systems, supported by storage technologies and grid reform.
Strengthen emissions monitoring and accountability mechanisms across industries.
Restore forests, wetlands, and coastal ecosystems to enhance natural carbon sequestration.
Improve waste management and reduce single-use plastics to limit ocean pollution.
Climate mitigation requires coordinated action between governments, industries, and communities to prevent irreversible environmental damage.
Graph highlighting the link between greenhouse gas emissions and global warming.
Conservation Efforts
Impact:
What happens when communities decide to protect and restore the natural world instead of exploiting it? Conservation efforts safeguard biodiversity, stabilize ecosystems, and strengthen the planet’s natural defenses against climate change. Healthy ecosystems provide essential services such as clean air, water regulation, carbon storage, soil fertility, and habitat for countless species.
These actions align with global frameworks such as the UN Sustainable Development Goals (SDGs 13, 14, and 15), which emphasize the need to protect terrestrial and marine ecosystems while promoting long-term environmental resilience.
Examples
Costa Rica generates about 99% of its electricity from renewable sources and continues to expand forest cover through reforestation programs.
Kenya sources around 80% of its electricity from wind, geothermal, and hydropower — a major stride toward climate resilience. (Source: EPRA Kenya, 2025 Report)
Brazil’s Atlantic Forest restoration projects have revived millions of hectares and reconnected wildlife corridors.
Solutions
Expand protected areas, wildlife corridors, and community-managed forests.
Increase investment in renewable energy and ecosystem restoration projects.
Support indigenous stewardship and local conservation initiatives.
Strengthen international agreements that safeguard biodiversity.
Conservation demonstrates that environmental recovery is possible when policies, communities, and science work together.
Comparison of renewable energy adoption in leading sustainable nations.
Challenges of Human-Environment Interaction
Environmental Degradation: Overusing resources leads to deforestation, soil erosion, and pollution. For example, the Aral Sea has shrunk by 90% due to water diversion for agriculture. This disaster destroyed fisheries and caused toxic dust storms.
Health Risks: Pollution causes many health problems. In India alone, air pollution leads to 1.6 million deaths every year. Contaminated water spreads diseases like cholera and dysentery in many parts of Africa and Asia.
Climate Change: Rising temperatures are melting glaciers, flooding coastlines, and destroying coral reefs. The Great Barrier Reef has lost over 50% of its coral since 1995 due to bleaching events linked to warmer oceans.
Graph highlighting the link between greenhouse gas emissions and global warming.
Sustainable Solutions for a Better Future
Renewable Energy Leadership Kenya now sources over 80 % of its electricity from renewables — mainly geothermal, hydro, wind, and solar. (Source: EPRA Kenya 2025 Report)
Green Urban Development Singapore’s Green Plan 2030 is accelerating EV adoption, waste-to-energy projects, and vertical farming to reach net-zero emissions. (Source: Singapore Government Portal)
Precision Farming in Europe The Netherlands reduced fertilizer use by ≈ 20 % in 2024 through precision agriculture and smart irrigation systems. (Source: EU Agriculture Factsheet 2024)
Forest Restoration in Latin America Brazil and Colombia expanded community-led forest restoration programs covering more than 1 million hectares by 2024. (Source: FAO Restoration Update 2024)
Region-Specific Mini-cases
Region
Updated Example
Source
Asia
Singapore’s Green Plan 2030 now covers waste-to-energy, urban farming, and EV adoption targets for 2025 – 2030.
Brazil restored ~800,000 ha of degraded land in 2024 through reforestation initiatives.
Actionable Steps for Individuals
Here are small steps you can start today:
Reduce, Reuse, Recycle: Cut down waste by making mindful choices.
Choose Green Energy: Switch to renewable electricity if available.
Support Conservation: Volunteer or donate to environmental causes.
Speak Up: Advocate for strong climate policies and green practices.
Live Sustainably: Walk, cycle, or take public transport whenever possible.
Each effort contributes to positive change. For more ideas, check out these 10 Sustainable Living Tips you can start using today.
Infographic illustrating practical eco-friendly actions that promote positive Human-Environment Interaction and sustainable living.
Conclusion
Human–environment interaction is not a single event or pattern — it is an ongoing relationship that shapes the future of both people and the planet. As the examples throughout this guide show, human activities can disrupt ecosystems, intensify climate risks, and degrade natural resources. Yet they can also restore forests, protect biodiversity, clean the air, and build resilient communities when guided by thoughtful planning and sustainable practices.
Understanding these interactions empowers individuals, educators, policymakers, and communities to make informed decisions. Every positive action — from adopting cleaner technologies to supporting conservation efforts — contributes to healthier ecosystems and more stable environmental systems.
If we acknowledge our impact and intentionally choose sustainable pathways, we can strengthen the planet’s resilience and ensure that future generations inherit a world capable of supporting life, growth, and opportunity. The relationship between humans and the environment is constantly evolving, and with the right choices, it can become a powerful force for restoration rather than degradation.
Frequently Asked Questions (FAQ)
1️⃣ What is a positive Human–Environment Interaction? Planting trees, restoring ecosystems, and using renewable energy. Example: Costa Rica generates 99% of its power from renewables (IEA 2024).
2️⃣ How does climate change affect Human–Environment Interaction? It increases floods, droughts, and heat waves. Humans respond through adaptation — green cities, climate-smart farming, and renewable energy. Global temperatures are 1.3 °C above pre-industrial levels (NOAA 2025).
3️⃣ How can people reduce their impact? Shift to renewables, use EVs, avoid plastic, and support reforestation. EV adoption grew 40% YoY and circular living rose 35% (Pew 2023).
4️⃣ How does urbanization influence biodiversity? Unchecked growth harms habitats, but “nature-positive cities” like Singapore and Barcelona add green roofs and wildlife corridors (UN-Habitat 2024).
5️⃣ Why is sustainable farming vital? It cuts fertilizer use 25% and restores soil carbon through regenerative and precision methods (FAO 2024).
6️⃣ Which countries lead in renewables? 🇮🇸 Iceland – 100%, 🇨🇷 Costa Rica – 99%, 🇸🇪 Sweden – 65%, 🇩🇪 Germany – solar boom, 🇰🇪 Kenya – 80% clean mix (IEA 2025).
7️⃣ How can schools teach sustainability? Add climate topics to lessons, run eco-clubs, and use VR for ecosystem learning (UNESCO 2024).
8️⃣ What role do governments play? Over 140 nations enforce net-zero plans; public green funding tops $2 trillion (UNFCCC 2024).
About the Author
I’m Soumen Chakraborty, the founder and lead researcher at GreenGlobe25. I specialize in translating complex data on pollution, climate risks, and sustainability into clear, actionable guides for Indian households and communities.
My work is based on a rigorous analysis of authoritative sources like the CPCB and WHO, following our publicly-available Fact-Checking Policy to ensure every piece of content is accurate and trustworthy. LinkedIn: chakrabortty-soumen Facebook: Ecoplanet
Data verified through UN, IPCC, FAO, EPRA (2024–2025).