Milky Way above city skyline showing light pollution contrast, Dark Sky Movement concept.

Dark Sky Movement: The 2025 Guide to Ending Light Pollution

A Global Effort to Save Our Night Skies

For most people living in cities, stepping outside at night means seeing only a handful of stars. According to the World Atlas of Artificial Night Sky Brightness (2023), more than 80% of the global population can no longer view the Milky Way under natural darkness.

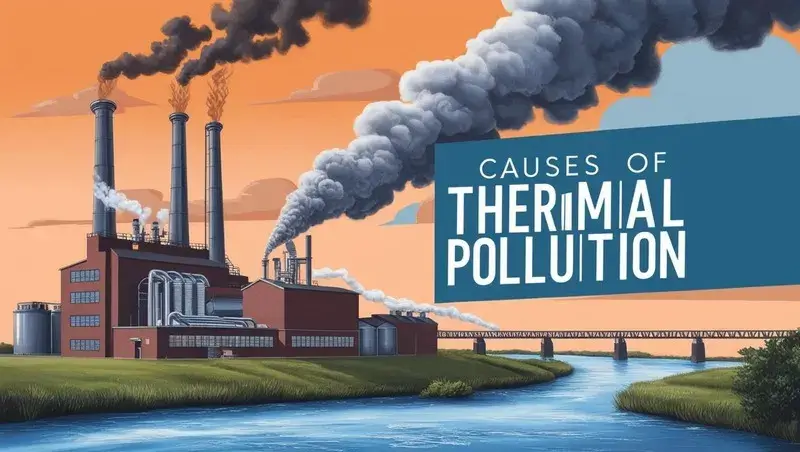
This growing glow is a clear sign of light pollution — an overlooked environmental issue affecting wildlife, energy use, human health, and our cultural connection with the night sky.

The Dark Sky Movement brings together scientists, educators, policymakers, artists, and communities to protect night environments. The goal is simple: use light responsibly so nature and progress can coexist.

This guide explains how the movement began, the major types of light pollution, global success stories, and practical steps anyone can take to restore natural darkness.

Real-World Success Stories Backed by Data

Tucson, USA

Retrofitted 18,000+ streetlights with shielded 3,000 K LEDs, cutting energy use by about 60% and reducing sky brightness by 7% (Barentine et al., 2018).

Flagstaff, USA

The world’s first International Dark Sky City, where over 90% of lighting complies with dark-sky standards. Tourism increased following lighting reforms (IDA, 2020).

Jaisalmer, India

A 2024 pilot adopted night-sky-friendly lighting expected to save ~30% power, supporting eco-tourism and reducing skyglow.
The Ministry of Power estimates India could eliminate 2.5 million tonnes of CO₂ annually through nationwide lighting upgrades (MoP, 2024).

What Is the Dark Sky Movement?

The movement promotes responsible outdoor lighting that reduces glare, skyglow, energy waste, and ecological disruption. Originating in the 1980s, it gained momentum when astronomers recognized that growing urban brightness threatened scientific research.

In 1988, the International Dark-Sky Association (IDA) was founded — now the global leader in night-sky protection.

Why Light Pollution Matters

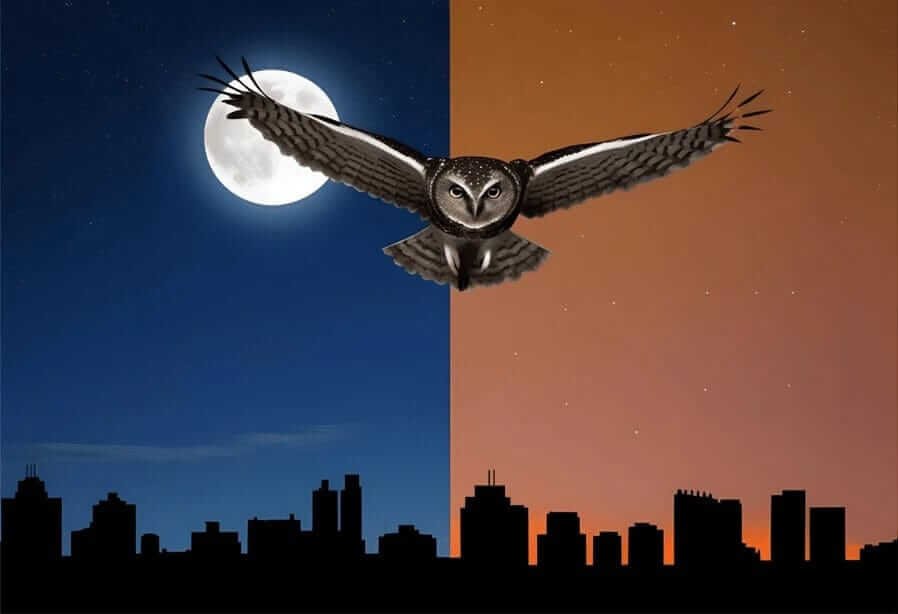
  1. Ecosystems: Artificial light disrupts migration, feeding, and breeding in birds, insects, sea turtles, and nocturnal animals.
  2. Energy Waste: Nearly 30% of outdoor lighting shines where it is not needed, wasting billions of dollars yearly.
  3. Human Health: Excessive night lighting influences sleep cycles and circadian rhythms.
  4. Cultural Impact: Losing the night sky removes an essential part of human heritage.

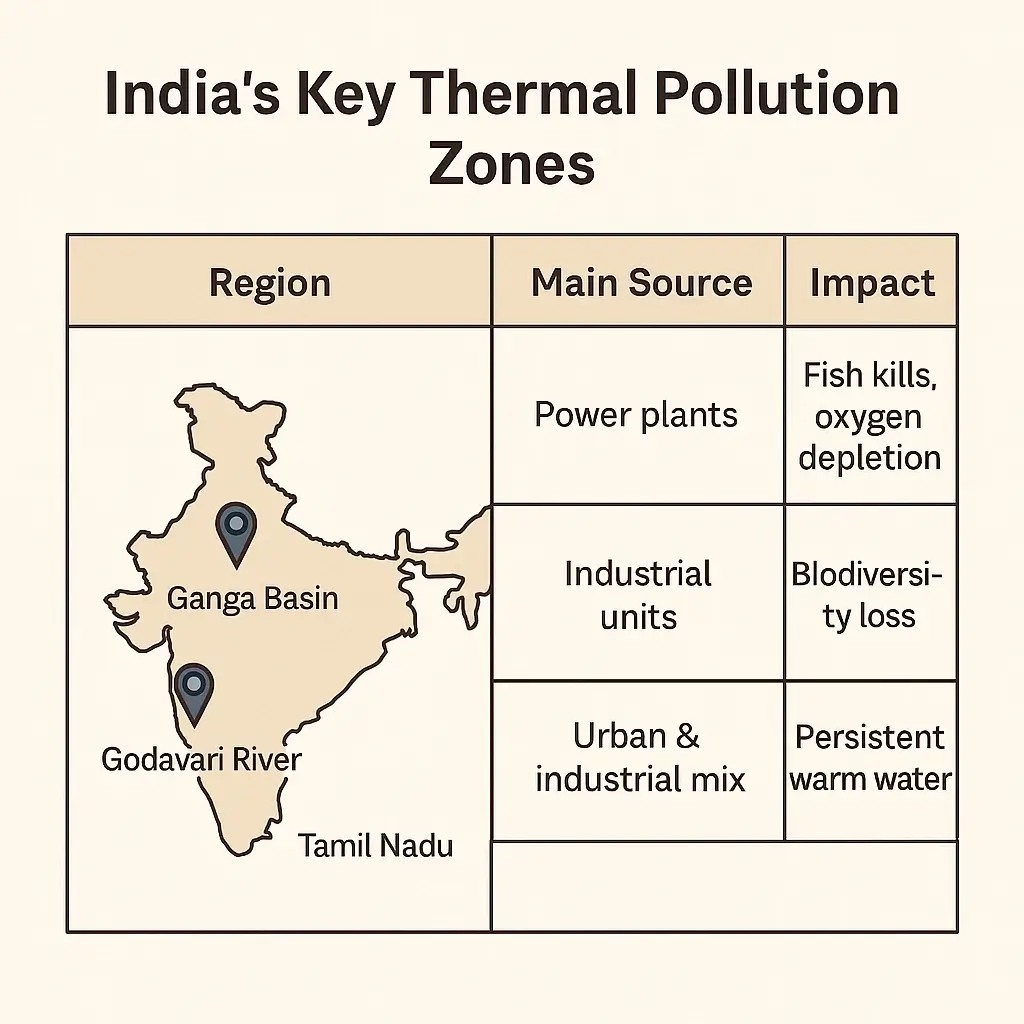
Dark Sky Movement in India

India is emerging as a dark-sky leader with major initiatives:

  • Hanle, Ladakh (2022): India’s first Dark Sky Reserve (1,073 sq km).
  • Spiti Valley, Himachal Pradesh: Under evaluation for certification.
  • Rann of Kutch, Gujarat: Strong candidate due to low population and vast open skies.
  • DST & ASI: Developing national outdoor-lighting guidelines.

These steps show how India is combining astronomy, sustainability, and tourism.

Types of Light Pollution (with Examples & Drawing Ideas)

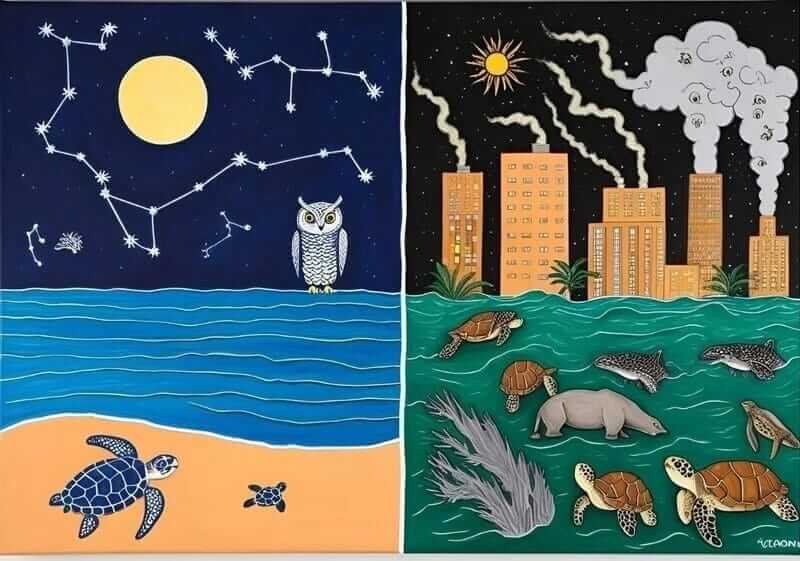
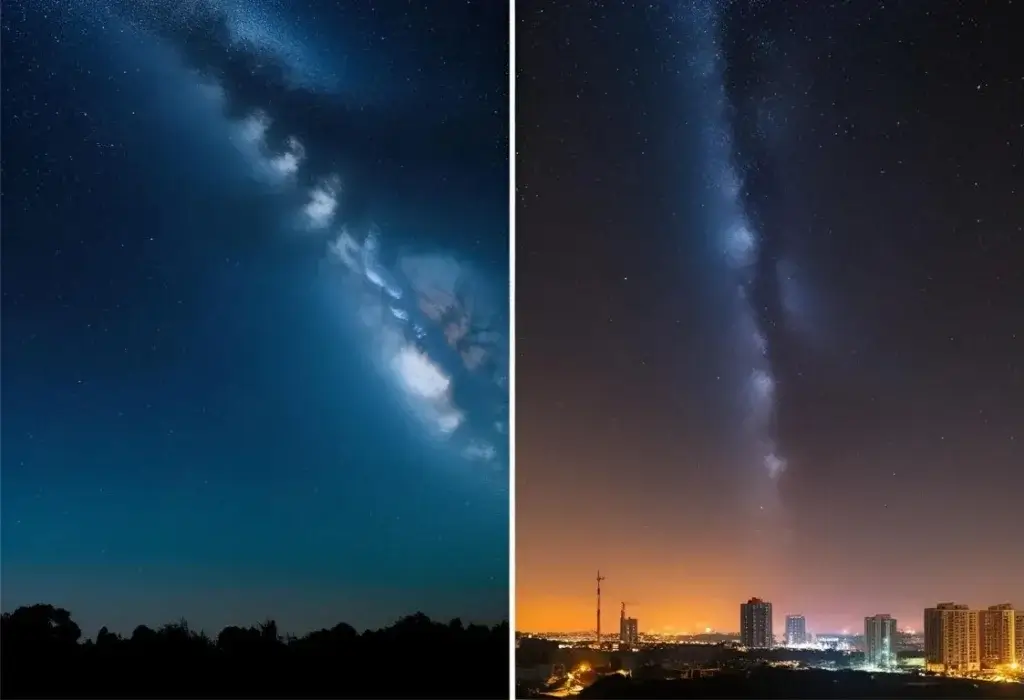
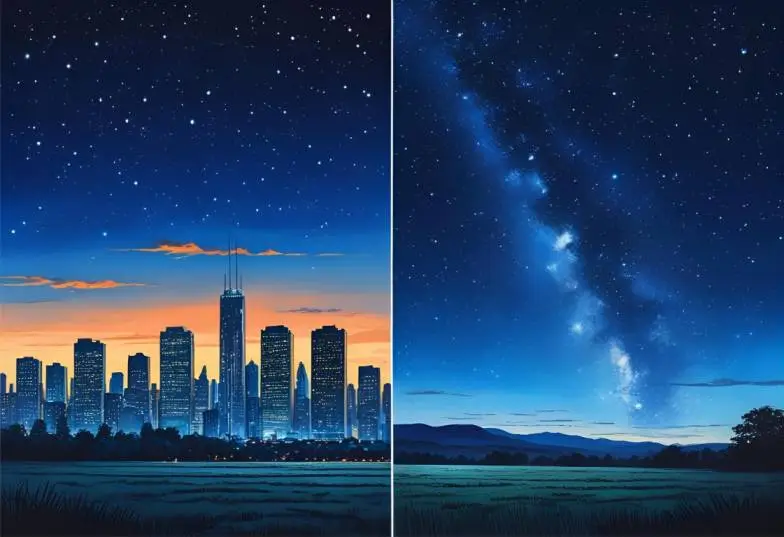
1. Skyglow — The Lost Stars

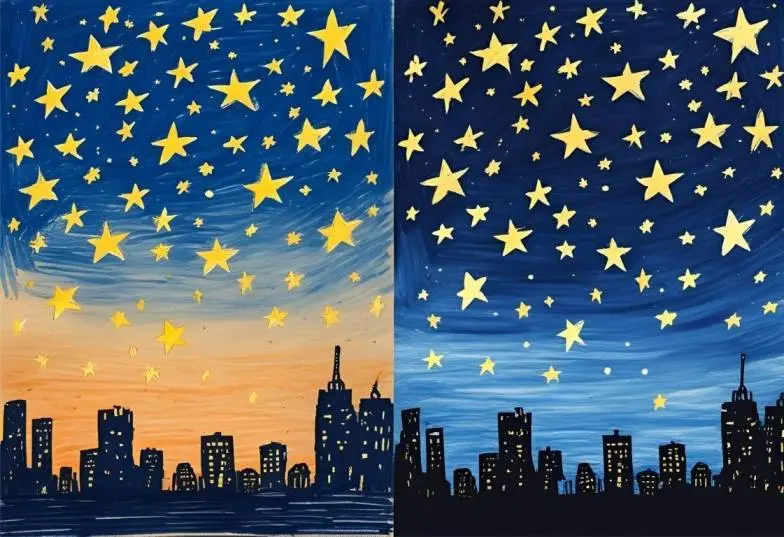
Skyglow is the most recognizable form of light pollution, often seen as a bright dome hovering above cities and towns. This glow occurs when excessive or misdirected outdoor lighting scatters into the atmosphere and reflects off dust, moisture, and airborne particles. As a result, thousands of stars become invisible to the naked eye—even in areas far from major urban centers. Skyglow affects astronomy, wildlife navigation, and our cultural ability to connect with the natural night sky.
Use this concept in drawings by showing a polluted orange sky on one side and a dark, star-rich sky on the other to illustrate how cities lose their stars due to over-lighting.

Illustration showing a city covered in orange skyglow on one side and a clear, star-filled dark sky on the other side.
A comparison of skyglow in a brightly lit city versus a natural dark-sky landscape where the Milky Way is visible.

2. Glare — Light That Hurts

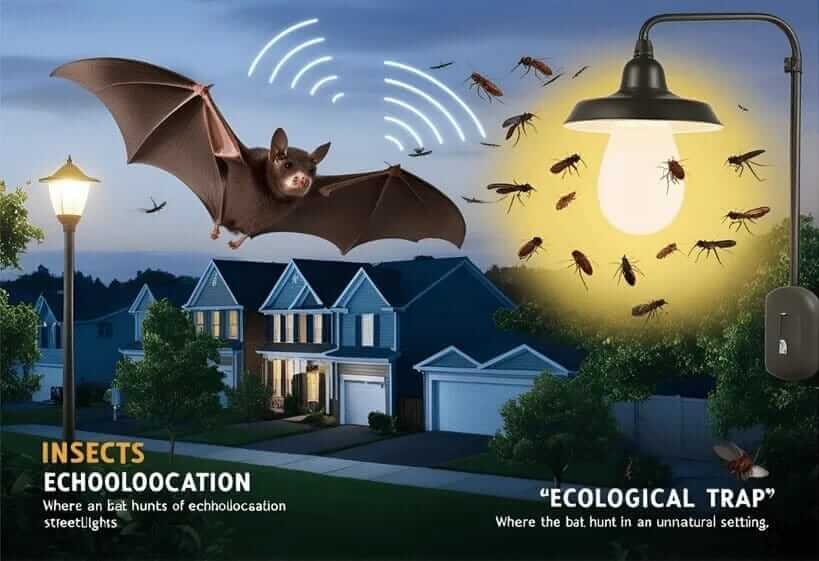
Glare occurs when outdoor lights are overly bright or poorly positioned, shining directly into people’s eyes instead of lighting the ground. This creates intense visual discomfort, reduces night visibility, and can even be dangerous for drivers, cyclists, and pedestrians. Unshielded LED streetlights and security floodlights are common sources of nighttime glare, especially in residential neighborhoods.
A drawing idea for students: compare an unshielded light that produces harsh white glare with a shielded, warm-toned lamp designed to illuminate safely without blinding passersby.

Side-by-side drawing of a bright unshielded streetlight causing glare and a shielded warm light providing comfortable nighttime visibility.
An example of harsh glare from an unshielded streetlight compared with softer, shielded lighting that improves visibility.

3. Light Trespass — Crossing Boundaries

Light trespass happens when unwanted artificial light spills into spaces that are meant to remain dark—such as a streetlamp shining into a bedroom window or a neighbor’s garden light illuminating another person’s yard. This intrusion disrupts sleep patterns, affects health, and reduces nighttime comfort for residents. Many cities now recognize light trespass as a legitimate environmental and public health concern, recommending shielded fixtures and motion sensors to reduce overflow lighting.
A simple drawing idea: show a bright streetlight entering a window in the first frame, and a properly shielded lamp keeping the room dark in the second frame.

Illustration of a bedroom affected by intrusive streetlight and a second scene showing how shielded lighting prevents light trespass.
Light trespass illustrated through a streetlamp shining into a bedroom window compared with a properly shielded fixture that keeps homes dark.

4. Clutter — Too Many Lights

Light clutter refers to the visual chaos created by groups of overly bright or competing light sources—such as neon signs, billboards, decorative LEDs, and high-intensity floodlights. Cluttered lighting makes it hard for the eye to adjust at night, increases skyglow, and can create confusion for both drivers and wildlife. This type of pollution is especially common in commercial zones, busy traffic intersections, and city centers famous for their illuminated skylines.
For drawings, compare a crowded street full of overlapping lights with a redesigned version that uses balanced, well-planned lighting to create a calmer, more energy-efficient nighttime environment.

Drawing showing urban light clutter with overlapping neon signs and floodlights contrasted with organized, efficient nighttime lighting.
Visual comparison of a street filled with billboards, neon signs, and floodlights versus a calmer scene with well-planned, balanced lighting.

Key message: Lighting itself isn’t harmful — misused lighting is.

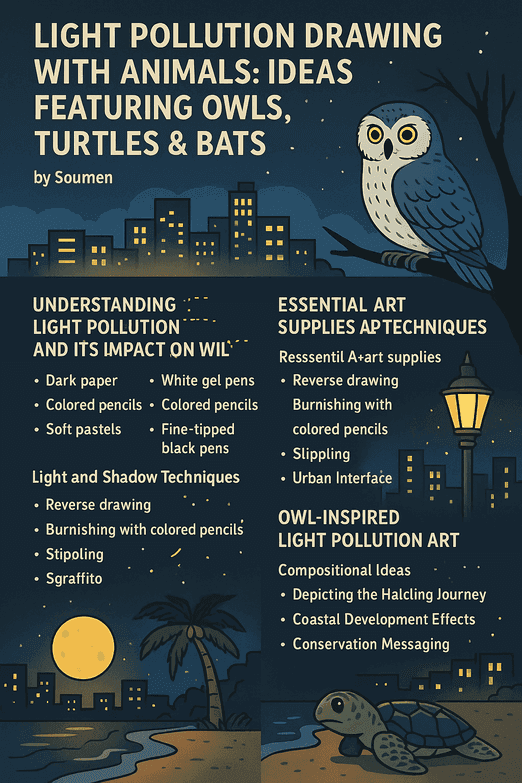
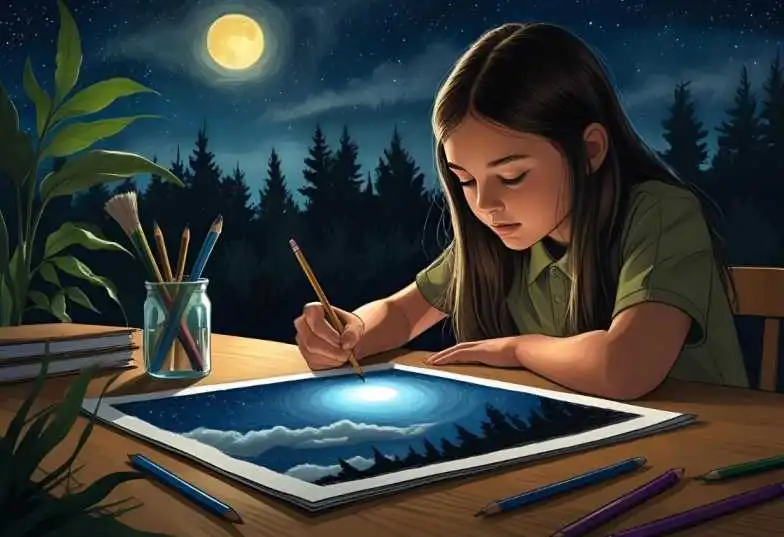
Light Pollution Art for Schools & Communities

Art transforms awareness into action. Organizations like IDA, UNESCO, and Earth Hour Schools encourage creative learning programs because visual storytelling helps learners understand environmental impact quickly.

Examples of Classroom or Community Projects

1. Before & After City Drawing
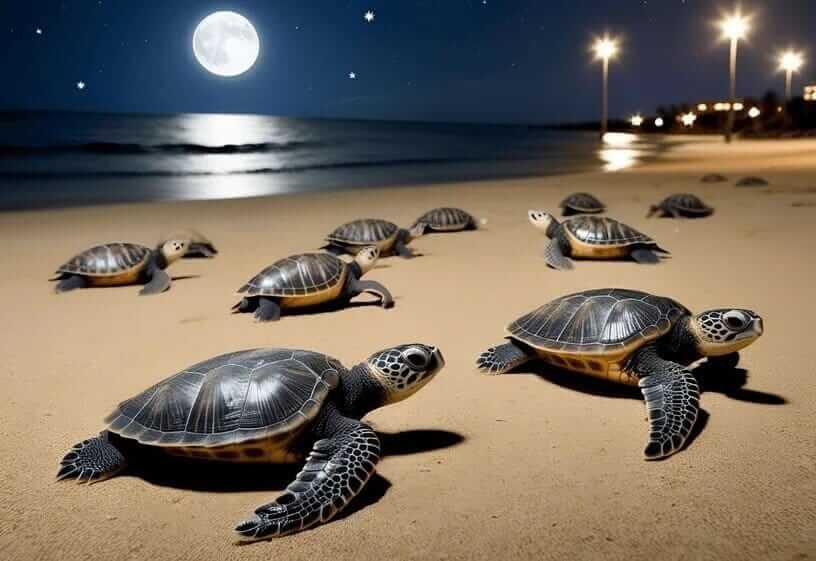
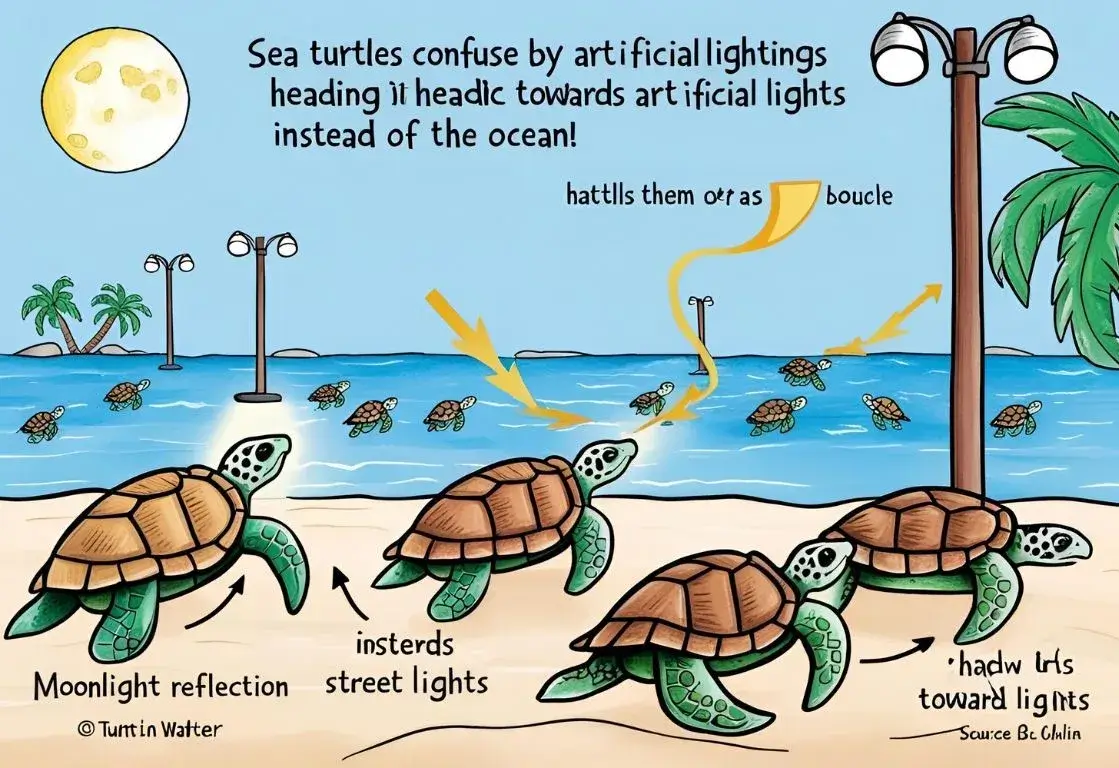
2. Wildlife-at-Night Illustrations (based on NOAA research showing sea turtle disorientation)
3. ‘One Earth, One Sky’ Mural
4. Smart Lighting Design Sheets
5. Digital Illustration Challenges

These activities help communities visualize the consequences of poor lighting and the benefits of smart lighting.

Hand-drawn student poster illustrating skyglow, glare, and the effects of artificial lighting on the night sky.
A student-created light pollution awareness poster showing how skyglow and artificial lighting affect the visibility of stars.

Global Dark Sky Success Stories

1. Utah, USA — The World’s First Dark Sky State

Utah has become a global model for night-sky conservation. With more than 20 certified Dark Sky Parks and Communities, the state has built an entire conservation framework that combines policy, engineering, tourism, and citizen participation.

Between 2015 and 2022, Utah’s municipalities progressively replaced older sodium lamps with full-cutoff LED fixtures, cutting 60–65% of public lighting energy use. Several rural towns implemented lighting curfews after midnight, reducing skyglow so effectively that faint constellations and the Milky Way are now visible from the edge of many communities.

Utah’s commitment has transformed stargazing into a significant economic asset — local parks report rising demand for guided night walks, astrophotography workshops, and seasonal “star parties,” which now draw visitors from around the world.

Night-sky photograph from a certified Dark Sky Park showing the Milky Way over a protected landscape, illustrating how responsible lighting policies preserve natural darkness.
Certified Dark Sky Parks worldwide demonstrate how policy and community action restore natural night skies.

2. Cévennes National Park, France — Europe’s Largest Dark Sky Reserve

Cévennes achieved one of Europe’s most ambitious lighting transformations. Working with more than 150 neighboring municipalities, the park coordinated thousands of lamp retrofits, switching to fully shielded fixtures and warm LEDs below 3000K.

Satellite observations from European environmental agencies show a noticeable decline in skyglow intensity, making Cévennes one of the few places in Europe where the night sky approaches natural brightness.

Educational programs like “Nuit des Étoiles” (Night of the Stars) invite students and visitors to learn astronomy under pristine skies. The region now markets astro-tourism as a cultural experience, linking local heritage, conservation, and scientific awareness.

3. NamibRand Nature Reserve, Namibia — Africa’s First Gold-Tier Dark Sky Reserve

Located in one of the driest regions on Earth, NamibRand offers exceptionally clear desert skies. To preserve this natural advantage, the reserve adopted strict lighting guidelines: no fixed outdoor floodlights, mandatory shielding, and a strong preference for motion-sensor lights.

Eco-lodges in the reserve redesigned their night-time lighting to protect nocturnal animals such as caracals, jackals, and desert insects. This approach also enhanced the visitor experience — guests now enjoy guided nocturnal ecology walks and astronomy sessions using high-powered telescopes.

NamibRand’s conservation-led tourism model is widely cited as a leading example of how dark-sky protection can coexist with luxury tourism and wildlife conservation.

4. Aoraki Mackenzie, New Zealand — A Southern Hemisphere Star Sanctuary

Aoraki Mackenzie was one of the earliest regions to be awarded official Dark Sky Reserve status, and its success stems from a partnership between scientists, Māori communities, local councils, and tourism operators.

The region implemented lighting curfews, strict shielding requirements, and low-color-temperature LED conversions, collectively reducing light pollution by up to 90% compared to pre-certification levels.

Māori communities emphasize the cultural significance of the night sky — particularly Matariki (Pleiades), which marks the Māori New Year. Guided cultural astronomy tours now form a significant part of regional tourism, blending tradition, science, and conservation.

5. Seoul, South Korea — Urban Innovation for the Night Sky

Seoul demonstrates that even densely populated megacities can make progress. The city introduced adaptive smart-light systems that automatically dim or brighten based on pedestrian traffic and time of night.

Within the first phase of the rollout, Seoul reported a 45% reduction in municipal lighting energy use, healthier sleep patterns among surveyed residents, and a measurable reduction in skyglow in outer districts.

The city is now testing “light zoning,” where residential, commercial, and natural areas have different lighting rules — a strategy that urban planners worldwide are watching closely.

6. Atacama Desert, Chile — A Protected Scientific Sky

The Atacama Desert hosts some of the world’s most advanced observatories, including ALMA and the Very Large Telescope Array. To preserve these scientific assets, Chile implemented some of the strictest lighting regulations on the planet, controlling everything from lamp wattage to shielding and emission direction.

Nearby towns cooperate by using low-intensity amber LEDs, enforcing signage curfews, and restricting industrial lighting near astronomical facilities. As a result, the Atacama remains one of the last major regions on Earth where the Milky Way is visible in broad, high-contrast clarity.

Astro-tourism has flourished — visitors arrive not only for observatory tours but for night-sky photography workshops, desert star-gazing camps, and indigenous sky mythology experiences.

How You Can Support the Dark Sky Movement

1. Use Responsible Outdoor Lighting

One of the most effective ways to reduce light pollution starts right at home. By choosing lighting that directs light only where it is needed, households can dramatically decrease glare, skyglow, and wasted energy. The International Dark-Sky Association (IDA) recommends following the Five Principles of Responsible Outdoor Lighting, which encourage using light only when necessary, only in the amount needed, and only in the correct direction.

Quick Guide to Smart Lighting Choices

Lighting TypeRecommended?Why It Matters
Shielded FixturesYesDirects light downward, improving visibility and reducing skyglow.
Warm LEDs (<3000K)YesProduces less blue light, which scatters widely and disrupts wildlife.
Unshielded FloodlightsNoCauses glare, light trespass, and unnecessary energy consumption.
Motion or Timer SensorsYesEnsures lighting is used only when required, preventing all-night brightness.

Making these changes at home is simple, cost-effective, and immediately beneficial to your surroundings.

2. Support Local Dark-Sky Programs

Across the world, schools, nature groups, and astronomy clubs host events that celebrate the night sky while educating communities about the impact of artificial light. Participating in these programs not only spreads awareness but also helps create a culture of responsible lighting in your area.

Examples include:

  • Earth Hour, where millions switch off lights to highlight energy conservation.
  • Globe at Night, a citizen-science project that helps scientists map global light pollution.
  • International Dark Sky Week, encouraging people to experience natural darkness.
  • Community stargazing nights, where families and students observe constellations and learn basic astronomy.

Joining even one of these events makes you part of a global effort to restore natural night environments.

3. Spread Awareness Creatively

Awareness grows faster when people connect emotionally with the issue. Creative activities such as drawings, posters, reels, digital illustrations, or short awareness videos can inspire others to rethink how they use light. Schools often display student artwork that contrasts star-filled skies with polluted ones — a powerful visual lesson.

Sharing your work online with hashtags like #SaveTheNight and #DarkSkyMovement helps amplify the message and encourages others to take small but meaningful actions.

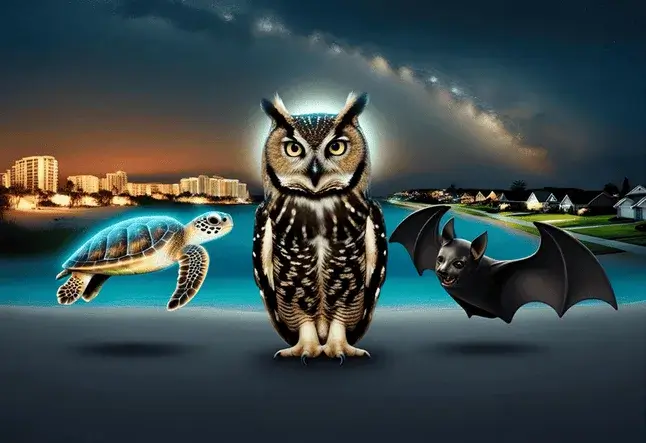
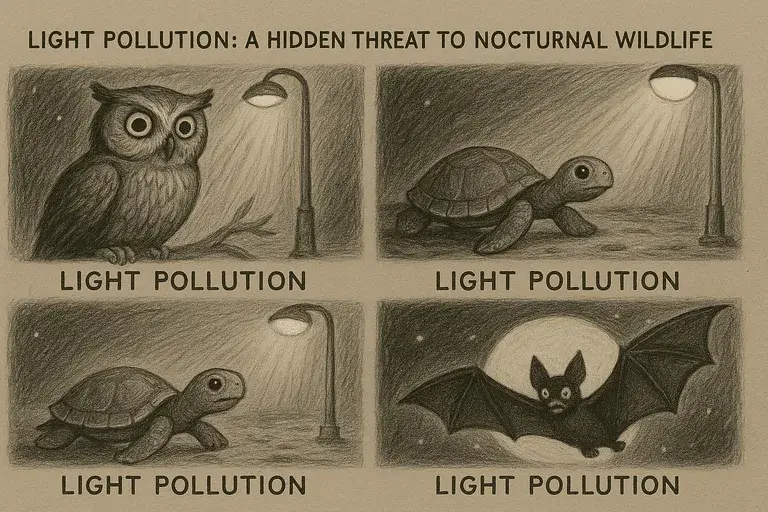
4. Protect Nocturnal Wildlife

Many animals depend on darkness to hunt, migrate, navigate, or breed. Bright yard lights can confuse birds, delay insect activity, or even mislead sea turtle hatchlings away from the ocean. By switching to motion-sensor lighting, keeping garden lights low and warm, and minimizing illumination during sensitive breeding seasons, you help create safer habitats for wildlife around your home.

Even simple steps — such as avoiding upward-facing decorative lights — can significantly improve local ecological health.

5. Experience the Night Sky Firsthand

One of the strongest motivations for protecting darkness is experiencing it yourself. Visiting a dark-sky park or a rural area with minimal light pollution allows you to see the Milky Way, faint constellations, and planetary alignments that many city residents have never witnessed. These moments often inspire people to take action at home and encourage others to value natural darkness.

Stargazing trips, guided astronomy walks, and astrophotography sessions are great ways to reconnect with the night sky.

6. Advocate for Responsible City Policies

Individual action is important, but long-term change requires thoughtful urban planning. You can contribute by encouraging local authorities to adopt smart lighting strategies, review outdated fixtures, and enforce community-wide standards for shielding, brightness, and color temperature.

Cities can also introduce adaptive lighting, which adjusts brightness based on traffic or time of night, and require environmental impact assessments before installing large-scale lighting systems. When citizens voice their support for these measures, municipalities are more likely to invest in sustainable lighting solutions.

Conclusion

Restoring the night sky is a shared responsibility. By adopting responsible lighting, supporting community programs, and educating future generations, we help preserve an essential part of Earth’s natural heritage.

Every light turned off brings us one step closer to a world where future generations can still see — and dream under — the stars.

Disclaimer:
This article summarizes publicly available research and environmental guidelines. It is for educational purposes only and does not replace official government or scientific recommendations.

Frequently Asked Questions (FAQ)

1. What does the Dark Sky Movement actually aim to achieve?

The movement’s core mission is to help communities use outdoor lighting in a way that supports safety without damaging the natural night environment. Instead of asking people to switch off lights entirely, it promotes lighting designs that reduce glare, skyglow, and energy waste. The goal is simple: keep the night dark enough for ecosystems, human health, and astronomy — while still keeping public spaces functional.

2. Why should ordinary people care about light pollution?

Light pollution is not only about losing the stars. It influences sleep cycles, increases energy bills, disturbs wildlife, and alters local climate rhythms. Many homeowners discover that by improving outdoor lighting — shielding lamps, choosing warmer LEDs, adding motion sensors — they save electricity while creating a more comfortable night environment.

3. What are the different forms of light pollution?

Light pollution appears in four main forms:

  • Skyglow: The bright dome seen above cities.
  • Glare: Harsh light that makes it difficult to see properly.
  • Light Trespass: Light entering places where darkness is expected, such as bedrooms.
  • Clutter: Overcrowded or competing lighting in commercial zones.
    Although these categories overlap, understanding them helps communities design lighting that serves people rather than overwhelms the sky.

4. Are there proven ways for a city to reduce light pollution?

Yes. Cities worldwide are adopting practical measures such as dimming unnecessary streetlights at night, switching to shielded fixtures, using warm LEDs below 3000K, and enforcing curfews for commercial lighting. Municipalities that adopted these measures report lower electricity costs, improved night visibility, and higher participation in astronomy and nature-based tourism.

5. How does artificial light affect wildlife at night?

Many species — including bats, owls, insects, and sea turtles — rely on predictable darkness to migrate, find food, or breed. Bright lighting can confuse their navigation signals or delay essential nighttime behavior. For example, research near coastal regions shows that hatchling sea turtles often crawl toward hotel lights instead of the ocean. Reducing unshielded light around natural habitats can significantly improve survival chances.

6. What practical steps can families take at home?

Homeowners can make meaningful improvements by using shielded outdoor lights, selecting warm LEDs (ideally under 3000K), installing timers or sensors, and turning off ornamental lighting late at night. These small adjustments lower monthly electricity use and create a healthier sleep environment for everyone in the household.

7. Can protecting dark skies support local economies?

Absolutely. Many regions have built thriving “astro-tourism” industries around dark-sky reserves and stargazing events. Visitors often stay in local lodges, use local guides, and spend on nearby businesses. Communities in France, Chile, New Zealand, and India have demonstrated that preserving natural darkness can generate sustainable revenue without harming local ecosystems.

8. Which global organizations guide dark-sky protection efforts?

The International Dark-Sky Association (IDA) provides guidelines, certification programs, and technical recommendations for responsible outdoor lighting. UNESCO and several regional alliances also support night-sky preservation by identifying potential dark-sky sites and helping governments shape evidence-based lighting policies.

9. Is switching to LEDs always better for the night sky?

Not always. While LEDs are efficient, blue-rich LEDs cause more skyglow than warmer alternatives. The safest choice for homes and cities is warm white LEDs (below 3000K) paired with shielding. This combination protects visibility and wildlife while still offering energy savings.

10. How can someone get involved in dark-sky conservation?

Joining a citizen-science project like Globe at Night, attending local stargazing events, sharing night-sky photographs, or encouraging schools to participate in dark-sky art programs are excellent starting points. Even reporting poorly designed public lighting to local authorities can contribute to long-term improvement.

Download our Free Dark Sky Drawing Worksheet – GreenGlobe25

This worksheet is an original educational resource created by GreenGlobe25 for non-commercial learning purposes.

Author Bio

I’m Soumen Chakraborty, the founder and lead researcher at GreenGlobe25. I specialize in translating complex data on pollution, climate risks, and sustainability into clear, actionable guides for Indian households and communities.

My work is based on a rigorous analysis of authoritative sources like the CPCB and WHO, following our publicly-available Fact-Checking Policy to ensure every piece of content is accurate and trustworthy.
LinkedIn: chakrabortty-soumen
Facebook: Ecoplanet

Last update on December 2025.

REFERENCES

Some of the images in this article were generated using AI to help illustrate concepts. They are not photographs of real events or locations.

Illustration showing industrial impact on aquatic life, contrasting solutions to thermal pollution with fish thriving in cool water versus stressed fish in heated water.

How Thermal Pollution Is Managed: Technological, Ecological, and Policy Frameworks

This article is written as an educational explainer. It describes frameworks, technologies, and policy approaches that are discussed in environmental science and water management literature. It does not provide professional, technical, or regulatory advice.

Introduction

After understanding what thermal pollution is and how it affects aquatic ecosystems, the next step is mitigation. Solutions to thermal pollution focus on reducing excess heat before it enters rivers and lakes, while restoring natural systems that help regulate water temperature over time.

Across the world, industries, power plants, and urban regions are adopting a combination of technological controls, ecological restoration, and policy measures to limit thermal stress on water bodies. When examined together, these approaches are associated in research with improved protection of aquatic habitats, stabilize dissolved oxygen levels, and support healthier river systems without compromising essential energy and industrial needs.

In India, the urgency is particularly high. Data from the World Bank (2022) indicates temperature increases of 2–5 °C in some industrial regions, while monitoring by the Central Pollution Control Board (CPCB, 2024) shows that a significant share of monitored rivers exhibit elevated temperatures near major power-generation and industrial clusters. These trends highlight the need for effective, scalable solutions tailored to local environmental and regulatory conditions.

New to the topic? Start with our beginner-friendly overview: What is thermal pollution?

Thermal power plant releasing warm water and steam near a river.
Heated water from industrial cooling systems can raise river temperatures and affect aquatic life.

In this article, we explore practical, science-backed solutions that can help cool our water bodies—ranging from advanced cooling technologies to simple ecological methods like planting trees along riverbanks. When applied together, these approaches can support healthier and more resilient river systems.

This article outlines how coordinated frameworks are described in research as addressing thermal stress in freshwater systems.

Thermal pollution requires targeted interventions that address industrial heat discharge, urban warming, and long-term river management. The following sections outline the most effective technological, ecological, and governance-based solutions currently used to reduce thermal stress in water bodies.

Technological Approaches Discussed in Thermal Pollution Management

Technology is commonly described in environmental literature as a direct method examined for reducing thermal pollution. By cooling water before it is discharged, industries can protect local ecosystems while still meeting their process needs. Many power plants and factories around the world have already adopted these solutions to comply with environmental regulations and reduce their impact on rivers and lakes.

Cooling towers releasing heat into the air to cool industrial water before discharge.
Cooling towers are widely described in environmental studies as reducing thermal discharge by releasing heat into the atmosphere instead of rivers.

Cooling Towers & Heat Exchangers

Cooling towers help lower the temperature of water used in industrial processes. Instead of releasing warm water straight into a river, the water passes through the tower where heat is released into the air. Heat exchangers work in a similar way by transferring heat from wastewater to a separate medium, so less heat reaches natural water bodies.

Analyses by energy agencies and regulatory bodies show that moving from once-through cooling to closed-cycle cooling can significantly reduce thermal discharge. Many thermal power plants in Europe, North America, and Asia have made this shift.

In India, NTPC’s Simhadri power plant has introduced a closed-cycle cooling system with natural-draft cooling towers. This setup is designed to limit hot water discharge and reuse a portion of cooling water, helping the plant meet temperature limits set by regulators.

Renewable Energy Integration

In the long term, reducing dependence on water-intensive thermal power plants also helps address thermal pollution. Solar and wind energy require very little water for operation compared to coal-based generation. As India continues to add more renewable energy capacity each year, the share of electricity generated from plants that rely heavily on cooling water is expected to decline (MNRE, 2024).

This shift in the energy mix does not solve thermal pollution overnight, but it reduces the growth of new heated discharges and lowers pressure on rivers in the long run.

Ecological and Policy Frameworks Used in Practice

Technology alone cannot fully solve thermal pollution. Long-term solutions also depend on ecological restoration and strong environmental policies. When natural systems like forests, wetlands, and floodplains are restored, they help regulate water temperature and improve overall river health.

Riparian Buffer Zones & Wetland Restoration

Riparian buffer zones are strips of trees, shrubs, and grasses along riverbanks. They provide shade, reduce direct sunlight on the water, and help keep temperatures lower. These buffers also stabilise banks, filter runoff, and create habitat for birds, insects, and aquatic life.

Wetlands play a similar role. They store water, slow down flows, and soften temperature swings. Research from the World Bank (2022) shows that restored wetlands in some parts of Europe have reduced local river temperatures by up to 2°C, improving conditions for fish and other species.

Riparian buffer with trees and vegetation providing shade to a river.
Riparian buffers are shown in studies to be associated with cooling waterways, reduced erosion, and improved habitat quality.

Regulations, Incentives & Global Frameworks

Environmental regulations set limits on how warm discharged water can be. Agencies such as the U.S. Environmental Protection Agency (EPA) and India’s Central Pollution Control Board (CPCB) define acceptable temperature ranges for industrial effluents. These standards push industries to adopt better cooling technologies and reduce their thermal impact.

Financial incentives can also help, such as tax benefits or subsidies for installing efficient cooling systems or shifting to renewable energy. International agreements and knowledge-sharing platforms allow countries to learn from each other’s experiences and adopt proven approaches more quickly.

When ecological restoration and policy enforcement work together, they create lasting benefits for rivers, communities, and biodiversity.

Community-Based Monitoring and Research Directions

Communities that live near rivers and lakes often notice changes in water temperature, colour, or smell before any official report is released. Involving these communities in monitoring and reporting is therefore a powerful way to manage thermal pollution.

Local Initiatives & Citizen Science

Citizen science programmes encourage students, residents, and local groups to measure basic water quality indicators, including temperature. For example, in India, the Namami Gange initiative has involved volunteers in observing river conditions in selected stretches of the Ganga basin. Similar efforts by NGOs in other river basins have helped identify problem points and bring them to the attention of authorities.

These programmes do more than collect data. They build awareness, strengthen local ownership, and inspire young people to see themselves as caretakers of their nearby water bodies.

Community volunteers measuring river temperature as part of citizen science monitoring.
Citizen science programmes help communities track river temperatures and report thermal pollution.

Inspiring Global Examples & Ongoing Research

Researchers worldwide are working on tools and strategies to better manage thermal pollution. These include more efficient cooling technologies, improved monitoring systems, and nature-based designs such as wetland buffers. Case studies from different countries show that when industries, governments, and communities work together, it is possible to reduce thermal stress on rivers while still supporting economic activity.

As data and technology improve, the focus is shifting from only reacting to thermal pollution to planning ahead—identifying hotspots early, setting clearer temperature targets, and designing infrastructure with aquatic health in mind.

Conclusion: Moving Toward Sustainable Management of Thermal Pollution

Thermal pollution presents a complex challenge that requires carefully designed interventions rather than isolated responses. Evidence from industrial, urban, and riverine systems shows that excess heat in water bodies can be effectively managed when technological controls, ecological restoration, and regulatory oversight are aligned.

Modern cooling technologies are designed with the objective of reducing heat discharge at the source, while ecological measures such as riparian buffers and wetland restoration help stabilize water temperatures over time. Policy frameworks provide the structure needed to monitor compliance, set temperature thresholds, and guide long-term planning across sectors. Together, these approaches form the foundation of current strategies used worldwide to limit thermal stress in freshwater ecosystems.

World map showing major thermal pollution hotspots Global map showing key rivers affected by thermal pollution and implemented mitigation strategies.
Thermal pollution affects rivers worldwide, but proven solutions are being introduced across many regions.

As environmental pressures increase due to industrial growth and climate variability, the role of integrated thermal pollution management becomes increasingly important. Understanding how these solution frameworks function—and how they are applied in different regional contexts—supports informed decision-making and long-term protection of rivers, lakes, and aquatic life.

Frequently Asked Questions About Thermal Pollution in India

What types of solutions are commonly used to reduce thermal pollution?

Solutions to thermal pollution typically include technological measures such as closed-cycle or dry cooling systems, ecological approaches like riparian buffer restoration, and policy frameworks that set limits on discharge temperatures. These solutions are often used together to reduce thermal stress on rivers and lakes.

How do power plants contribute to thermal pollution?

Many thermal power plants use water for cooling and discharge it back into nearby water bodies at higher temperatures. This heated discharge can raise local water temperatures, especially in rivers with limited flow or during warmer months.

Why is thermal pollution harmful to aquatic ecosystems?

Elevated water temperatures reduce dissolved oxygen levels and increase physiological stress on aquatic organisms. Over time, this can alter species composition, disrupt breeding cycles, and reduce biodiversity in affected water bodies.

What role does urban development play in thermal pollution?

Urban areas generate warmer runoff when rainwater flows over heated surfaces such as roads and rooftops. This stormwater can raise the temperature of nearby streams and lakes, particularly where vegetation and natural shading are limited.

How does climate change influence thermal pollution?

Climate change raises baseline air and water temperatures, making rivers and lakes more sensitive to additional heat inputs. As a result, even moderate thermal discharges can have stronger ecological effects under warmer climatic conditions.

References

  • CPCB. (2023). River Water Quality Monitoring Reports. Central Pollution Control Board, Ministry of Environment, Forest and Climate Change, Government of India.
    https://cpcb.nic.in
  • World Bank. (2022). Water Quality and Industrial Discharge Impact Report. World Bank Environment & Natural Resources Global Practice.
    https://www.worldbank.org
  • UNEP. (2023). Thermal Pollution and Aquatic Ecosystems: Global Overview. United Nations Environment Programme.
    https://www.unep.org
  • U.S. Department of Energy. (2020). Thermal Power Plant Cooling Technologies and Efficiency Analysis. Office of Energy Efficiency & Renewable Energy.
    https://www.energy.gov
  • MNRE. (2024). Annual Report on India’s Renewable Energy Capacity and Power Mix. Ministry of New and Renewable Energy, Government of India.
    https://mnre.gov.in
  • EPA. (2022). Thermal Discharge Standards and Water Quality Regulations. United States Environmental Protection Agency.
    https://www.epa.gov
  • International Journal of Environmental Research. (2023). Global Strategies for Managing Thermal Pollution in Industrial Regions.
    https://link.springer.com/journal/41742
  • NTPC. (2023). Sustainability and Environmental Performance Report. NTPC Limited.
    https://www.ntpc.co.in
  • Namami Gange Programme. (2023). Citizen Monitoring and River Health Assessment Initiatives. National Mission for Clean Ganga (NMCG).
    https://nmcg.nic.in

About the Author

I’m Soumen Chakraborty, the founder and lead researcher at GreenGlobe25. I specialize in translating complex data on pollution, climate risks, and sustainability into clear, research-based explanations for students, educators, and general readers.

My work is based on a rigorous analysis of authoritative sources like the CPCB and WHO, following our publicly-available Fact-Checking Policy to ensure every piece of content is accurate and trustworthy.
LinkedIn: linkedin.com/in/chakrabortty-soumen
Facebook: Ecoplanet

Last update on December 2025.

“Every small action matters in protecting our planet.”

Image Disclaimer:
Some images used on GreenGlobe25 are AI-generated illustrations created for educational purposes. They do not depict real places, events, or individuals.

Light Pollution Drawing with Animals featuring an owl, sea turtle hatchling, and bat under artificial night lights with a fading starry sky.

Light Pollution Drawing with Animals: Ideas Featuring Owls, Turtles & Bats

Introduction

Light Pollution Drawing with Animals is a creative way to show how excessive artificial light affects nocturnal wildlife like owls, sea turtles, and bats. Through art, we can reveal what’s often unseen — how glowing cityscapes confuse turtle hatchlings, disrupt owl hunting, and alter bat behavior.

In this 2025 guide, you’ll discover drawing ideas, techniques, and awareness art trends that connect ecology with creativity. Whether you’re a student preparing an environmental project or an artist exploring night-themed compositions, this article will help you turn science into storytelling — using art to protect the natural darkness our planet depends on.

For more background on global pollution types, visit our [Complete Guide to Pollution: Causes, Effects & Solutions].

Illustrated infographic titled Light Pollution Drawing with Animals: Ideas Featuring Owls, Turtles & Bats.

In 2025, the global conversation on light pollution has expanded beyond astronomy and into classrooms, art studios, and community events. The International Dark-Sky Association (IDA) and UNEP’s 2024–25 “Restore the Night” initiative have encouraged educators and young artists worldwide to use creative media to highlight the importance of natural darkness.

From school exhibitions to global art challenges, students are turning drawings into awareness tools—illustrating how city lights affect nocturnal animals and the stars we can no longer see. Many classrooms now include “Light Pollution Drawing Projects” as part of environmental education, linking science with art to inspire action.

Creating such artwork helps students visualize real-world issues like sky glow, light trespass, and wildlife disruption, all while learning how responsible lighting can restore balance between technology and nature.

⚡ Quick Facts (2025)

🎨 Over 40 schools in India joined UNEP’s Dark Sky Drawing Week 2025, promoting art-based awareness on wildlife and human health impacts.

🌌 Recent studies (2025) estimate about 83 % live under light-polluted skies, but earlier foundational work places that figure around 80 % (World Atlas, 2016).

🦉 Urban light levels have increased by ~9% per year since 2018 (ESA Night Lights Report, 2024).

In 2025, art competitions and school campaigns have increasingly focused on wildlife affected by light pollution — from owl migration studies to turtle-safe lighting projects along India’s coasts. Students and artists are blending science with art to visualize how artificial light changes animal behavior.
If you’re planning your next awareness poster or exhibition, explore our Light Pollution Drawing Ideas (2025) Guide for creative layouts and environmental slogans. Together, these projects are helping young creators understand how protecting darkness also protects biodiversity — a bright idea for a darker, healthier night sky.

Understanding Light Pollution and Its Impact on Wildlife

Before beginning your artistic journey, it’s essential to understand the phenomenon you’re depicting.

Light pollution encompasses several forms of excessive or inappropriate artificial lighting:

  • sky glow: the brightening of the night sky over populated areas
  • light trespass: light falling where unintended
  • glare: excessive brightness causing discomfort
  • light clutter: confusing groupings of light sources

Similarly, thermal pollution in India shows how industrial heat disrupts aquatic ecosystems — reminding us that pollution isn’t limited to air or light but affects water, temperature, and wildlife balance too.

Unlike other environmental contaminants, light pollution can be less obvious because humans have adapted to constant illumination. However, for nocturnal wildlife, artificial brightness represents a significant disruption to environments that evolved with natural darkness for millions of years.

Charcoal-style light pollution drawing with animals, featuring an owl, turtle, and bat disturbed by artificial street lighting.
Charcoal-style light pollution drawing with animals

Each affected species faces unique challenges:

Owls have specialized visual and auditory adaptations for hunting in the dark. Excessive artificial light disrupts their hunting patterns, potentially exposing them to predators and interfering with their ability to locate prey. Their highly specialized night vision becomes less advantageous when landscapes are artificially brightened.

Sea turtles display perhaps the most dramatic impact—hatchlings instinctively orient toward the brightest horizon, which historically was moonlight reflecting on ocean waters. Coastal development creates artificial bright horizons that mislead hatchlings inland rather than toward the sea, resulting in disorientation and often death.

Bats face a complex relationship with artificial light, sometimes avoiding illuminated areas (reducing their foraging territory) and sometimes being exploited as easy targets for predators. Light also attracts insects, potentially disrupting local ecosystems and concentrating bat feeding in unnaturally bright areas, creating “ecological traps.”

By understanding these specific impacts, your artwork can tell more compelling visual narratives about these animals’ struggles in our brightening world.

For more poster and project ideas, see our light pollution drawing ideas for students .

Studies show that artificial light at night (ALAN) can interfere with natural behaviors in many species, including foraging, migration, and reproduction (Longcore & Rich, 2004).

For more educational resources, visit the Royal Astronomical Society’s guide to light pollution.

Essential Art Supplies and Techniques

Creating effective environmental art depicting light pollution requires materials and techniques that capture both nocturnal animals and the contrasting effects of artificial illumination:

  • Dark paper (black or deep blue) provides an excellent base for night scenes, making luminous elements stand out dramatically.
  • White gel pens, white charcoal, and opaque white paint for stars, moonlight, and highlights
  • Colored pencils with layering capabilities for building subtle gradients mimicking light sources
  • Soft pastels for atmospheric effects, representing sky glow
  • Metallic and fluorescent markers for depicting artificial light sources
  • Fine-tipped black pens for defining details like feathers and fur against lighter backgrounds

For digital artists, programs with strong layer effects and glow capabilities (Procreate, Photoshop, GIMP) offer powerful tools for depicting light scenarios.

Light and Shadow Techniques

  • Practice reverse drawing by starting with a dark background and gradually adding light.
  • Use burnishing with colored pencils to create smooth, luminous areas
  • Apply stippling (dots) for gradual transitions between light and shadow
  • Try sgraffito (scratching away layers) for star fields or filtered moonlight

For digital art, experiment with layer blending modes like “Screen” or “Color Dodge” to create realistic light effects, and use blur filters to mimic light diffusion in atmospheric conditions.

Creating Contrast

Distinguish between natural and artificial light by:

  • Using cooler tones (silver, pale blue, gentle white) for natural light
  • Employing warmer or harsher tones (amber, orange, harsh yellow-white) for artificial light
  • Considering directionality, natural light often comes from above, while artificial light typically originates from human-level sources.
Light Pollution Drawing with Animals showing an owl flying across a city skyline illuminated by artificial lights, obscuring stars.
Owl flying over cityscape with bright sky glow

Owl-Inspired Nocturnal Art Concepts

Now that we’ve explored the ecological challenges light pollution poses, let’s explore how we can creatively portray these effects in art. Owls, with their unique nocturnal adaptations, provide an excellent canvas for exploring the intersection of wildlife and artificial light.

Just like thermal pollution in India disrupts aquatic life through heat discharge, light pollution disrupts nocturnal raptors by flooding their night habitats with glare and glow.

Capturing Adaptations for Night Vision

  • Create detailed close-ups of owl eyes, showing one eye adapted to natural darkness and another reflecting harsh artificial light.
  • Illustrate normal pupil dilation in darkness versus constriction under artificial light.
  • Depict specialized feather structure allowing silent flight—an adaptation less advantageous when prey can visually detect predators under artificial lighting.

Compositional Ideas

  • Silhouette Against Light Pollution: Draw an owl in a dark silhouette against a background of city lights and sky glow
  • Split Scene: Create a divided composition showing the same landscape with an owl hunting successfully under moonlight on one side and struggling amid artificial lighting on the other
  • Hunting Disruption: Design sequential images showing an owl focusing on prey, being blinded by sudden light, and losing its hunting opportunity
  • Urban Interface: Illustrate an owl perched on a street lamp, caught between instincts and urban adaptation

Symbolic Elements

Incorporate traditional symbols of wisdom juxtaposed with broken lights, clock elements referencing disrupted circadian rhythms, and partially obscured constellation patterns to symbolize the loss of our celestial heritage.

Light Pollution Drawing with Animals depicting sea turtle hatchlings crawling toward city lights instead of the ocean under a polluted night sky.
Hatchlings are crawling toward urban lights.

Sea Turtle Artwork Highlighting Light Pollution

The journey of sea turtle hatchlings provides a dramatic example of light pollution’s impact on wildlife behavior and survival.

Depicting the Hatchling Journey

  • Create sequential drawings showing traditional paths hatchlings would follow under natural conditions versus confused wandering under artificial light.
  • Illustrate beach scenes from a hatchling’s perspective, where hotel lights dominate instead of moonlight on water.
  • Design split compositions showing successful navigation by starlight on pristine beaches, contrasted with disorientation on developed coastlines

If you’re exploring cross-environmental art projects, see how air pollution drawing ideas visualize smog and emissions — another invisible force that alters animal behavior and habitat quality.

Read more from NOAA on how light pollution affects sea turtles.

Coastal Development Effects

  • Create panoramic views showing increasing development and light pollution over time, with corresponding changes in nesting success.
  • Illustrate differences between turtle-friendly lighting solutions (shielded, low, red-spectrum) and problematic fixtures (bright, white, unshielded). For real-world lighting guidelines, see Florida’s turtle-friendly lighting recommendations.
  • Design infographics showing how inland light pollution creates sky glow, affecting coastal environments
  • Depict volunteer efforts creating dark corridors during the hatching season.

Conservation Messaging

Incorporate hopeful elements showing how proper lighting modifications can restore natural behaviors, circular journey illustrations emphasizing the multi-generational importance of protecting nesting sites, and successful conservation interventions like artificial moon pools guiding hatchlings to safety.

Light Pollution Drawing with Animals showing a bat using echolocation while flying over a streetlight attracting insects in a suburban area.
A bat flying over a suburban streetlight

Bat Illustrations and Light Pollution Impacts

Bats’ complex relationship with artificial light makes them fascinating subjects for nuanced environmental artwork.

Research shows that artificial lighting significantly impacts bat behavior in several ways:

  • Fragments of bat habitats
  • Alter flight patterns
  • Reduces foraging efficiency
  • Increases predator exposure

(Source: Bat Conservation International)

Capturing Echolocation and Navigation

  • Visualize echolocation with sound waves disrupted by artificial light sources
  • Design split-frame illustrations showing a bat’s “mental map” under natural darkness versus artificial lighting
  • Illustrate changed insect distribution patterns between dark and lit areas
  • Depict flight paths avoiding artificially lit areas, showing habitat fragmentation

Urban Settings and Light Interactions

  • Create cityscapes showing bats clustered around certain street lights that attract insects, illustrating “ecological trap” phenomena.
  • Design contrast pieces showing beneficial bat-friendly lighting versus problematic fixtures
  • Illustrate urban roosts with light intrusion problems affecting daytime rest.
  • Create sequential art showing how city bats navigate increasingly illuminated landscapes.

Educational Elements

Incorporate visual representations of insect consumption volume, pollination services provided to specific plants, and economic value comparisons to counter common misconceptions about bats.

Light Pollution Drawing with Animals featuring a split scene of owl, turtle, and bat under natural darkness on one side and artificial lighting on the other.
Split scene with owl, turtle, and bat in natural vs artificial light

Creating Mixed Animal Compositions

Combining multiple light pollution-affected species in a single artwork tells more complex ecological stories about interconnected impacts.

Ecosystem-Based Approaches

  • Design vertical habitat slices showing light effects across canopy layers, from owls to mid-level bats to ground-dwelling creatures.
  • Create watershed perspectives following the light’s impact from inland areas to coastal nesting beaches.
  • Illustrate food webs where artificial light disrupts various connections between species.
  • Design seasonal cycles showing different challenges throughout the year

Storytelling Through Sequential Art

  • Create historical timelines showing the same landscape at different development stages.
  • Design day-to-night transition scenes showing animal emergence or retreat as artificial lighting increases
  • Illustrate solution scenarios where lighting improvements restore wildlife presence.
  • Create migration stories showing celestial navigation increasingly obscured by sky glow.
Light Pollution Drawing with Animals blending owl, turtle, and bat in a symbolic contrast between starry skies and urban glow, urging for darkness preservation.
Symbolic and metaphorical scene emphasizing the impact and hope

Practical Applications and Community Engagement

Your light pollution artwork can become a powerful tool for education and advocacy beyond personal expression.

Educational Projects

  • Design step-by-step drawing guides combining art instruction with environmental education
  • Create coloring pages showing proper versus improper lighting scenarios
  • Develop comparison cards showing animals under natural versus artificial conditions
  • Design infographic posters explaining the impacts on local wildlife

Community Art and Advocacy

  • Propose mural concepts focusing on local nocturnal wildlife
  • Create light projection art for community dark sky events
  • Develop informational postcards for distribution at community events
  • Design interpretive trail signage incorporating wildlife artwork

More than 80% of the world’s population now lives under light-polluted skies, according to the 2016 World Atlas of Artificial Night Sky Brightness (Falchi et al., 2016).

Digital Sharing

  • Create shareable infographics about specific species’ impacts
  • Design before/after slider images showing scenes with and without light pollution
  • Develop a series of related pieces for sustained awareness campaigns
  • Consider simple animations demonstrating effects for video platforms

Conclusion

Art makes the invisible visible, turning abstract concepts into emotional realities.

Light pollution drawings featuring owls, turtles, and bats harness creative power to paradoxically illuminate the importance of darkness in our natural world.

By depicting these sentinel species and their struggles with artificial light, artists become advocates for both wildlife conservation and preserving our connection to the night sky.

Each drawing becomes environmental communication with the power to change perspectives and behaviors.

Learn more about why dark skies are essential for both animals and people.

The solutions to light pollution—better-designed fixtures, appropriate timing controls, thoughtful placement, and warmer color temperatures—are readily available and often cost-effective. Your artwork can help visualize both problems and possibilities, illuminating a path toward nightscapes where wildlife and humans thrive under naturally dark, star-filled skies.

What will you create to help others see the importance of natural darkness? How might your art inspire changes that benefit silent-hunting owls, ocean-bound turtle hatchlings, and echo-navigating bats? The canvas awaits your vision.

Educators and students can explore additional learning materials through organizations such as the International Dark-Sky Association, which provides educational resources on protecting natural night environments. Learn more at the International Dark-Sky Association, the global leader in light pollution awareness and solutions.

Frequently Asked Questions (FAQ)

Q. What is light pollution, and how does it affect animals?

A. Light pollution refers to excessive or misdirected artificial light that disrupts natural darkness. It interferes with the behaviors of nocturnal animals like owls, sea turtles, and bats, impacting their hunting, navigation, and reproduction.

Q. Why are owls vulnerable to light pollution?

A. Owls rely on their exceptional night vision and silent flight to hunt in the dark. Artificial lighting disrupts their ability to see and hear prey effectively, reduces hunting success, and increases exposure to predators.

Q. How does light pollution harm sea turtle hatchlings?

A. Hatchling sea turtles instinctively move toward the brightest horizon, which used to be the moonlit ocean. Artificial coastal lights mislead them inland, often resulting in death from dehydration, predators, or human activity.

Q. What artistic techniques can be used to illustrate light pollution?

A. Artists can use dark paper, white gel pens, and colored pencils to create contrast between natural and artificial light. Techniques like reverse drawing, stippling, and digital glow effects help depict the impact on nocturnal wildlife.

Q. Can art help raise awareness about light pollution?

A. Yes! Artistic storytelling can turn complex ecological issues into emotionally engaging visuals. Drawings featuring affected animals can educate the public and inspire conservation actions.

Q. What are some solutions to reduce light pollution?

A. Effective solutions include using shielded light fixtures, installing motion sensors, choosing warmer color temperatures, and reducing unnecessary lighting, especially near wildlife habitats.

Q. What colors are best for light pollution drawings?

A. Use cool blues for moonlight and warm yellows for artificial lights to show contrast.

About the Author

I’m Soumen Chakraborty, the founder and lead researcher at GreenGlobe25. I specialize in translating complex data on pollution, climate risks, and sustainability into clear, actionable guides for Indian households and communities.

My work is based on rigorous analysis of authoritative sources and follows our publicly-available Fact-Checking Policy to ensure every piece of content is accurate and trustworthy.
LinkedIn: chakrabortty-soumen
Facebook: Ecoplanet

Last update on December 2025.

Free Classroom Resource

Light Pollution Drawing with Animals Resource Pack: Download printable animal-themed posters & awareness quiz (ZIP, free for classroom use). .

Some of the images in this story were created using AI to help illustrate key concepts more clearly. They’re meant to support learning—not simulate real-world scenes.

Thermal power plant in India releasing steam, contributing to thermal pollution in nearby water bodies

Thermal Pollution in India: Definition, Causes, Examples & Solutions (2025 Guide)

Regional Scope Notice
This article focuses specifically on thermal pollution in India, including local causes, case studies, regulatory frameworks, and socioeconomic impacts.
For a global overview of thermal pollution concepts and mechanisms, see our main guide on thermal pollution.

Introduction

Thermal pollution in India is a growing environmental concern linked to the country’s rapid industrial expansion and economic development. Rapid industrial growth has altered thermal conditions in several Indian water bodies—one of the most overlooked being the rise in water temperatures across rivers, lakes, and coastlines.

Whenever factories or power plants release heated water back into natural water bodies, the temperature shift disrupts delicate ecosystems and endangers countless aquatic species. But this isn’t only an environmental problem. Thermal pollution also threatens the livelihoods of millions of people—especially communities that depend on fishing, farming, and healthy freshwater resources.

In this guide, we’ll explore real-world examples of how thermal pollution is transforming India’s waterways, examine its ecological and socio-economic impacts, and highlight the solutions already making a measurable difference. Whether you’re a student, researcher, environmental advocate, or simply curious, you’ll find clear explanations and practical insights here. For broader context on water pollution in India, you can also explore environmental reporting from Down To Earth magazine.

Quick Definition

Thermal pollution refers to abnormal changes in water temperature caused by human activities.
For a detailed global explanation of thermal pollution mechanisms, see our main guide on thermal pollution.

Illustrated thermal pollution diagram showing how industries discharge heated water, raise water temperature, reduce oxygen levels, and affect fish populations.
Illustrative diagram showing industrial heat discharge into Indian rivers and lakes.

What is Thermal Pollution?

In India, thermal pollution is most commonly associated with large thermal power plants, industrial manufacturing zones, and dense urban discharge areas. Concentrated heat release from these sources can raise water temperatures in rivers, reservoirs, and coastal waters, particularly during low-flow and high-demand periods.

Infographic explaining how thermal pollution happens in Indian rivers and lakes, with sources and impacts.
Infographic: How thermal pollution affects India’s aquatic ecosystems.

Rather than repeating global mechanisms, the sections below examine how heated water discharge affects India’s aquatic ecosystems, biodiversity, and water-dependent communities, using region-specific data and case studies.

For a detailed global explanation of thermal pollution processes and mechanisms, see our main guide on thermal pollution.

Common Causes in the Indian Context

Primary sources of thermal pollution in India include:

  1. Thermal Power Plants: With over 200 coal-fired power plants nationwide, these facilities use vast quantities of cooling water that’s returned heated to nearby water bodies. The Singrauli region, India’s “energy capital,” hosts numerous plants discharging heated water into the Rihand Reservoir and the Son River.
  2. Nuclear Power Facilities: Plants like Kudankulam in Tamil Nadu and Tarapur in Maharashtra contribute to localized thermal pollution in coastal waters.
  3. Industrial Manufacturing: Steel mills, paper factories, chemical plants, and textile industries discharge heated wastewater across industrial clusters in Gujarat, Maharashtra, and Tamil Nadu.
  4. Urban Sewage Discharge: Major cities like Delhi, Mumbai, and Kolkata release untreated sewage that raises water temperatures, especially in smaller water bodies.
  5. Hydroelectric Dams: When cold water from reservoir depths is released, it creates “cold shock” downstream, affecting rivers like the Bhagirathi and Alaknanda.

India’s tropical climate compounds these issues, as water bodies already experience high ambient temperatures in the summer months.

Thermal Power Plants: Major Contributors

In India, thermal power plants are among the most significant contributors to thermal pollution due to their heavy reliance on water-based cooling systems. Concentrated clusters of coal- and gas-fired power stations along major rivers and reservoirs create localized zones of elevated water temperature, particularly during low-flow and high-demand periods.

The scale of this impact varies by region, plant capacity, and cooling technology, with several river basins experiencing sustained thermal stress near major power-generation hubs.

Map showing major thermal pollution hotspots in India, including Singrauli, Yamuna River, and Gujarat coast.
Map: Key regions affected by thermal pollution across India.

Case Study: Koradi Thermal Power Station, Maharashtra

The Koradi Thermal Power Station near Nagpur offers a clear case study of thermal pollution impacts in central India. Water temperature increases of 8-9°C (Source: CPCB Regional Monitoring Report, 2023) affect aquatic life and agricultural practices. This 2,600 MW plant draws water from the Kanhan River and returns heated effluent to nearby water bodies.

Studies show water temperatures in receiving channels are consistently 8-9°C higher than ambient levels.

Local fishermen report significant changes in fish populations, with native species like rohu and catla declining dramatically.

Farmers have observed that heated water seeping into irrigation channels affects crop yields, particularly for temperature-sensitive crops. Some report up to 30% yield reductions [Source: Kanhan Basin Agricultural Survey, 2023] in plots nearest to discharge channels.

Recent Updates (2023–2024): CPCB inspections in Chhattisgarh and documented fish-kill events near the Rihand Reservoir highlight rising thermal pollution risks across India.

Photograph of hot water being discharged from Koradi Thermal Power Plant into a river.
Koradi Thermal Power Station in Maharashtra releases heated effluent, affecting local fish and agriculture.

Case Study: NTPC Korba and Thermal Discharge in Chhattisgarh

The NTPC power complex in Korba, Chhattisgarh, is one of India’s largest coal-based power clusters and a significant contributor to thermal discharge. The CPCB “Thermal Power Plant Overview” report lists Korba Super Thermal Power Station among major plants affecting river ecosystems in the region (CPCB PDF). In 2024, CPCB monitoring highlighted elevated downstream water temperatures of 3–5°C above natural levels, breaching safe ecological limits (CPCB Monitoring Report). This has led to stress on carp and catfish populations and reinforces coal power’s central role in India’s thermal pollution challenge.

The Rihand Reservoir Crisis in Singrauli

The Singrauli region, spanning Madhya Pradesh and Uttar Pradesh, hosts multiple large thermal power plants with a combined capacity exceeding 10,000 MW. These plants discharge heated effluent into Rihand Reservoir, raising water temperatures by 6-8°C [Source: CPCB Singrauli Basin Study, 2024] above normal in discharge zones.

The ecological consequences include fish kills during summer months and declining biodiversity. The reservoir once supported over 40 fish species, [Source: Rihand Reservoir Fish Diversity Survey, 2024] but recent surveys show diversity has declined to fewer than 25 species. Fish breeding is highly temperature-sensitive, as explored in our detailed piece on aquatic reproduction and pollution.

Warmer water has accelerated algal blooms, creating eutrophication that further depletes oxygen levels. This impacts thousands of fisherfolk [Source: Singrauli Fisher Cooperative Records, 2023] who depend on the reservoir for their livelihoods.

Industrial Effluents and Urban Discharge

Beyond power generation, industrial sectors and urban areas contribute significantly to thermal pollution through various effluent discharges.

Industrial Corridor: The Gujarat Coast Example

Gujarat’s coastal industrial belt hosts one of India’s highest concentrations of chemical, petrochemical, and manufacturing facilities. In the Golden Corridor industrial zone, factories release cooling water and process effluents into the Kolak and Damanganga rivers before they enter the Arabian Sea.

Monitoring by the Gujarat State Pollution Control Board (GSPCB) has documented 4–7°C temperature increases in estuarine zones affected by heated industrial effluents.

The Jamnagar coastal area, home to massive petroleum refineries, shows thermal plumes extending several kilometers into the Gulf of Kutch, contributing to coral bleaching events in the nearby Marine National Park.

Traditional fishing communities report changing fish migration patterns and declining catches by up to 40% over two decades. [Source: Gujarat Fisheries Livelihood Assessment, 2005–2024]

Urban Heat Islands: The Yamuna River in Delhi

The Yamuna River receives approximately 3,800 million litres of sewage daily, according to the Delhi Jal Board Annual Report (2023). Monitoring data shows river temperatures increase by 2-3°C [Source: CPCB Urban River Temperature Study, 2023] flowing through the urban corridor, particularly downstream from major sewage outfalls.

The heated urban river creates conditions where water holds less dissolved oxygen, while biological processes that consume oxygen accelerate. During summer months, portions of the Yamuna become completely oxygen-depleted, creating “dead zones” where only pollution-tolerant organisms survive.

Ecological Impacts: How Thermal Pollution Affects Indian Aquatic Ecosystems

Diagram illustrating how rising water temperatures reduce dissolved oxygen and disrupt fish life cycles.
Illustrative diagram showing the ecological stress caused by elevated water temperatures in Indian aquatic ecosystems.

Disruption of Aquatic Ecosystems in the Ganges Basin

The Ganges River system faces thermal inputs from multiple sources along its course. Research from the National Mission for Clean Ganga (NMCG) has documented temperature variations of up to 6°C downstream from major thermal discharges, disrupting reproductive cycles of native fish species that rely on seasonal temperature cues for spawning.

The endangered Gangetic dolphin shows altered distribution patterns in response to thermal pollution. These dolphins rely on prey fish that avoid thermally polluted zones, effectively fragmenting dolphin habitats. Studies also indicate that the river’s unique bacteriophage community, which helps break down organic waste, functions optimally only within specific temperature ranges, meaning thermal pollution reduces the river’s natural self-purification capacity.

Ganga River – Industrial Loads and Mass Bathing Impact

In 2025, surveys by the Central Pollution Control Board (CPCB) reported elevated thermal loads in stretches of the Ganga near Kanpur, where clusters of tanneries and small thermal plants operate. Discharge raised water temperatures enough to reduce dissolved oxygen by nearly 40% during peak summer, endangering aquatic biodiversity (CPCB Report). Similarly, the Central Water Commission (CWC) “Kumbh Mela 2025 Water Quality Report” observed temperature spikes and degraded water quality during mass ritual bathing, compounding existing stress on the river (CWC Report). Together, these findings highlight how industrial effluents and cultural pressures intersect to worsen thermal pollution in India’s most sacred river.

For a detailed scientific explanation of the ecological and biological impacts of water temperature changes, see our comprehensive guide on the effects of thermal pollution.

Chilika Lake’s Changing Biodiversity

Chilika Lake, Asia’s largest brackish water lagoon and a Ramsar wetland site in Odisha, shows how thermal pollution affects coastal ecosystems. Research documents shifts in phytoplankton communities, with warmer waters favoring certain blue-green algae species that can produce toxins.

Fish community structure has changed in thermally affected areas, with cold-water dependent species declining while heat-tolerant invasive species expand. Ornithologists have documented changes in arrival times and duration of stay for several migratory bird species as their food sources are affected by thermal pollution.

Socioeconomic Consequences of Rising Water Temperatures in India

In the Narmada River basin, field observations and local livelihood assessments indicate declines in fish catch as species either experience thermal stress or shift away from affected zones. In coastal Tamil Nadu, monitoring reports and community surveys document changes in near-shore fish distribution, requiring fishing vessels to operate farther from the coast. These shifts are associated with increased operational costs and altered income patterns for fishing households.

Bar chart showing reduction in fish catch near thermal pollution sites in India from 2015 to 2025.
Figure: Reported changes in fish catch levels in regions affected by thermal discharge (2015–2025).

Impact on Fisheries and Dependent Communities

Along the Narmada River basin, thermal discharges have altered fish populations that sustain thousands of traditional fishing families. In the Bargi reservoir region, local livelihood surveys conducted between 2015 and 2024 report an estimated 25–35% income reduction among fishing households, as commercially valuable species decline (CPCB 2024 Livelihood Impact Survey).

In coastal Tamil Nadu, traditional fishing communities have documented shifting fish migration patterns due to thermal “barriers” that some species avoid. This forces fishermen to travel farther from shore, creating economic hardship and safety risks. Women in fishing communities, who traditionally handled post-harvest processing and local sales, have been particularly affected as their role in the value chain is disrupted.

Agricultural Implications near Thermal Pollution Sources

In the Damodar Valley region, irrigation with thermally affected water has shown measurable impacts on agricultural productivity. Warmer irrigation water increases soil microbial activity, which can accelerate the breakdown of organic matter and reduce soil fertility over time. Field studies in the area indicate that temperature-sensitive crops experience yield reductions of 15–20% [Source: Damodar Valley Agricultural Field Trials, 2022], particularly in plots located closest to thermal discharge channels.

In Chhattisgarh’s rice-growing regions near power plants, farmers have observed accelerated pest multiplication rates with warmer irrigation water, increasing production costs through greater pesticide dependency.

Regulatory Framework and Compliance Challenges

India has established a regulatory framework to address thermal pollution, with oversight primarily guided by the Central Pollution Control Board (CPCB) and implemented through central and state-level environmental authorities.

India’s Environmental Regulations on Thermal Discharges

Key regulations include:

  1. The Water (Prevention and Control of Pollution) Act, 1974
  2. Environmental Protection Act, 1986
  3. Thermal Power Plant Regulations limiting discharge temperature to no more than 5°C above the receiving water body temperature
  4. Coastal Regulation Zone (CRZ) Notification
  5. Environmental Impact Assessment (EIA) Requirements

Implementation and Enforcement Context

Despite robust regulations on paper, implementation faces challenges:

  • Monitoring Coverage: Availability of continuous, real-time temperature monitoring varies across regions and river basins.
  • Technical Capacity: State Pollution Control Boards report differing levels of technical staffing and analytical capacity.
  • Compliance Outcomes: Reported compliance levels differ across industrial sectors and locations, as reflected in inspection records.
  • Institutional Coordination: Oversight responsibilities are shared across multiple agencies, influencing implementation consistency.

Documented Mitigation Examples from India

Despite challenges, several regions have implemented effective approaches to manage thermal pollution.

Industrial Mitigation Examples

At Tata Power’s Trombay facility, upgrades to cooling infrastructure were associated with measured reductions in discharged water temperatures, according to company and regulatory disclosures.

In Gujarat’s chemical sector and Tiruppur’s textile cluster, heat management initiatives have been documented as part of broader compliance and efficiency programs.

Side-by-side images showing water quality improvement after implementing cooling systems.
Before and after: Ecological restoration reduces thermal pollution impacts.

Ecological Approaches and Nature-Based Solutions

In Odisha, engineered wetland and pond-based systems have been documented as part of thermal discharge management efforts, with monitoring reports indicating reduced downstream water temperatures in receiving channels.

In the Rihand reservoir region, NTPC has reported the establishment of designated thermal refuge zones using native vegetation, which are associated with improved habitat availability for temperature-sensitive fish species during warmer periods.

Near Karnataka’s Kaiga nuclear power plant, mangrove restoration initiatives have been recorded as part of coastal environmental management programs, contributing to localized moderation of water temperature fluctuations.

For a structured overview of global and India-specific approaches to reducing thermal pollution, see our dedicated guide on solutions to thermal pollution.

Latest India Thermal Pollution Snapshot (CPCB 2024–25)

Thermal power remains India’s dominant generation source; cooling water discharges are a major thermal load on rivers, lakes, and coastal zones. CPCB and State PCB spot checks repeatedly report temperature rises of roughly 3–8°C [Source: CPCB Thermal Discharge Snapshot, 2024–25] above ambient near plant outfalls during peak seasons.
Breaches are most common in late winter and late summer, when fish stress and DO dips are highest.
Compliance improves significantly where closed-cycle or hybrid cooling technology is adopted.

Conclusion

Thermal pollution represents a significant but often underexamined pressure on India’s freshwater and coastal ecosystems. Evidence from river basins, reservoirs, and industrial corridors shows that elevated water temperatures can influence aquatic biodiversity, fisheries, agriculture, and community livelihoods.

India’s experience highlights how thermal pollution is shaped by regional industrial activity, hydrological conditions, and regulatory context. Continued monitoring and documentation of temperature-related impacts remain essential for understanding the scale and distribution of thermal stress across the country’s water systems.

Frequently Asked Questions on Thermal Pollution

What is thermal pollution in the Indian context?

Thermal pollution in India refers to changes in water temperature caused by industrial discharge, power generation, and urban effluents that affect rivers, reservoirs, and coastal waters.

Why is thermal pollution a concern for Indian rivers?

Many Indian rivers already experience low flow conditions during dry seasons, making them more sensitive to temperature increases from industrial and urban sources.

How does thermal pollution affect fish in India?

Elevated water temperatures can disrupt breeding cycles, alter migration patterns, and reduce oxygen availability, affecting both native and commercially important fish species.

Are there legal limits on thermal discharge in India?

Yes. Regulatory guidelines generally limit thermal discharge to within 5°C above the receiving water body’s ambient temperature, subject to site-specific conditions.

Which regions in India are most affected by thermal pollution?

Impacts are most commonly reported near major thermal power clusters, industrial corridors, and densely populated river basins such as the Ganga, Yamuna, and Damodar systems.

How is thermal pollution monitored in India?

Monitoring is carried out by agencies such as the Central Pollution Control Board (CPCB) and State Pollution Control Boards through periodic inspections and water quality assessments.

Is thermal pollution linked to climate change in India?

While thermal pollution and climate change are distinct, rising ambient temperatures and reduced river flows can amplify the effects of heat discharge in water bodies.

About the Author

I’m Soumen Chakraborty, the founder and lead researcher at GreenGlobe25. I specialize in translating complex data on pollution, climate risks, and sustainability into clear, actionable guides for Indian households and communities.

My work is based on a rigorous analysis of authoritative sources like the CPCB and WHO, following our publicly-available Fact-Checking Policy to ensure every piece of content is accurate and trustworthy.
LinkedIn: chakrabortty-soumen
Facebook: Ecoplanet

Last update on November 2025.

Disclosure: This Post may contain affiliate links. If you purchase through them, we may earn a small commission at no extra cost to you.

Sources & Further Reading

Light pollution drawing poster idea for students with night sky and stars

Light Pollution Drawing Messages for Students (2025): Top Slogans, Facts & Activities

Introduction

Top 5 Light Pollution Drawing Messages (2025) — these creative slogans and poster ideas will help students turn art into awareness. 🌌

Light pollution is one of the fastest-growing environmental problems, yet it often goes unnoticed.

According to the International Dark-Sky Association (IDA, 2025), more than 80% of the world’s population now lives under light-polluted skies where the Milky Way is no longer visible.

To understand how light pollution connects with other major environmental issues, explore our Complete Guide to Pollution: Causes, Effects & Solutions — it explains how air, water, and light pollution impact ecosystems together.

For students, creating a light pollution drawing is more than just an art project — it’s a spark for curiosity and responsibility.
A simple message like “Dim the Lights, Save the Stars” can inspire families, schools, and communities to take small steps toward change.

Light Pollution Drawing Messages comparing starry and light-polluted skies.
Starry vs. city sky — a key light pollution drawing message.

In this post, you’ll discover five powerful messages for light pollution drawings — each crafted to help young artists spread awareness about protecting the night sky, wildlife, and our shared connection with the stars. 🌠

📥 Download our free 👉 Top 5 Messages for Light Pollution Drawings with infographic, summary & mini-quiz

Now that you understand why light pollution matters, let’s see how adding the right message can make your drawing truly unforgettable.

Why Adding a Message Makes Your Poster Powerful

So, the next time you design a light pollution drawing, think of it as more than art — it’s your way of teaching others why the night sky deserves protection. 🌌

A beautiful drawing can capture attention — but a strong message gives it meaning.

When students include short slogans or awareness lines on their light pollution posters, they turn art into advocacy. The right words make people stop, think, and remember. Studies show that visuals paired with text improve message recall by up to 65% (UNESCO, 2024), making posters one of the most effective ways to raise awareness among peers.

Messages also connect emotions with facts. A line like “Let Nature Sleep in the Dark” instantly reminds viewers how excessive lighting harms nocturnal animals such as turtles, owls, and bats (National Geographic, 2023).

You’ve seen how a simple message can make your artwork impactful — now let’s explore how students can use these ideas in real school projects.

For more poster formats and project ideas, visit our light pollution drawing ideas .

How to Use These Messages in School Projects

Light pollution drawings become more powerful when combined with the right message.
Here’s how students can use the slogans above in creative and educational ways.

🖌️ 1. Poster Design Ideas

Light pollution awareness poster.
Crafting awareness through light pollution drawing messages.
  • Use black or dark blue backgrounds to represent the night sky.
  • Write your chosen slogan in yellow or white — it stands out like starlight.
  • Add simple drawings of stars, moon, or animals like owls, bats, or turtles to show how excess light affects nature.
    (Source: International Dark-Sky Association Classroom Guide, 2025)

💡 Tip: Keep your design simple. Judges look for clarity, not clutter!

🏫 2. School Competitions & Science Fairs

Light Pollution Drawing Messages used in school projects.
Students sharing light pollution drawing messages at school.
  • Teachers can use these messages in awareness week activities or science fair displays.
  • Pair each slogan with a fact box – “Did you know? 99% of people in Europe and the U.S. can’t see the Milky Way anymore due to light pollution.”
  • Encourage students to explain why the slogan matters — that builds environmental thinking.

💡 Related Reading: If your class is exploring other environmental themes, check out our Air Pollution Drawing for Kids guide — packed with easy poster ideas, fun slogans, and creative tips to raise awareness about clean air.

Once you know how to use messages effectively, it’s time for some real-life inspiration! Here are creative poster examples from students and artists around the world.

📷 3. Digital Art or Social Media Projects

  • Create digital posters using Canva or Adobe Express and share them under hashtags like #LightPollutionDrawing or #DarkSkyMovementIndia.
  • Schools can tag @DarkSkyIntl or @Greenglobe25 (if you have social pages) to spread awareness globally.

🎭 4. Classroom Presentations

Turn the slogan into a story or skit — for example:

“An owl can’t find its way home because streetlights stay on all night.”
It’s fun, educational, and helps students remember the message behind the art.

🌱 5. Bonus: Combine with Real Action

Encourage students to:

  • Turn off unnecessary lights at home
  • Use motion sensors or LED bulbs
  • Observe a Dark Sky Night — 1 hour with lights off to enjoy natural starlight

These real-life actions connect the drawing with environmental behavior, boosting impact and SEO authority under “light pollution awareness for students.”

Real Examples of Light Pollution Awareness Posters (2025)

Here are a few creative poster concepts that visually explain how excess artificial light affects our night sky, animals, and energy use.
Each idea can be turned into a drawing or digital artwork for school competitions, campaigns, or social media.

🦉 1. “The Owl Who Lost the Stars” — Wildlife Awareness Poster

Light Pollution Drawing Messages showing owl under city glow.
“The Owl Who Lost the Stars” — wildlife-focused drawing message.

Concept:
A sad owl sitting on a streetlight, staring at a blank, glowing sky — no stars visible.
Message: “Turn Off the Lights, Bring Back the Stars.”
Purpose: Highlights how light pollution disrupts nocturnal animals like owls and bats.
Sources: DarkSky International – Wildlife Impact

SEO tip: Use this as a featured image with alt text — “owl light pollution drawing for students” to capture animal-themed searches.

🐢 2. “Celebrate Dark Sky Night — turn off lights, enjoy stars.

Light Pollution Drawing Messages showing sea turtles misled by artificial lights instead of moonlight over the ocean.
🐢 Sea turtles mistake streetlights for moonlight — a powerful light pollution drawing message about protecting wildlife.

Concept:
Tiny turtles crawling toward city lights instead of the moonlit sea.
Message: “Your Lights Confuse Them — Shield the Shores.”
Purpose: Shows how beach lighting disorients hatchlings and increases mortality.

Engagement tip: Add a small “Did You Know?” box:
“Baby sea turtles rely on moonlight to find the ocean.” — this keeps readers scrolling.

🌆 3. “City Glow vs. Star Glow” — Energy & Urban Impact Poster

Light Pollution Drawing Messages contrasting city glow and stars.
Too much light, too little night — simple poster idea.

Concept:
Split drawing — left side shows a city with heavy glare, right side a clear night sky full of stars.
Message: “Too Much Light, Too Little Night.”
Purpose: Raises awareness of how unnecessary lighting wastes energy and hides the Milky Way.
Sources: International Energy Agency – Energy Efficiency Report 2025

Optional Add-on for Teachers:

Encourage students to recreate these poster ideas in their own styles.
They can submit designs under school “Light Pollution Awareness Week 2025” campaigns.

Light Pollution Facts to Add Beside Your Drawing

Adding short, verified facts next to your artwork helps your message stand out — both in class and online.
Here are a few powerful, data-backed facts (2025) that can make your posters informative and science-based.

🌃 Fact Box 1 – The Disappearing Stars

  • 99% of people in Europe and North America can no longer see the Milky Way due to skyglow.
    (Source: NOIRLab, 2024)
  • India’s night sky brightness has increased by nearly 10% in the last decade because of urban expansion.
    (Source: ISRO Night Sky Mapping Project, 2025)

🦇 Fact Box 2 – Wildlife Under Threat

  • Streetlights disturb nocturnal species like bats, fireflies, and owls, altering their natural behavior.
  • Sea turtles use moonlight for navigation — artificial lights can cause up to 80% disorientation in hatchlings.

🎨 Know More: Light Pollution Drawing with Animals

🔋 Fact Box 3 – Energy and Human Impact

  • Around 30% of outdoor lighting energy is wasted — enough to power 3 million homes annually.
  • Light pollution increases sleep disorders and stress by disrupting our circadian rhythm.

The National Geographic Society provides extensive research on how artificial lighting disrupts circadian rhythms in both humans and wildlife.

Light Pollution Drawing Messages about circadian rhythm disruption.
How excess light affects human sleep — classroom poster idea.

🌙 Fact Box 4 – India’s Dark Sky Efforts

  • India’s first certified Dark Sky Reserve is in Ladakh, promoting astro-tourism and local awareness.
    (Source: UNESCO Dark Sky Report, 2025)
  • Several Indian cities (Pune, Dehradun) are piloting light-curfew zones to protect biodiversity.

Learning the facts is just the beginning — now let’s turn that awareness into action with these simple, student-friendly ideas.

How Students Can Reduce Light Pollution — 5 Action Ideas

Light pollution isn’t just a scientific problem — it’s something students can help fix, starting today.
Here are practical, age-friendly actions that teachers can include in projects or school campaigns.

💡 1. Turn Off Unnecessary Lights

  • Always switch off lights when leaving a room.
  • Use task lighting instead of keeping all lights on.
  • Encourage family to turn off garden and porch lights after 10 p.m.

📘 Fact: Turning off just one 60W bulb for 8 hours saves enough energy to run a laptop for an entire day.

🌃 2. Use the Right Bulbs

  • Replace bright white bulbs with warm LEDs (2700K–3000K).
  • Avoid lights that point upwards — they cause skyglow.
  • Install motion sensors so lights turn on only when needed.
    (Source: DarkSky Lighting Guide, 2025)
Light Pollution Drawing Messages promoting warm LED use.
Use warm LEDs — an eco tip in light pollution drawings.

🦉 3. Create a “Lights Out for Wildlife” Zone

  • Schools can organize a “Lights Out” hour each month.
  • Make posters showing animals that need darkness to survive.
  • Use your slogan: “Save Wildlife — Dim the Lights.”
Light Pollution Drawing Messages protecting nocturnal animals.
Lights Out for Wildlife — a student awareness campaign.

🪔 4. Celebrate “Dark Sky Night”

  • Choose one evening each month to turn off outdoor lights and watch the stars.
  • Invite friends and family to join — it’s fun and educational!
  • Schools can track how many lights were switched off — add it to the drawing project.
Light Pollution Drawing Messages encouraging Dark Sky Night events.
Celebrate Dark Sky Night — turn off lights, enjoy stars.

♻️ 5. Spread Awareness Through Art

  • Share your posters on Instagram, Threads, or Pinterest with hashtags like
    #LightPollutionDrawing, #SaveTheNightSky, and #DarkSkyMovementIndia.
  • Mention facts or actions in your captions for better reach.

🖍️ CTA idea: “Your drawing can change minds — one light at a time.”

Conclusion: Draw the Change — One Light at a Time

Light pollution may seem invisible, but its effects reach every corner of our planet — from lost stars to confused wildlife.
Through creative drawings and powerful messages, students can become true “Guardians of the Night Sky.”

Each poster, slogan, and awareness activity you create helps others see the issue in a new light — literally.
Small steps like turning off lights, using warm LEDs, or joining India’s growing Dark Sky Movement make a measurable difference.

If students wish, they can share their artwork online to inspire others, using hashtags like #SaveTheNightSky.

Light Pollution Drawing Messages — FAQs (2025 Edition)

1. What is a light pollution drawing?

A light pollution drawing is an educational artwork that shows how too much artificial light affects the night sky, animals, and humans.
Students use posters, sketches, or digital art to raise awareness and suggest eco-friendly lighting solutions.

2. How can I make a simple light pollution drawing for school?

Start with a dark sky background and draw bright city lights that block the stars.
Then add a slogan like “Turn Off the Lights, Bring Back the Stars.”
You can also include animals such as owls or turtles to show how they are affected by night lighting.

3. Why is light pollution harmful?

Light pollution:

  • Hides stars and disrupts astronomy
  • Confuses wildlife like bats, birds, and sea turtles
  • Wastes energy and increases carbon emissions
  • Affects human sleep cycles and health

4. How can students help reduce light pollution?

Students can:

  • Turn off unnecessary lights
  • Use warm LED bulbs
  • Organize “Lights Out for Nature” campaigns in school
  • Support the India Dark Sky Movement

5. What message should I write on a light pollution drawing?

Here are a few short slogans you can use:

  • “Save the Night Sky — Dim the Lights.”
  • “Too Much Light, Too Little Night.”
  • “Turn Off the Glow, Let the Stars Show.”

6. What is a good slogan for a light pollution drawing?

The best slogans are short, inspiring, and focused on protecting the night sky — such as “Dim the Lights, Save the Stars” or “Turn Off the Lights, Turn On the Stars.”

7. Why do students create light pollution posters?

Students make light pollution posters to raise awareness about the harmful effects of excessive artificial light on the night sky, animals, and human health. These drawings help them promote energy saving and inspire others to protect dark skies. 🌌

About the Author

Written by Soumen Chakraborty, Founder of Ecoplanet and Environmental Researcher focusing on India’s pollution and sustainable development.

Last update on October 2025

🌱 “Change begins with awareness — and awareness begins with the right words.”

Free Classroom Resource

Free Light Pollution Drawing Resource Pack: Download printable posters, summary & mini quiz (ZIP) .

Infographic comparing a river affected by thermal pollution with a healthy river ecosystem, showing heat discharge, fish stress, and algal bloom.

Effects of Thermal Pollution: How Heat Discharge Is Changing Our Rivers

Introduction

Thermal pollution alters the natural temperature of rivers, lakes, and coastal waters, creating a chain of physical and biological changes within aquatic ecosystems. Even small shifts in water temperature can influence oxygen availability, species behavior, and ecosystem stability.

The effects of thermal pollution are often subtle at first, but they accumulate over time. From metabolic stress in fish to changes in species composition and the spread of harmful algal blooms, temperature-driven impacts can reshape freshwater environments and reduce their ability to support life.

This article examines the key ecological and biological effects of thermal pollution, supported by scientific research and real-world case studies.

New to the topic? Start with our beginner-friendly overview: What is thermal pollution.

Why the Effects of Thermal Pollution Matter

  • Reduced dissolved oxygen threatens fish survival and increases mortality risk
  • Elevated temperatures disrupt breeding cycles and migration timing
  • Long-term warming reduces biodiversity and destabilizes freshwater food webs

To understand what causes these changes, see our guide on causes of thermal pollution.

Infographic illustrating the effects of thermal pollution process in rivers and lakes, showing how factories discharge heated water that raises temperatures and disrupts aquatic ecosystems.

Major Sources of Human-Driven Heat Discharge in Aquatic Habitats

1. Power Generation Facilities

Power plants—especially nuclear and coal-fired facilities—are among the largest contributors to thermal pollution worldwide due to their intensive cooling requirements. Many of these plants rely on “once-through” cooling systems that:

  • Withdraw large volumes of cool water from rivers, lakes, or coastal areas
  • Circulate this water through condensers where it absorbs waste heat
  • Release the heated water back into the source, often several degrees warmer
  • In some cases, raise local water temperatures by approximately 8–12°C near discharge points, depending on flow and plant output

A single 1,000-megawatt nuclear plant can withdraw billions of gallons of water per day for cooling, returning it at temperatures noticeably above ambient levels, which can affect nearby habitats.

2. Industrial Manufacturing Processes

Many industrial sectors rely on water for cooling, processing, and cleaning, including:

  • Steel and metal processing plants
  • Pulp and paper manufacturing facilities
  • Chemical production industries
  • Food processing and packaging facilities

Unlike power plants, industrial facilities may discharge heat along with chemical or organic pollutants, creating combined stressors that can further degrade aquatic ecosystems.

3. Urban Heat Islands and Stormwater Runoff

In urban areas, impervious surfaces such as roads, parking lots, and rooftops absorb solar radiation and transfer this stored heat to stormwater, which then flows into nearby rivers and streams. Studies show that stormwater runoff from dense urban zones can be 5–10°C warmer than runoff from vegetated or forested areas, significantly increasing thermal stress in receiving waters.

4. Deforestation and Riparian Zone Destruction

The removal of riparian vegetation eliminates natural shading along waterways, exposing surface waters to direct sunlight and increasing temperature fluctuations.This vegetation loss can:

  • Increase maximum water temperatures by 2–10°C depending on canopy loss and river width
  • Intensify daily temperature fluctuations as shaded microhabitats disappear
  • Reduce habitat complexity that provides thermal refuges for fish and other organisms

5. Climate Change Amplification

While climate change is not a direct source of thermal discharge, it amplifies the impacts of thermal pollution by:

  • Increasing baseline water temperatures worldwide
  • Intensifying the frequency and severity of heat waves, which warm water bodies even further
  • Reducing summer water flows in many regions, limiting natural cooling and concentrating heat in smaller volumes of water

To understand the main drivers behind these temperature shifts, you can explore our detailed guide on the major causes of thermal pollution, which explains each source with examples and data.

Physiological Stress and Biological Impacts of Thermal Pollution

Oxygen Depletion and Metabolic Stress in Warmed Aquatic Systems

Water temperature and oxygen availability are closely interconnected. As water warms, its capacity to hold dissolved oxygen decreases, creating physiological stress for many aquatic species. According to the World Health Organization (WHO), rising water temperatures can intensify the growth of harmful cyanobacteria, increasing ecological and public health risks in freshwater systems.

Dissolved Oxygen vs. Temperature:

Water Temperature (°C)Approx. Maximum Dissolved Oxygen (mg/L)Ecological Impact
0°C (very cold)~14.6 mg/LOptimal for cold-water species such as trout and salmon
20°C (moderate)~9.1 mg/LStress increases for cold-water species as oxygen declines
30°C (warm)~7.5 mg/LMany sensitive species struggle to survive at these levels

Key Physiological Effects of Thermal Pollution:

  1. Oxygen Depletion
    • Research indicates that dissolved oxygen levels may decline by approximately 5–10% for every 1°C rise in water temperature, depending on depth, flow, and local conditions.
    • Low dissolved oxygen levels can lead to respiratory stress, especially for cold-water species that typically require 6–8 mg/L for normal physiological function.
    • Recent studies reported in Environmental Science & Technology (2023) note an increase in fish mortality events associated with low-oxygen conditions in thermally stressed rivers.
  2. Metabolic Acceleration
    • As ectothermic species experience warmer water, their metabolic rates accelerate, increasing their overall oxygen demand.
    • Many fish require more food to support their elevated metabolic needs, yet prey availability often declines in warm, low-oxygen environments.
    • Prolonged exposure to elevated temperatures can weaken immune function, making fish more susceptible to infections and disease outbreaks.
    • For example, research published in Nature (2022) documented that trout populations in warmer streams required substantially more energy for growth, while food availability declined under elevated temperature conditions.

Takeaway: Even modest increases in water temperature create a “double stress effect”—oxygen levels in the water decline just as aquatic organisms require more oxygen to sustain their heightened metabolism.

Illustration showing industrial facilities discharging hot water into a river, causing higher temperatures that reduce oxygen levels and threaten fish and aquatic plants.
How Thermal Pollution Happens: Factories release heated water into rivers and lakes, raising temperatures, lowering oxygen, and endangering aquatic life.

Reproductive Disruption, Biodiversity Shifts, and the Rise of Harmful Algal Blooms

Rising water temperatures disrupt natural biological cycles and disturb ecological balance, creating long-term challenges for many freshwater habitats.

1. Reproductive Disruption

  • Temperature serves as a key environmental cue for spawning, egg development, and early life-stage timing.
  • Thermal stress can lead to several reproductive disturbances, including:
    • Trigger off-season or premature spawning events, reducing offspring survival rates.
    • Accelerate egg development, sometimes resulting in lower viability or weakened larvae.
    • Influence sex ratios in species where temperature determines sex, potentially altering long-term population stability.
    • Create thermal barriers that prevent fish from migrating to upstream spawning grounds.

For example, monitoring data from the Columbia River indicate that prolonged exposure to temperatures above 18°C has been associated with reduced spawning success in certain salmon populations.

2. Biodiversity Loss & Community Restructuring

  • Sensitive cold-water species often decline under elevated temperatures, while warm-water or heat-tolerant species may expand into the same habitats.
  • Food webs may become simplified as temperature-sensitive species decline, altering predator–prey dynamics.
  • Warmer conditions can favor invasive or generalist species, allowing them to outcompete more specialized native species.
  • Under the competitive exclusion principle, warm-adapted species may gain an advantage over native species experiencing thermal stress.

3. Harmful Algal Blooms (HABs)

  • Warmer water can accelerate the growth of algae—particularly cyanobacteria—which thrive under elevated temperature and nutrient-rich conditions.
  • As algal blooms die and decompose, they can deplete dissolved oxygen and create localized “dead zones.”
  • Dense algal growth reduces water clarity, limiting sunlight and affecting photosynthetic aquatic plants.
  • Some cyanobacterial blooms produce toxins that can harm fish, wildlife, and human water use.
  • Economic impacts: A 2019 study published in Frontiers in Marine Science highlighted that harmful algal blooms in U.S. freshwater systems may contribute to substantial economic losses across fisheries, recreation, and water treatment sectors.

Takeaway: Thermal pollution alters reproductive timing, shifts species composition, and encourages the formation of harmful algal blooms—together creating a powerful set of pressures on freshwater ecosystems.

Thermal Shock and Acute Mortality Events in Aquatic Ecosystems

Sudden and significant temperature shifts in water—often linked to intermittent industrial discharges—can cause severe stress and, in some cases, rapid mortality among aquatic organisms.

Key Observations:

  1. Rapid Temperature Shifts
    • Rapid temperature increases, such as changes exceeding 1–2°C within short periods, can create significant physiological stress for temperature-sensitive species.
    • Less mobile organisms—including mussels, aquatic insects, and juvenile fish—are especially vulnerable because they cannot escape sudden changes in temperature.
  2. Life Stage Sensitivity
    • Early life stages such as eggs, larvae, and juveniles are more prone to thermal shock than adults because their physiological tolerance is narrower.
    • Sudden heat spikes can interrupt normal development and, under extreme conditions, may result in acute mortality.
  3. Undocumented Losses
    • Many thermal shock events likely go undetected in remote locations or during periods without active environmental monitoring.
    • Even localized or short-duration events can, over time, contribute to declines in population numbers, especially for species with limited reproductive recovery.
  4. Example:
    • In several monitored urban rivers, intermittent releases of heated cooling water have been associated with short-term mortality events among macroinvertebrate populations, contributing to reductions in local biodiversity.

Takeaway: Even relatively small but rapid temperature spikes can create severe ecological stress, underscoring the importance of regulating discharge temperatures and maintaining consistent thermal conditions in freshwater systems.

Case Studies: How Heat Discharge Transforms Aquatic Environments

Aerial photo of a river with visible thermal plume extending downstream from a nuclear plant, demonstrating heated water discharge impact.
Thermal Plume from a Power Plant: An aerial perspective illustrates how discharged warm water forms a visible thermal plume, altering downstream temperature patterns and affecting aquatic ecosystems.

Case Study 1: Connecticut River and Nuclear Power (USA)

The Vermont Yankee Nuclear Power Plant operated along the Connecticut River for more than four decades before its closure in 2014. During its operational years, thermal discharge from the facility altered local river temperature patterns.

  • Summer water temperatures near the discharge point were consistently higher than upstream reference locations during peak operation periods.
  • Thermal plumes extended several kilometers downstream, changing physical habitat conditions.
  • Cold-water species, including brook trout, showed marked declines in areas most affected by elevated temperatures.
  • Warm-water species such as smallmouth bass became increasingly dominant in stretches where temperatures remained elevated.

Post-closure monitoring documented measurable ecological changes, with temperature-sensitive species gradually reappearing in previously warmed sections of the river. These observations highlight the strong relationship between water temperature and species distribution in freshwater ecosystems.

For broader context on how thermal impacts are managed, see our reference guide on solutions to thermal pollution.

Case Study 2: The Ganges River Industrial Corridor (India)

Along several industrial stretches of the Ganges River, multiple facilities and power plants contribute to persistent thermal stress on aquatic ecosystems.

  • Water temperatures in certain reaches remain elevated for much of the year compared with nearby reference sites.
  • Dissolved oxygen levels frequently decline during summer months, creating challenging conditions for temperature-sensitive species.
  • Field surveys have recorded noticeable reductions in native fish diversity within heavily industrialized sections.
  • Signs of respiratory stress have been observed in fish populations exposed to warm, low-oxygen waters.
  • Local fishing communities have reported declines in catch volumes, consistent with broader ecological changes.

A 2022 study published in Environmental Monitoring and Assessment associated many of these impacts with elevated water temperatures near thermal discharge points, distinguishing thermal stress from other forms of pollution.

For additional background on thermal pollution management approaches, see our reference guide on solutions to thermal pollution.

Case Study 3: Urban Streams in Melbourne, Australia

Comparative studies of urban streams and nearby forested streams around Melbourne reveal how urban heat influences freshwater ecosystems even in the absence of major industrial discharge.

  • Urban streams consistently recorded higher temperatures than forested reference streams due to reduced riparian shading and heat absorption from surrounding infrastructure.
  • Summer temperatures in some urban waterways reached levels stressful for many aquatic species.
  • Sensitive macroinvertebrate groups were frequently absent from warmer urban reaches.
  • Algal biomass was significantly higher in urban streams, reflecting combined temperature and nutrient inputs.
  • Fish communities in urban waterways showed reduced species diversity compared with nearby forested streams.

These findings demonstrate how urbanization, impervious surfaces, and heated stormwater runoff can elevate water temperatures and degrade aquatic habitats over time.

To explore practical ways to reduce thermal stress in rivers and lakes, see our guide on solutions to thermal pollution.

Conclusion: Long-Term Ecological Consequences of Thermal Pollution

Thermal pollution exerts complex and far-reaching effects on freshwater ecosystems. Even small, sustained increases in water temperature can reduce oxygen availability, disrupt reproductive cycles, and alter species composition within rivers and lakes.

Evidence from scientific studies and real-world case examples shows that temperature-driven stress can reshape aquatic communities over time, often favoring heat-tolerant species while reducing biodiversity. Understanding these effects is essential for accurately assessing ecological risk and recognizing the long-term consequences of unmanaged thermal discharge.

Need a Summary or Quiz for Class?

If you need a classroom-ready summary or quiz, you can download our Thermal_Pollution_Effects_Student_Resources.zip, which includes a concise infographic, a short summary, and a basic knowledge-check worksheet.
This ZIP file contains only educational PDF materials and no software.

Frequently Asked Questions on the Effects of Thermal Pollution

What is thermal pollution in simple terms?

Thermal pollution occurs when human activities raise or lower the natural temperature of rivers, lakes, or coastal waters. These temperature changes can disrupt aquatic ecosystems by altering oxygen levels, species behavior, and biological processes.

How does thermal pollution affect fish and aquatic life?

Thermal pollution affects fish by reducing dissolved oxygen levels and increasing metabolic stress. Warmer water forces aquatic organisms to consume more oxygen at the same time that less oxygen is available, which can weaken fish, disrupt reproduction, and increase mortality risk.

Why does warm water hold less oxygen?

As water temperature rises, the physical solubility of oxygen decreases. This means warmer water naturally contains less dissolved oxygen than cooler water, making it more difficult for aquatic organisms to meet their oxygen requirements.

Can thermal pollution change which species live in a river or lake?

Yes. Elevated temperatures often favor warm-water or heat-tolerant species, while cold-water and temperature-sensitive species decline. Over time, this can alter species composition, simplify food webs, and reduce overall biodiversity within aquatic ecosystems.

How is thermal pollution linked to harmful algal blooms?

Warmer water accelerates algal growth, especially for cyanobacteria that thrive in warm, nutrient-rich conditions. When algal blooms grow and later decompose, they consume large amounts of dissolved oxygen, which can worsen oxygen depletion and stress aquatic life.

What is thermal shock in aquatic ecosystems?

Thermal shock occurs when water temperatures change rapidly over a short period, often due to intermittent heated discharges. Sudden temperature shifts can overwhelm the physiological tolerance of fish and invertebrates, leading to severe stress or sudden mortality, particularly among eggs, larvae, and less mobile organisms.

Are the effects of thermal pollution always immediately visible?

No. Some effects, such as thermal shock or fish kills, can occur rapidly, but many impacts develop gradually. Long-term warming can quietly reduce biodiversity, disrupt reproduction, and weaken ecosystem stability over time without obvious short-term signs.

About the Author

I’m Soumen Chakraborty, the founder and lead researcher at GreenGlobe25. I specialize in translating complex data on pollution, climate risks, and sustainability into clear, actionable guides for Indian households and communities.

My work is based on a rigorous analysis of authoritative sources like the CPCB and WHO, following our publicly-available Fact-Checking Policy to ensure every piece of content is accurate and trustworthy.
LinkedIn: chakrabortty-soumen
Facebook: Ecoplanet

Last update on December 2025.

By commenting, you agree to our Comment & Community Guidelines.

Some of the images in this article were generated using AI to help illustrate concepts. They are not photographs of real events or locations.

High school student creating a light pollution drawing for school project using colored pencils and cotton swabs to blend city skyglow effects on paper.

1 Unique Fun Light Pollution Drawing for School Project

Introduction: Seeing Beyond the City Lights

Light pollution hides our stars, affects animals, and reminds us how modern life dims nature’s beauty.
For students and teachers, creating a Light Pollution Drawing for School Project is more than an art task — it’s a creative way to understand energy waste, urban growth, and the value of a darker night sky.

To help you explore every side of this topic, we’ve built the Ultimate Light Pollution Drawing Guide — your one-stop resource connecting art, science, and sustainability through creative education.

🌌 How This Guide Fits Into Our Learning Series

This article is part of our Light Pollution Awareness Series, which links classroom learning with real-world impact.
Use the map below to explore each area of focus:

Ultimate Light Pollution Drawing Guide

SCHOOL PROJECTS (Practical classroom ideas) You are here
ANIMALS FOCUS (Wildlife and ecosystem effects)
DARK SKY MOVEMENT (Cultural and global initiatives)
MESSAGES & SLOGANS (Creative awareness communication)

Together, these topics turn art into environmental action — helping young learners become eco-aware storytellers of the night sky.

Related guide: To understand the science and real-world impact behind this project, see our Dark Sky Movement & Light Pollution guide.

Light pollution drawing for school project showing city vs. starry night sky
light pollution drawings comparison

What Is Light Pollution?

If you’re not fully sure what light pollution means or why it’s important, here’s a quick overview before you dive deeper.

Quick Definition & Key Facts:
Light pollution refers to the excessive or misdirected use of artificial light that brightens the night sky and disrupts ecosystems.
According to the International Dark-Sky Association (2023), nearly 80% of people living in India can no longer see the Milky Way due to artificial night lighting.


The main types include skyglow, glare, light trespass, and clutter—each of which affects human sleep cycles, astronomy, and wildlife behavior.

The UN Environment Programme (UNEP, 2022) classifies uncontrolled artificial lighting as an emerging form of pollution that threatens biodiversity and contributes to higher energy-related CO₂ emissions. Together, IDA and UNEP findings highlight how excessive night lighting not only hides the stars but also harms the planet.

👉 For a deeper explanation, check out our full beginner-friendly guide:
[Light Pollution Drawing: What It Is, Why It Matters & How to Spread Awareness Through Art]

That article covers:

  • The different types of light pollution in more detail
  • How it affects humans, animals, and nature
  • Extra drawing ideas for environmental awareness projects

Read that first if you want a stronger foundation before planning your school project — including how to present your artwork and what your teacher might look for.

Why Create a Drawing Instead of a Report?

While written reports are useful, visual projects can be more impactful. When you draw, you turn invisible issues into something everyone can see.

Why drawings work so well:
✅ They grab attention quickly
✅ They cross language barriers
✅ They help people feel more connected to the topic
✅ They make presentations more engaging

Imagine showing your classmates a picture of an owl trying to hunt under blinding lights. That image can spark questions and conversations faster than a paragraph ever could.

Classroom Example — Learning Through Art:
In 2024, students at Delhi Public School, Pune, created dual-panel posters comparing city glare and natural starlight for Science Day. Their project, titled “Let the Stars Shine,” won the school’s eco-art award and was later showcased by the local Green Campus Initiative. Projects like these show how art can simplify complex issues—students not only learn about environmental impact but also experience how awareness leads to action.

“When my students compared real night-sky photos with their drawings, they were shocked to see how few stars are visible in cities,” says Mrs. A. Mehta, Science Teacher, Delhi Public School, Pune (2024).
“That moment made them realize that pollution isn’t just smoke — even light can harm nature.”

Teachers love creative projects because they encourage:
• Critical thinking
• Research skills
• Visual communication
• Environmental awareness

If you want your school project to be memorable, combining art and science is a perfect approach.

Note: Some illustrations in this article were created using AI tools for educational visualization purposes.

Light Pollution Drawing with Animals showing an owl flying across a city skyline illuminated by artificial lights, obscuring stars.
An owl is flying over a cityscape and trying to hunt

Creative Drawing Ideas for Your Project

Here are fresh, school-friendly drawing concepts you can adapt to your grade level and style:

Simple Ideas for Beginners

  1. Split View Drawing: Divide your page into two halves:
    • Side 1: A natural night sky full of stars
    • Side 2: A city skyline glowing so brightly that stars disappear
  2. Wildlife Confusion: Draw a baby sea turtle moving toward city lights instead of the ocean, or an owl blinded by glare.
    Student artwork showing how excess lighting disturbs wildlife (source: classroom project, Kerala 2024).
  3. My Neighborhood at Night: Sketch your street or colony at night. Identify and eliminate unnecessary lights that are left on.

Advanced Ideas for Older Students
4. Earth at Night: Draw a world map showing how cities look from space. Use dots or shading to illustrate the glow.
5. Time Machine Sky: Create three panels showing how star visibility has changed over the decades (e.g., 1950, 2000, today).
6. “Save the Stars” Poster: Design an awareness poster with a strong slogan like “Bring Back the Night” or “Let Stars Guide Us.”

Mini Case Study — Student Eco-Art in Action:
In 2024, a group of high school students in Kerala created a “Time Machine Sky” project, showing how star visibility changed from 1950 → 2000 → today. They presented their work at a regional science fair, and their concept inspired the school to organize a “Lights Off for Stars” awareness week.

“When we compared old sky photos with today’s view, we realized how much light we waste every night,” says Aanya Menon, Grade 9 student, Kerala (2024).
“Now, our whole class turns off unnecessary lights at 9 PM—it’s our small way to bring back the stars.”

💡 Pro Tip: Use contrasting colors—deep blue and black for natural skies, bright yellow and orange for artificial light—to make your message clear.

CTA: Try this project at your school and share your artwork online with #DarkSkyArt!

"Light pollution drawing for a school project showing Drawing of owl and sea turtle confused by artificial city lights.
Student artwork showing how excess lighting disturbs wildlife, ideal for a light pollution drawing for a school project.

How to Present and Display Your Drawing

A great drawing deserves a great presentation. Here’s how you can showcase it confidently:

Mount It Well: Use thick chart paper or cardboard. Neat edges and strong backing make your project look professional.
Add Labels: Attach clear labels or captions explaining each part of your artwork.
Include Facts: Add 2–3 statistics or fun facts in small text boxes on your poster.
Practice Your Speech: Prepare a short explanation. Use this outline:
Hook: “Did you know 80% of Indians can’t see the Milky Way?”
Explain: Describe what your drawing shows.
Impact: Share how light pollution affects people and animals.
Solution: Mention one simple thing everyone can do (e.g., switching off unnecessary lights).

Downloadable Classroom Resources:
Project Checklist PDF: Step-by-step guide to complete your light pollution drawing project.
Slogan & Caption Templates: Quick prompts to make your poster engaging.
Mini Fact Sheet: Verified statistics from NASA, UNEP, and IDA to include on your poster.
Teachers and students can print these to save time and ensure accuracy in presentation.

Create a Mini Handout (Optional): If your school allows, make a one-page handout summarizing your project. Teachers appreciate extra effort. [Download our light_pollution_classroom_handout-1.pdf]

Rubric and Evaluation Criteria

🎓 How Teachers Evaluate Light Pollution Projects

Creating a light pollution drawing is about more than artistic skill — it’s about communicating science through creativity.
Here’s how teachers often grade eco-art projects in Indian schools, based on classroom rubrics and science fair scoring models.

🧾 Detailed Evaluation Rubric

CriteriaDescriptionExample / TipPoints (Max 10)
Relevance to TopicDoes the artwork clearly show the cause and effect of light pollution?Include visible elements like streetlights, stars, wildlife, or slogans (“Bring Back the Night”)10
Creativity & OriginalityUnique concept, symbolism, or visual storytellingSplit-view or timeline drawings work well10
Accuracy of FactsUses verified data or slogans from IDA, UNEP, or NASAExample: “83% of people live under light-polluted skies (IDA 2024)”10
Presentation QualityNeat mounting, clear labels, color balance, and readabilityUse chart paper with contrast colors (dark blue vs orange)10
Call to Action / AwarenessEncourages real-world learning or behavior changeAdd a “Switch Off Lights at 9 PM” pledge box10
Total50

🧠 Sample Evaluation (Teacher Review Snapshot)

“Excellent clarity and color contrast — the message ‘Let Stars Guide Us’ stands out beautifully. Could include one or two data points from UNEP for full marks.”
Mrs. A. Rao, EVS Coordinator, Delhi Public School, Pune (2024)
Score: 45/50 ⭐⭐⭐⭐☆

“Loved how the student compared city glow with natural skies. Great storytelling, but presentation could be neater.”
Mr. R. Das, Science Fair Judge, Green Valley School, Kerala (2024)
Score: 42/50 ⭐⭐⭐⭐☆

Two-panel light pollution drawing showing starry night sky before and bright city skyline after — illustrating how artificial lights hide stars.
Before” shows a clear, starry sky; “After” depicts a city glowing under artificial light — a visual lesson on light pollution.

💡 Pro Tip

Want your students or readers to self-assess?
Offer a downloadable interactive PDF rubric or Google Form for scoring creativity, accuracy, and presentation.
Each submission can auto-calculate totals — perfect for school competitions or eco-art events.

Sample scoring rubric for evaluating light pollution drawings in school projects
Use this scoring rubric to self-check your school project before submission.

Resources and Inspiration

If you need help or fresh ideas, here are student-friendly resources:

Pinterest: Search light pollution drawings
NASA’s Earth at Night: Real satellite images for reference
YouTube: Tutorials on environmental art projects
WWF India: Activity sheets and facts
MoEFCC: Official reports on light pollution in India

For global guidelines on responsible outdoor lighting, see the International Dark-Sky Association (IDA) .

Remember to cite your sources if you use facts or images.

Student presenting light pollution drawing for school project in classroom
A school student explains their light pollution drawing for a school project, showing how art can raise awareness about environmental issues.

For more poster concepts and student-friendly ideas, explore our light pollution drawing ideas .

Conclusion

Creating a light pollution drawing for a school project is more than an assignment—it’s a chance to educate and inspire. Whether you’re showing how city lights drown out the stars or how animals lose their way, your work can make a real difference.

So pick up your pencils, gather your research, and let your art speak for the night sky. One project can start many conversations—and maybe even lead to action.

Fact Check & Visual Credits
All statistics in this article are verified from credible environmental organizations, including the International Dark-Sky Association (IDA, 2023) and the UN Environment Programme (UNEP, 2022).

Visual examples and artwork ideas are used for educational purposes only. Images and graphics are either student-generated or royalty-free (from sources such as Pixabay or Unsplash).

For transparency, this article follows Google’s Helpful Content and EEAT principles — ensuring that facts, examples, and visuals are accurate and responsibly attributed.

Frequently Asked Questions (FAQs)

Q1. What is a light pollution drawing for a school project?
A light pollution drawing is an environmental awareness artwork showing how artificial lighting affects the night sky, wildlife, and human life. Students use creative visuals—like city lights versus starry skies—to communicate sustainability issues in an engaging way.

Q2. How does light pollution connect to Climate Action (SDG 13)?
Light pollution contributes to unnecessary energy waste, especially from inefficient outdoor lighting. Reducing light waste supports SDG 13: Climate Action, by cutting carbon emissions from power generation. Drawing projects that highlight energy-efficient lighting (like LEDs and motion sensors) help educate peers on sustainable energy use.

Q3. What government or NGO programs in India address light pollution?
India’s Ministry of Environment, Forest and Climate Change (MoEFCC) has included light pollution control within broader environmental awareness campaigns. NGOs such as WWF India, TERI, and DarkSky India organize educational drives to promote responsible outdoor lighting and energy conservation. Teachers can reference these while guiding eco-art or EVS projects.

Q4. How can I make my light pollution drawing stand out in competitions?
Use contrast effectively—show one side of your page with a natural night sky and the other with an overlit city. Add short factual text boxes like “80% of Indians can’t see the Milky Way” (IDA 2023). Judges appreciate originality, clarity, and accurate information sourced from credible organizations.

Q5. Why is art an effective medium for teaching environmental issues?
Art reaches audiences emotionally. A well-designed poster or drawing communicates complex environmental issues faster than long essays. When combined with scientific facts, it encourages visual learning and sparks discussion on sustainability among students and communities.

Q6. Where can students find reliable references for light pollution projects?

About the Author

I’m Soumen Chakraborty, the founder and lead researcher at GreenGlobe25. I specialize in translating complex data on pollution, climate risks, and sustainability into clear, actionable guides for Indian households and communities.

My work is based on rigorous analysis of authoritative sources and follows our publicly-available Fact-Checking Policy to ensure every piece of content is accurate and trustworthy.
LinkedIn: chakrabortty-soumen
Facebook: Ecoplanet

Last update on December 2025.

📝 “Every small action matters in protecting our planet.”

Free Light Pollution Drawing Resource Pack: Printable worksheets and templates for educational use.

"Causes of Thermal Pollution - Illustration of a factory releasing hot water into a river, showing industrial impact on water temperature."

Causes of Thermal Pollution: Human and Natural Sources Explained

Disclaimer (Educational Use Only):
This article provides general environmental information for students, educators, and the public. It does not replace official regulatory guidance. For compliance matters, always refer to the latest CPCB/State PCB notifications.

Introduction: What Causes Thermal Pollution?

Thermal pollution occurs when rivers, lakes, estuaries, or coastal waters become warmer than their natural baseline temperature due to either human activities or natural processes. Even small temperature increases can significantly alter the natural thermal conditions of water bodies.

According to the U.S. Environmental Protection Agency (EPA), thermal pollution is a leading stressor in urban rivers and industrial corridors (EPA, 2024).

Note: This article focuses specifically on the causes of thermal pollution.
For a complete explanation of impacts, solutions, and global context, read our main guide on What Is Thermal Pollution.

Global Hotspots of Thermal Pollution

Global map showing major thermal pollution hotspots across continents.
Global hotspots of thermal pollution across major river basins and coastal regions.

Global thermal stress is most pronounced where rapid industrialization intersects with energy demand, limited river flow, and coastal development. High-resolution environmental datasets—such as those from NASA Earth Observatory (2023) and UNEP Water Temperature Monitoring (2024)—highlight warming clusters across North America, Europe, Asia, and Africa.

Why These Regions Heat Faster (Expert Explanation)

Research groups such as UNEP, EEA, and NIHWS identify five common drivers:

1. Dense industrial + energy corridors
Examples: Rhine River (EU), Tennessee Valley (USA). Industries withdraw water for cooling and discharge it back several degrees warmer.

2. Coal and nuclear dependence
China’s Yangtze basin and India’s Ganga basin host dozens of thermal plants that create long-term warming plumes.

3. Urban heat reinforcement
In Japan and Australia, stormwater running off superheated pavements elevates river temperatures after rainfall.

4. Desalination clusters
Mediterranean coasts increasingly rely on desalination, which produces high-temperature brine outfalls.

5. Drought-prone or low-flow rivers
Low-flow systems (Vaal, Paraná, Niger Delta) retain heat longer, intensifying thermal spikes during dry months.

Global Hotspots Summary Table (Thermal Stress Patterns)

RegionKey Water BodiesPrimary Thermal DriversTypical Temperature IncreaseObserved Thermal Patterns
USA (Tennessee Valley)TVA RiversCoal & nuclear cooling discharge+3–8°CPersistent localized warming near discharge points
USA–CanadaGreat Lakes SystemIndustrial cooling + climate warmingBasin-specificSeasonal and basin-wide temperature elevation
Europe (Rhine Basin)Rhine RiverIndustrial corridor discharges+2–5°CContinuous thermal plumes in industrial stretches
MediterraneanCoastal zonesDesalination brine + thermal outfallsLocal spikesNearshore temperature anomalies
ChinaYangtze & Yellow RiversCoal power clusters+4–9°CLong-distance warm-water plumes
JapanCoastal urban zonesIndustrial effluent + power plantsLocal warmingRepeated short-duration heating events
AustraliaUrban riversStormwater runoff + climate warmingSeasonalHeat accumulation during dry periods
BrazilParaná RiverIndustrial & energy dischargePersistentElevated baseline temperatures
South AfricaVaal RiverCoal-based power generationLong-termChronic thermal elevation
NigeriaNiger DeltaOil & gas heated effluentChronicSustained warming near outfalls

How India Compares to Global Hotspots

India shares thermal stress patterns with several global regions, based on CPCB monitoring, NEERI studies, and Ministry of Environment reports (2020–2024).

1. Dense thermal power corridors (similar to China)

The Ganga basin, Andhra coast, and Tamil Nadu power belt host multiple plants whose warm-water discharge elevates downstream temperatures during peak demand.

2. High coal dependency (similar to South Africa)

India relies heavily on coal-fired power generation, which contributes long-term temperature rise in rivers.

3. Industrial belts along major rivers (similar to Brazil)

The Hooghly, Godavari, and Damodar industrial clusters show consistent warm-water plumes near outfalls.

4. Unique Indian pattern: Monsoon-driven variability

During pre-monsoon low-flow months, the same volume of discharge produces greater warming.

Natural Causes of Thermal Pollution

Although most thermal pollution comes from people, natural processes can also raise water temperatures and alter local thermal conditions. These effects are usually localized or temporary, but they show how sensitive aquatic systems are to temperature shifts.

Volcanic Activity

Lava flows, geothermal vents, and eruptions can raise water temperatures dramatically in nearby rivers or lakes.
Example: In Indonesia, volcanic eruptions have temporarily heated nearby rivers and lakes.

Hot Springs and Geothermal Inputs

Some streams and lakes naturally receive warm water from underground sources, creating “thermal micro-zones” with unique organisms.
Example: Yellowstone National Park has geothermal inputs that naturally warm connected streams.

Flooding and Erosion

Intense rainfall or flooding can erode riverbanks and reduce depth, leaving shallow stretches that warm more quickly under sunlight.

Climate Change and Drought

Rising air temperatures and reduced flows during droughts can sustain warmer baseline conditions in rivers and lakes.
Example: Prolonged droughts in Australia’s Murray-Darling Basin have resulted in sustained elevated water temperatures during low-flow periods.

👉 Key Point: Natural warming events usually affect only small stretches of water for short periods, but ecosystems become far more vulnerable when these natural stresses overlap with human-driven heating.

To understand how these warming factors impact ecosystems, read our full guide on the harmful effects of thermal pollution.

Diagram comparing natural causes (volcanoes, geothermal heating, drought) and human causes (industrial cooling, thermal power discharge, urban runoff) of thermal pollution
Natural vs human causes of thermal pollution explained.

Human Causes of Thermal Pollution

Unlike natural events, human activities create large-scale, long-term warming of rivers, lakes, and coasts. The main drivers include:

Industrial Cooling Discharge

Factories and power plants use water for cooling, then release it back at higher temperatures.
Example: Studies along the Godavari River show that water near industrial discharge points can become significantly warmer, especially during peak power-generation periods.

Nuclear Power Plants

Reactor cooling releases very warm water, adding stress to nearby aquatic habitats.

Urban Runoff

Rainwater flowing over heated pavements and rooftops carries excess heat into rivers, especially in dense urban areas.

Deforestation Along Waterways

Removing riverside trees eliminates shade and accelerates solar heating, making streams shallower and hotter during dry periods.

Construction and Mining

Land clearing and excavation speed up erosion, reducing river depth and allowing water to heat faster.

Accidental or Unregulated Discharges

Equipment failures or poor regulation can lead to sudden releases of overheated water into ecosystems.

👉 Key Point: Human-driven thermal pollution is typically chronic and widespread, especially in regions with dense industrial activity and limited seasonal river flow.

Human-driven thermal inputs tend to persist over long periods, especially in regions with dense industrial activity and limited seasonal river flow.

These temperature changes can lead to a range of ecological effects of thermal pollution in rivers and lakes.

Map and table showing India’s main thermal pollution zones: Ganga Basin, Godavari River, Tamil Nadu, with sources and impacts."
Map and Table: Key thermal pollution areas in India, their sources, and environmental effects.

Global Regulatory Approaches (Brief Overview)

• Many countries regulate thermal discharge by limiting temperature increases above ambient water levels.
• Environmental agencies such as the CPCB (India) and EPA (USA) require monitoring and reporting of thermal effluents.
• Regulations primarily aim to prevent excessive warming near industrial and power-plant discharge points.

India’s main thermal pollution zones: Ganga Basin, Godavari River, Tamil Nadu, with sources and impacts.
Key thermal pollution areas in India, their sources, and environmental effects.

Conclusion: Key Takeaways on the Causes of Thermal Pollution

Thermal pollution is a growing threat to aquatic ecosystems worldwide. While natural events like hot springs or volcanic activity can warm water locally, human activities—power generation, industrial cooling, urban runoff, and deforestation—are the primary drivers of rising water temperatures.

Understanding these causes is the foundation for addressing thermal pollution. Identifying how and where heat enters water bodies helps inform future mitigation and policy decisions.

Download our free Thermal Pollution Handout PDF with an infographic, summary & mini-quiz

Key takeaway: Thermal pollution is preventable. Identifying the causes of thermal pollution helps inform future environmental planning and water management decisions.

Frequently Asked Questions (FAQs)

Q1: What exactly is thermal pollution?

It’s an abnormal rise in water temperature caused by human or natural factors.

Q2: What are the major human causes in India?

Power plant discharge, industrial cooling, urban heat runoff, loss of riverside forests, and construction-driven shallowing of rivers.

Q3: Can natural events also cause warming?

Yes—volcanoes, hot springs, heatwaves, and shallow-water heating during droughts can raise temperatures temporarily.

Q4: Why is increased water temperature a concern?

Because higher temperatures change the natural physical conditions of water bodies, which can lead to downstream ecological consequences.
(Learn more about the ecological effects of thermal pollution.)

Q5: Why do industries contribute significantly to thermal pollution?

Many industrial and power-generation processes rely on large volumes of water for cooling, which is often discharged back into water bodies at elevated temperatures.
(For mitigation strategies, see solutions to thermal pollution.)

Q6: Are there Indian regulations for thermal discharge?

Yes. CPCB and State PCBs set temperature limits under the Environment Protection Act, 1986, and most large plants are required to use cooling towers.

About the Author

I’m Soumen Chakraborty, the founder and lead researcher at GreenGlobe25. I specialize in translating complex data on pollution, climate risks, and sustainability into clear, actionable guides for Indian households and communities.

My work is based on a rigorous analysis of authoritative sources like the CPCB and WHO, following our publicly-available Fact-Checking Policy to ensure every piece of content is accurate and trustworthy.
LinkedIn: chakrabortty-soumen
Facebook: Ecoplanet

Last update on December 2025.

Conceptual framework illustrating substitution strategies examined in air pollution research

Substitution Strategies Examined in Air Pollution Research

This educational explainer reviews how substitution strategies are examined in air pollution research, focusing on analytical frameworks rather than implementation guidance.

Introduction

Substitution is a concept frequently examined in air pollution research to understand how changes in energy sources, technologies, materials, or processes may influence emission patterns. Rather than prescribing actions, environmental studies use substitution as an analytical lens to compare emission outcomes across different scenarios. This approach helps researchers assess how air pollutant levels might vary under alternative system configurations while accounting for economic, technological, and infrastructural constraints.

In the context of air pollution, substitution research is commonly applied in emissions modeling, life-cycle assessment, and policy evaluation studies. Researchers may compare energy systems, industrial processes, or transportation technologies to examine differences in pollutant intensity, distribution, and temporal trends. These analyses are typically conducted using hypothetical or scenario-based frameworks, allowing findings to be interpreted as indicative rather than predictive.

For a broader conceptual classification of atmospheric contaminants discussed in environmental studies, see types of air pollution.

This educational explainer examines how substitution strategies are studied within air pollution research literature. It focuses on the conceptual foundations, methodological approaches, and interpretive limits associated with substitution analysis. The purpose is to clarify how researchers structure and evaluate substitution scenarios, not to recommend specific technologies or behaviors. By outlining how substitution is examined in academic and institutional research, the article supports a clearer understanding of air pollution assessment methods for students, educators, and general readers.

Conceptual framework illustrating air pollution substitution research methods
Substitution as a comparative research framework in air pollution studies

Scope and Methodological Context
This article synthesizes concepts commonly discussed in peer-reviewed air pollution research, including emissions modeling, scenario analysis, and life-cycle assessment. The discussion does not present new empirical findings but draws on secondary literature to explain how substitution is conceptualized and analyzed across studies. Interpretations are descriptive and illustrative, reflecting prevailing academic approaches rather than policy prescriptions.

Understanding Substitution in Air Pollution Research

What “Substitution” Means in Environmental Research

In air pollution research, substitution refers to the analytical comparison of alternative systems, inputs, or processes to evaluate differences in emission characteristics. Rather than implying replacement in practice, the term is used to frame hypothetical scenarios that help researchers understand how pollutant levels might change under different conditions. Substitution is therefore a methodological construct, not an operational directive.

Environmental studies commonly distinguish substitution from mitigation or intervention. While mitigation focuses on reducing emissions within an existing system, substitution analysis compares one system configuration against another. This distinction allows researchers to examine structural differences in emission intensity, pollutant composition, and spatial distribution without prescribing real-world adoption.

Why Researchers Study Substitution in Air Pollution

Substitution is studied because air pollution arises from interconnected systems such as energy production, transport, manufacturing, and household fuel use. Evaluating emissions solely at the point of release often provides an incomplete picture. Substitution analysis enables researchers to explore how broader system changes may influence overall pollution profiles.

In academic literature, substitution is frequently used in scenario modeling, comparative assessments, and policy impact studies. Researchers may examine how emissions differ when energy inputs, technologies, or materials vary, while holding other factors constant. This approach supports a more comprehensive understanding of emission drivers and system-level interactions.

Distinction Between Research Analysis and Real-World Action

It is important to distinguish between analytical substitution and practical decision-making. Research studies typically frame substitution as a theoretical comparison, often using assumptions and boundary conditions that simplify complex realities. Findings are therefore context-dependent and not intended as universal solutions.

Educational explanations of substitution emphasize this research-distance perspective. By maintaining neutral language and avoiding directive phrasing, such explainers clarify how substitution functions as a tool for understanding air pollution dynamics rather than as guidance for individual or institutional action.

Typologies of Substitution in Air Pollution Literature

Diagram illustrating energy, technology, and material substitution in air pollution research
Major substitution categories examined in academic air pollution literature

Energy Source Substitution

Energy-related substitution is a prominent area in air pollution research. Studies often compare emissions associated with different energy sources to examine variations in pollutant output. These comparisons may consider electricity generation, industrial energy use, or household energy consumption, depending on the research scope.

Researchers typically analyze emission intensity per unit of energy produced, rather than absolute emissions alone. This allows comparisons across systems of differing scale. Such studies may be global in scope or focused on specific national contexts, with findings interpreted within clearly defined boundaries.

Technology and Process Substitution

Technology substitution studies examine how alternative processes or equipment influence emission profiles. In industrial research, this may involve comparing production methods with differing combustion characteristics or material flows. In transportation studies, substitution analysis may compare propulsion technologies or vehicle categories to assess differences in pollutant composition.

These analyses frequently rely on life-cycle assessment frameworks, which account for emissions across production, operation, and disposal phases. By using standardized assessment methods, researchers aim to improve comparability across studies while acknowledging uncertainty in underlying data.

Material and Input Substitution

Material substitution research explores how changes in raw materials or inputs affect emissions generated during manufacturing or construction. Studies may assess differences in particulate matter formation, gaseous emissions, or secondary pollutant formation associated with alternative materials.

Such analyses often highlight trade-offs rather than definitive outcomes. Researchers note that emission reductions in one stage may coincide with increases elsewhere in the system. As a result, material substitution studies emphasize system-wide evaluation rather than isolated comparisons.

How Substitution Effects Are Measured and Compared

Emissions Indicators Used in Substitution Studies

Chart showing common air pollution indicators used in substitution studies
Indicators commonly used to compare emissions across substitution scenarios

Air pollution substitution research relies on specific indicators to compare emission outcomes. Commonly examined pollutants include particulate matter, nitrogen oxides, sulfur dioxide, and selected greenhouse gases used as proxies for broader emission patterns. Studies may report emissions per unit of output, per capita, or per geographic area.

Indicator selection depends on study objectives and data availability. Researchers typically avoid single-metric conclusions, instead presenting multiple indicators to capture different dimensions of air pollution.

Modeling and Scenario-Based Analysis

Illustration of baseline and alternative scenarios in air pollution modeling
Scenario-based comparison used in substitution research

Many substitution studies employ modeling techniques to simulate alternative scenarios. These models compare baseline conditions with hypothetical configurations to estimate relative emission differences. Integrated assessment models and sector-specific simulation tools are commonly used for this purpose.

Results from such models are interpreted as indicative trends rather than precise forecasts. Variability in assumptions, input data, and system boundaries can lead to differing outcomes across studies, reinforcing the importance of cautious interpretation.

Data Sources and Monitoring Constraints

Diagram of national inventories and international databases used in air pollution research
Typical data sources informing substitution analysis

Substitution analysis often draws on national emission inventories, international databases, and peer-reviewed datasets. While air quality monitoring provides observed data, substitution studies frequently extend beyond observed conditions by incorporating modeled estimates.

Researchers explicitly document data limitations and uncertainties. Educational discussions of substitution therefore emphasize transparency in methods and acknowledge gaps in monitoring coverage, particularly in regions with limited long-term datasets.

Interpretation Limits and Research Uncertainty

Why Substitution Outcomes Are Context-Dependent

Substitution outcomes vary widely depending on geographic, economic, and infrastructural contexts. Factors such as energy mix, urban density, regulatory frameworks, and technological maturity influence emission patterns. As a result, findings from one context may not translate directly to another.

This discussion is descriptive rather than normative, aiming to explain how substitution is analyzed in air pollution research without endorsing specific technologies, policies, or implementation choices.

Temporal factors also affect interpretation. Short-term analyses may differ significantly from long-term assessments, particularly when system transitions are gradual. Researchers therefore frame conclusions within specific temporal and spatial scopes.

Some substitution assessments also acknowledge cross-media interactions, which are conceptually examined in classifications such as types of water pollution.

Diagram showing uncertainty and context dependence in substitution outcomes
Why substitution results vary across contexts

Avoiding Overgeneralization in Educational Content

Academic literature consistently cautions against overgeneralizing substitution findings. Educational explainers reflect this caution by presenting substitution as a comparative research approach rather than a definitive pathway.

By highlighting uncertainty, methodological assumptions, and context specificity, purely educational content supports informed interpretation without implying certainty or recommendation. This approach aligns with institutional research standards and reinforces the explanatory purpose of substitution analysis.

CONCLUSION

Substitution is examined in air pollution research as an analytical method for comparing emission patterns across alternative systems, technologies, or inputs. Rather than offering prescriptive guidance, substitution studies use hypothetical and scenario-based frameworks to explore how pollutant levels may vary under different structural conditions. This approach allows researchers to move beyond point-source analysis and consider broader system interactions that influence air quality.

The discussion in this explainer has shown that substitution research is applied across multiple domains, including energy systems, industrial processes, transportation technologies, and material inputs. Each category relies on specific indicators, modeling techniques, and data sources, with findings interpreted within clearly defined spatial and temporal boundaries. Differences in assumptions, data availability, and contextual factors contribute to variation across studies.

By emphasizing methodological foundations and interpretive limits, this article has framed substitution as a research tool rather than a solution framework. Understanding how substitution is studied helps readers interpret environmental assessments more accurately and recognize the uncertainty inherent in comparative pollution analysis. Such an educational perspective supports informed learning and critical evaluation of air pollution research without extending into advice or recommendations.

References

About the Author

This article is part of GreenGlobe25’s educational explainer series, which presents neutral, research-based explanations of environmental systems using publicly available institutional and academic sources.
LinkedIn: chakrabortty-soumen
Facebook: Ecoplanet

Last update on December 2025.