

Introduction
Air quality measurement forms the empirical foundation of air pollution research and regulatory assessment in India. Rather than relying on general descriptions of atmospheric conditions, measurement systems express physical and chemical atmospheric processes as standardized indicators that can be observed, recorded, and compared across locations and time periods. These systems underpin how ambient air pollution is documented in scientific studies, evaluated in regulatory contexts, and reported through public information platforms (WHO; CPCB).
In the Indian context, air quality measurement has developed within a multi-tier institutional framework that combines national coordination with state- and city-level monitoring activities. A range of pollutants is routinely measured using established scientific methods, producing concentration data that serve as proxies for broader atmospheric conditions. These measurements are shaped by technical choices related to monitoring instruments, station placement, averaging periods, and data validation protocols.
This educational explainer examines how air quality is measured in India by focusing on monitoring systems and indicators rather than pollution sources or impacts. It outlines the conceptual basis of ambient air measurement, describes the structure of monitoring infrastructure, and explains how raw observations are converted into interpretable indicators. Attention is also given to methodological boundaries and uncertainties that influence how measurement data are interpreted in air pollution research and policy analysis.
Foundational terminology and conceptual distinctions are discussed in What Is Air Pollution: Foundational Definitions and Core Concepts.

The following points summarize the core principles of how air quality monitoring systems operate in India.
Key Points
Air quality in India is measured through monitoring systems that:
• record pollutant concentrations in ambient air
• use standardized indicators such as particulate matter and gases
• operate through national and state monitoring networks
• produce datasets used for research, regulation, and public reporting
Conceptual Foundations of Air Quality Measurement
Air quality measurement in environmental science refers to the systematic observation and quantification of pollutant concentrations in ambient air. In regulatory and research contexts, measurement is distinct from emission accounting. While emissions describe the release of pollutants from sources, ambient measurement captures the concentration of pollutants present in the atmosphere after dispersion, chemical transformation, and interaction with meteorological conditions. This distinction is central to understanding how air quality data are generated and interpreted in India.
Ambient air quality measurement relies on standardized scientific protocols to support comparability across locations and time periods. Pollutants are measured at fixed monitoring locations using instruments designed to detect specific chemical or physical properties. The resulting values represent concentrations at the monitoring site rather than conditions experienced uniformly across a wider area. As a result, measured data are treated as indicators of broader atmospheric conditions rather than exhaustive representations of all micro-environments.
What “Measurement” Means in Ambient Air Quality Science
In ambient air quality science, measurement involves repeated observations of pollutant concentrations expressed in standardized units, typically micrograms per cubic metre (µg/m³) for particulate matter, and volumetric mixing ratios such as parts per million (ppm) or parts per billion (ppb) for gaseous pollutants. These observations are collected over defined averaging periods, such as hourly, daily, or annual intervals. Averaging serves both analytical and regulatory purposes, allowing short-term fluctuations to be contextualized within longer-term trends.
Measurement systems prioritize consistency and reliability over exhaustiveness. Monitoring stations are designed to generate continuous or periodic datasets that can support trend analysis, compliance assessment, and comparative research. As a result, measurement frameworks emphasize methodological stability, calibration protocols, and data continuity rather than capturing every localized variation in air quality.
Pollutants as Measurable Indicators
Only a subset of atmospheric constituents is routinely monitored within national air quality systems. These pollutants are selected because of their prevalence, measurability, and relevance in environmental and public health research. In India, commonly monitored pollutants include particulate matter and selected gaseous compounds, which function as indicators of ambient air quality status.
Using pollutants as indicators involves simplification. Individual pollutants are measured separately, yet atmospheric pollution typically consists of complex mixtures that vary by location and season. Measurement frameworks therefore rely on representative indicators to approximate broader conditions, acknowledging that no single pollutant fully characterizes ambient air quality. The classification of pollutants used in monitoring systems is discussed in Classification of Air Pollutants: Primary vs Secondary Pollutants.
Spatial and Temporal Dimensions of Measurement

Air quality measurements are inherently spatially fixed and temporally bounded. Monitoring stations record concentrations at specific geographic points, often chosen to represent urban background conditions, traffic influence, or industrial proximity. The spatial representativeness of a station depends on surrounding land use, emission patterns, and local meteorology.
Temporal resolution further shapes interpretation. Short averaging periods capture rapid changes, while longer averages smooth variability to reveal trends. Both dimensions are commonly used in environmental analysis, though each introduces interpretive constraints that must be considered when comparing data across regions or timeframes.
Air Quality Monitoring Infrastructure in India
India’s air quality monitoring infrastructure has developed as a multi-layered system combining national coordination with decentralized implementation (CPCB; MoEFCC). Monitoring activities are organized through institutional frameworks that define responsibilities for station deployment, data management, and reporting. This structure reflects both administrative federalism and the technical demands of sustained environmental observation. Institutional standards that inform monitoring design and interpretation are examined in CPCB Pollution Standards vs WHO Guidelines.
At the national level, monitoring frameworks are designed to promote methodological consistency across states while allowing flexibility to address region-specific conditions. State and urban authorities operate monitoring stations within these frameworks, contributing data to centralized platforms used for analysis and public reporting.
National Monitoring Architecture
The national monitoring architecture is coordinated through regulatory institutions responsible for setting technical standards and maintaining data systems. These institutions define protocols for instrument selection, calibration, pollutant coverage, and data validation. Oversight functions include quality assurance, inter-laboratory comparison, and methodological updates in response to evolving scientific understanding.
Data generated through this architecture are aggregated to support national assessments of air quality trends. The role of central institutions is not to manage individual stations directly, but to provide coherence across a geographically diverse monitoring network.
Types of Monitoring Stations
Air quality monitoring in India is conducted through multiple station types that differ in measurement frequency, instrumentation, and operational design. These categories reflect whether pollutant concentrations are recorded continuously through automated analyzers or obtained through periodic sampling and laboratory analysis. The distinction between station types influences the temporal resolution, reporting latency, and comparability of the resulting datasets.
Continuous Ambient Air Quality Monitoring Stations (CAAQMS)
Continuous stations use automated analyzers to measure pollutant concentrations in near real time. These systems generate high-frequency data, often at hourly intervals, enabling detailed temporal analysis. CAAQMS typically monitor particulate matter and selected gaseous pollutants simultaneously.
The strength of continuous stations lies in their ability to capture diurnal and episodic variations. However, their deployment is constrained by cost, maintenance requirements, and infrastructure needs, which influence their spatial distribution.
Manual and Semi-Continuous Monitoring Stations
Manual monitoring stations rely on periodic sample collection, often using filter-based methods followed by laboratory analysis. These stations produce lower-frequency datasets, commonly used for long-term trend analysis and regulatory compliance evaluation.
While manual stations offer broader geographic coverage due to lower operational costs, they introduce delays between sampling and data availability. This characteristic affects their suitability for real-time reporting but not their value in longitudinal studies.
Supplementary and Emerging Monitoring Approaches
In addition to fixed stations, supplementary approaches such as mobile monitoring units and short-term measurement campaigns are used in research and diagnostic contexts. Emerging technologies, including low-cost sensors, are also examined in scientific literature, primarily as complements rather than replacements for reference-grade monitoring systems.
Indicators, Metrics, and Data Processing Frameworks
Air quality data gain meaning through standardized indicators and metrics that allow measurements to be compared, aggregated, and interpreted. Raw observations from monitoring instruments undergo multiple stages of processing before they are used in research or public reporting. These stages are governed by technical protocols designed to balance accuracy, continuity, and usability.
Pollutant Concentration Metrics
Pollutant concentrations are reported using units appropriate to their physical and chemical properties (WHO). Particulate matter is typically expressed as mass concentration, while gases are measured by volumetric mixing ratios. Different averaging periods serve distinct analytical purposes, with short-term averages capturing variability and long-term averages supporting trend assessment.
Regulatory frameworks often specify which metrics are used for evaluation, reflecting assumptions about temporal relevance and comparability. These choices shape how air quality conditions are represented in official datasets.
Data Validation and Quality Control
Before measurement data are accepted for analysis or dissemination, they undergo validation procedures. These include instrument calibration checks, completeness thresholds, and the identification of anomalous values. Data that fail to meet quality criteria may be flagged or excluded, depending on established protocols.
Quality control processes aim to support the reliability of reported values by reducing the influence of instrument error or operational disruptions. However, validation also reduces data volume, which can affect temporal continuity.
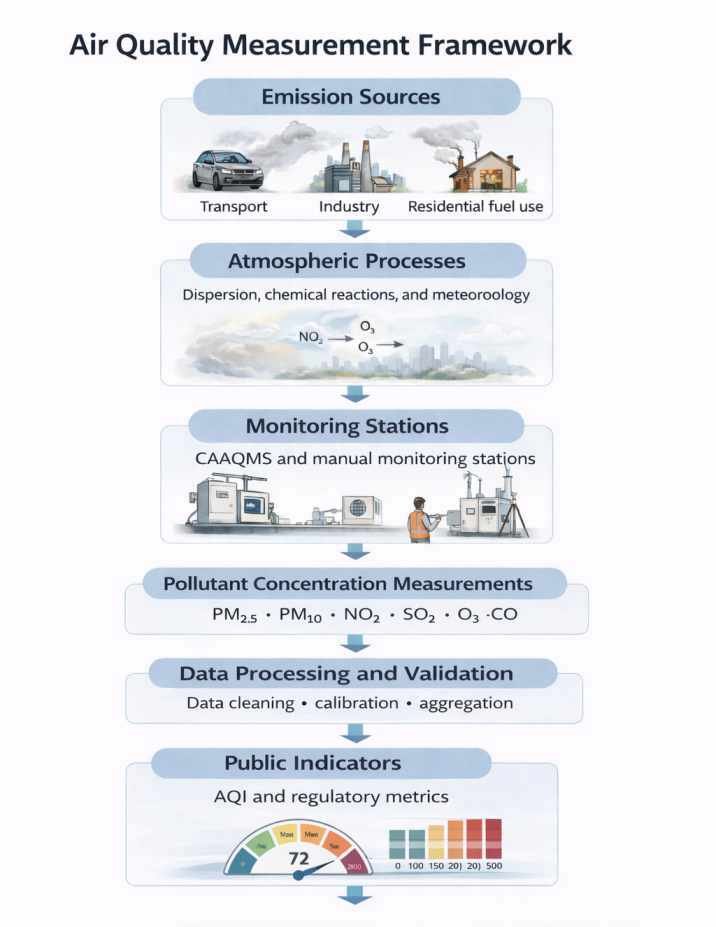
From Raw Measurements to Public Indicators
Processed data are transformed into standardized indicators for reporting and analysis. In India, these processed measurements are also used to calculate the Air Quality Index (AQI), which converts pollutant concentrations into simplified categories for public communication. The methodological framework behind this translation is explained in How AQI Is Calculated in India. This transformation involves aggregation across time and, in some cases, across monitoring sites. While these indicators improve accessibility, they also compress complex datasets into simplified representations.
As a result, public indicators are best understood as summaries rather than exhaustive depictions of ambient air conditions. Their interpretive value depends on awareness of the underlying processing steps and associated constraints.
Interpretation Boundaries and Systemic Limitations
Air quality monitoring systems are designed to support consistent observation rather than comprehensive environmental capture. As such, measurement data must be interpreted within clearly defined boundaries. These limitations are widely acknowledged in environmental research and influence how findings are framed in institutional analyses.

Monitoring Coverage and Representativeness
Monitoring infrastructure in India is unevenly distributed, with higher station density in urban and industrial regions. Rural and remote areas are less extensively monitored, affecting the spatial representativeness of national datasets. This distribution reflects both resource considerations and historical monitoring priorities.
As a result, national assessments often rely on interpolations and assumptions that introduce uncertainty, particularly when comparing regions with differing monitoring intensity.
Measurement Uncertainty and Environmental Variability
Observed pollutant concentrations are influenced by meteorological factors such as wind, temperature, and atmospheric stability. Instrument sensitivity and detection limits further shape recorded values. Seasonal phenomena can produce recurring patterns that complicate year-to-year comparisons.
These sources of variability are inherent to ambient air measurement and are addressed through statistical treatment rather than elimination.
What Monitoring Data Can — and Cannot — Indicate
Monitoring data describe ambient concentrations at specific locations and times. They do not directly represent individual exposure or indoor conditions, nor do they capture all micro-scale variations. Consequently, measurement data are interpreted as indicators of environmental conditions rather than precise descriptions of lived experience.
Recognizing these boundaries is essential for maintaining analytical clarity and avoiding over-interpretation of air quality datasets.
Conclusion
Air quality measurement in India is grounded in standardized scientific practices that translate complex atmospheric conditions into observable and comparable indicators. Through a combination of fixed monitoring stations, defined pollutant metrics, and institutional data protocols, ambient air quality is documented in a form that supports air pollution research, regulatory assessment, and public reporting. These measurement systems prioritize consistency, methodological transparency, and long-term data continuity over comprehensive spatial coverage.
The structure of India’s monitoring infrastructure reflects both technical requirements and administrative arrangements. Continuous and manual monitoring stations operate within a nationally coordinated framework, generating datasets that vary in temporal resolution and geographic representativeness. Indicators derived from these measurements are shaped by choices related to pollutant selection, averaging periods, and validation standards, each of which influences how air quality conditions are described and compared.
At the same time, measurement data are subject to inherent limitations. Spatial gaps, environmental variability, and methodological constraints affect interpretation and underscore the distinction between measured concentrations and broader environmental or population-level conditions. Understanding how air quality is measured therefore requires attention not only to instruments and indicators, but also to the boundaries within which these systems operate. Viewed in this context, air quality measurement functions as an analytical tool that informs environmental understanding while remaining shaped by its technical and institutional parameters.
References
- World Health Organization (WHO). WHO Global Air Quality Guidelines: Particulate Matter (PM₂.₅ and PM₁₀), Ozone, Nitrogen Dioxide, Sulfur Dioxide and Carbon Monoxide.
- World Health Organization (WHO). Air Quality Monitoring: A Practical Guide.
- Central Pollution Control Board (CPCB). National Air Quality Monitoring Programme (NAMP): Guidelines and Methodology.
- Central Pollution Control Board (CPCB). Continuous Ambient Air Quality Monitoring Stations (CAAQMS) — Technical Documentation.
- Ministry of Environment, Forest and Climate Change (MoEFCC), Government of India. National Ambient Air Quality Standards (NAAQS).
- Central Pollution Control Board (CPCB). (n.d.). National Air Quality Index (AQI) Technical Framework.
GreenGlobe25 Editorial Research Team
The GreenGlobe25 Editorial Research Team produces independent educational air pollution research content focused on India. Content is developed using publicly available government datasets, institutional reports, and peer-reviewed scientific literature.
The team does not conduct primary data collection or experimental research. All material is written for general educational understanding and follows a documented editorial process emphasizing source verification, conceptual clarity, and neutral interpretation.
GreenGlobe25 content is informational in nature and does not provide medical, legal, regulatory, or policy advice. The platform maintains a non-commercial, non-advocacy approach to air pollution research communication.
- Health Effects of Air Pollution: Short-Term and Long-Term Impacts - March 24, 2026
- What AQI Numbers Mean in India (AQI Chart + Health Effects Guide) - March 22, 2026
- Emission Inventory in India: How Pollution Sources Are Measured (Complete Guide) - March 21, 2026