This category examines air pollution through an educational lens, focusing on sources, atmospheric pollutants, measurement frameworks, health and environmental impacts, and regulatory responses. Articles draw on scientific research, air quality monitoring data, and policy frameworks to explain how air pollution is assessed, managed, and contextualized, without providing personal exposure advice or behavioral guidance.
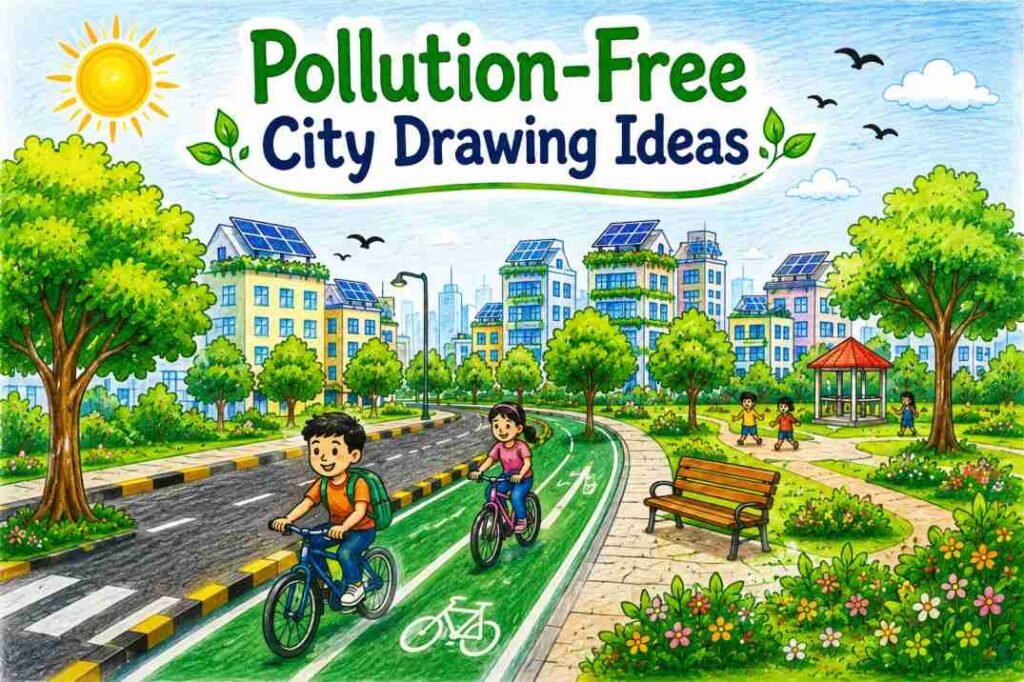
A pollution-free city drawing shows a clean, healthy, and eco-friendly city with practical solutions to reduce pollution. It often includes green parks, tree-lined streets, bicycle lanes, solar-powered buildings, clean rivers, and recycling systems. These ideas are widely used in school competitions, EVS projects, and World Environment Day activities because they encourage students to explore practical ways to build cleaner, healthier, and more sustainable cities.
What Is a Pollution-Free City Drawing?
A pollution-free city drawing is an environmental poster or artwork that shows practical ways to create a cleaner and healthier city. It often features green transportation, renewable energy, recycling, clean public spaces, and urban greenery. Students create these drawings for school competitions, classroom projects, and environmental awareness activities to promote sustainable living.
Why Pollution-Free City Drawings Are Popular in Schools
Pollution-free city drawings are popular in schools because they combine creativity with environmental education. Through drawing competitions and classroom projects, students learn about clean air, waste management, renewable energy, and green transportation in a simple and engaging way. These drawings also encourage students to think about practical solutions that can make cities cleaner, healthier, and more sustainable.
Best Pollution-Free City Drawing Ideas
The best pollution-free city drawing is one that matches your skill level while clearly communicating an environmental message. Some ideas focus on visual contrast, while others highlight sustainable technology, community living, or nature conservation. Instead of choosing the most detailed design, select a concept that clearly communicates one environmental message. A simple, well-organized drawing often creates a stronger impression than a complex poster filled with too many elements.
Example of a pollution-free city drawing featuring bicycle lanes, solar-powered buildings, green public spaces, and sustainable urban planning.
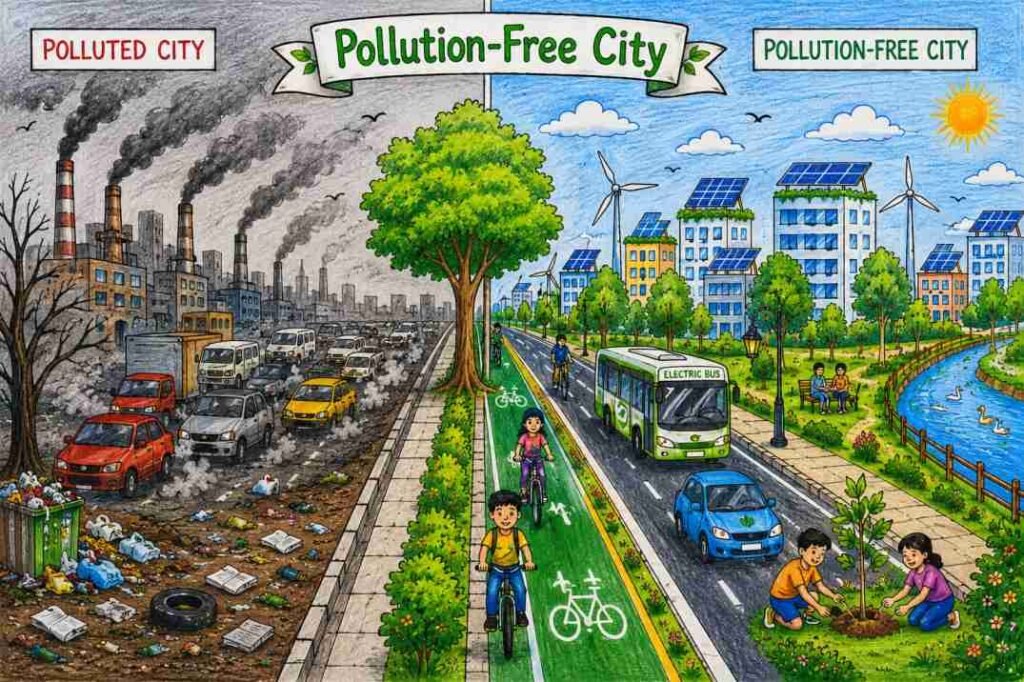
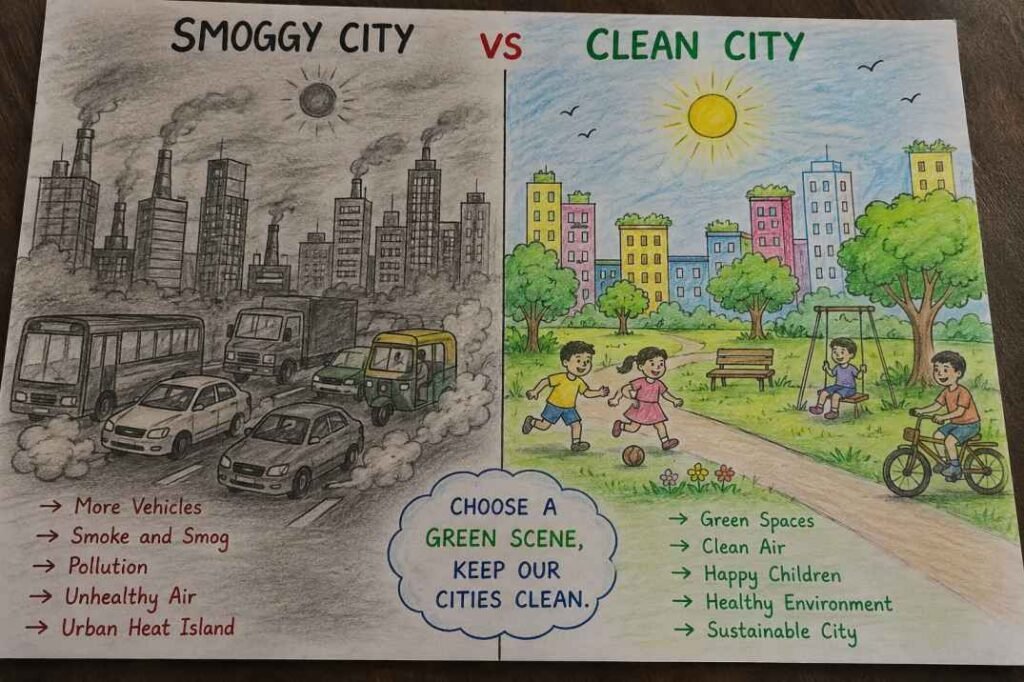
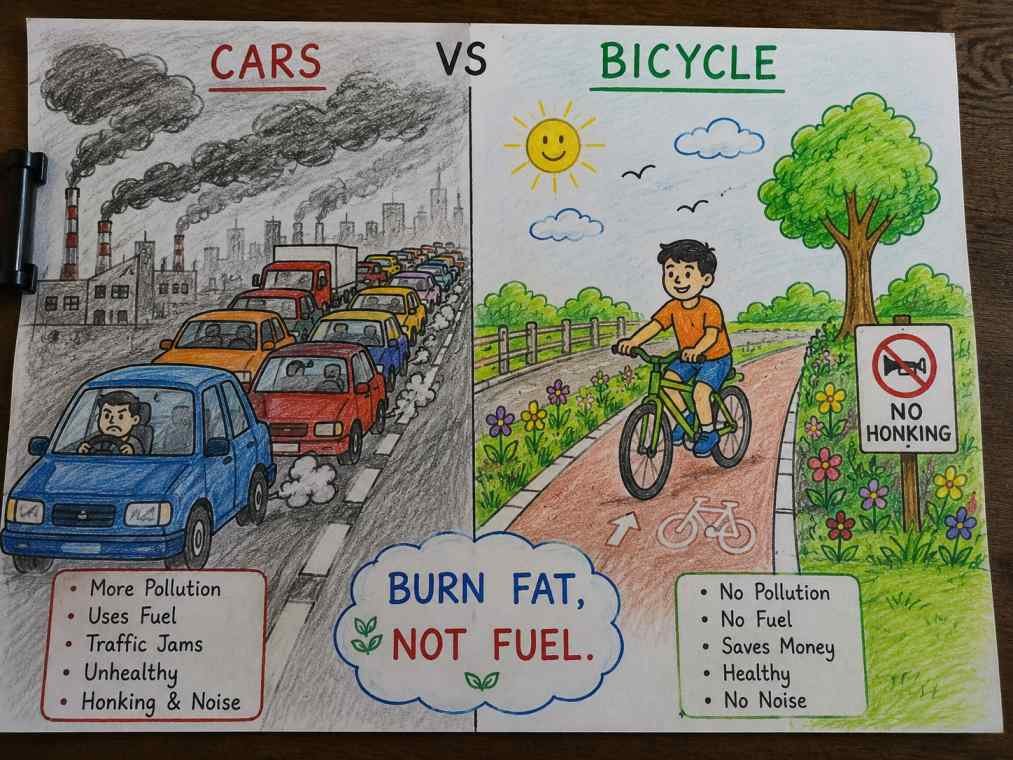
1. Smoggy City vs. Clean City
Draw the city in two halves to show a clear contrast between pollution and sustainability. On one side, include factories with smoke, traffic jams, litter, and dry trees. On the other side, show green parks, clean roads, bicycle lanes, solar panels, recycling bins, and healthy trees. This idea clearly demonstrates how sustainable choices can transform an unhealthy city into a cleaner and greener place.
Why This Idea Works
The side-by-side comparison immediately highlights the difference between pollution and sustainable living. Because viewers can see both the problem and the solution in a single drawing, this concept creates a strong visual impact and is often effective for school competitions.
2. Green Smart City
Create a modern green smart city that combines technology with sustainability. Include solar-powered buildings, electric buses, bicycle lanes, smart recycling bins, rainwater harvesting systems, and tree-lined streets. This drawing highlights how innovation and eco-friendly planning can make cities cleaner, healthier, and more sustainable.
Why This Idea Works
Modern features such as solar panels, electric transport, and smart waste systems make this drawing both creative and relevant. It presents sustainability as a practical part of everyday urban life rather than just an environmental concept.
3. Eco-Friendly Neighborhood
Draw a clean and eco-friendly neighborhood with tree-lined streets, well-maintained parks, clean roads, and homes with rooftop solar panels. Add recycling bins, community gardens, and people walking or cycling to show sustainable daily living. This idea demonstrates how small community efforts can help create a cleaner and healthier environment.
Why This Idea Works
This drawing focuses on simple lifestyle changes that anyone can relate to, making the environmental message easy to understand. Its clean layout and familiar surroundings also make it a suitable choice for younger students and beginners.
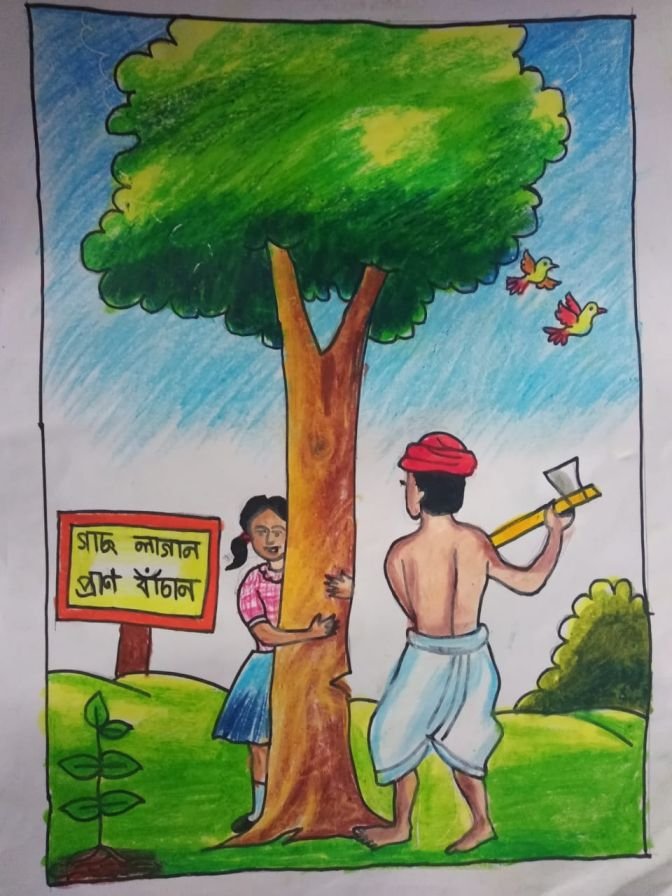
4. Save Nature, Save the Future
Create a drawing that highlights the importance of protecting nature for a better future. Include healthy forests, clean rivers, wildlife, renewable energy, and people planting trees or cleaning public spaces. This theme shows how environmental conservation and sustainable living can help build a pollution-free city for future generations.
Why This Idea Works
Natural landscapes, wildlife, and conservation activities work together to create a powerful environmental awareness theme. This concept encourages viewers to think about protecting natural resources for future generations.
5. Future Eco City
Imagine a future city designed for clean and sustainable living. Draw eco-friendly skyscrapers with rooftop gardens, solar panels, wind turbines, electric public transport, green parks, and smart waste management systems. This idea shows how modern technology and environmental planning can work together to create a pollution-free future.
Why This Idea Works
Imagining a future city powered by clean energy encourages creative thinking while promoting sustainable urban development. It is an excellent choice for students who want to present an original idea without losing the environmental focus.
Which Pollution-Free City Drawing Idea Should You Choose?
Each pollution-free city drawing idea highlights a different environmental theme. Use the table below to compare the best options based on difficulty, target class level, and the main message, then choose the idea that best matches your competition and drawing skills.
Drawing Idea
Best For
Difficulty
Main Theme
Smoggy City vs. Clean City
Beginners
Easy
Pollution vs. Sustainability
Green Smart City
Classes 6–10
Medium
Renewable Energy & Smart Cities
Eco-Friendly Neighborhood
Classes 4–8
Easy
Community & Green Living
Save Nature, Save the Future
Environment Day Competitions
Easy
Nature Conservation
Future Eco City
Advanced Students
Medium
Sustainable Cities of the Future
Which Drawing Idea Is Best for Competitions?
There is no single “best” pollution-free city drawing for every competition. The right choice depends on the judging criteria and your drawing skills. If you want a strong visual comparison, choose Smoggy City vs. Clean City. For creativity, Future Eco City works well, while Eco-Friendly Neighborhood is ideal for students who prefer a simpler layout without sacrificing the environmental message.
Tips to Create an Impressive Pollution-Free City Drawing
A successful drawing is not judged by the number of objects it contains but by how clearly it communicates its message. A clean layout, balanced composition, and well-chosen environmental elements often create a stronger impression than a highly detailed drawing.
Choose environmental elements that support your theme, such as green parks, bicycle lanes, renewable energy, recycling systems, or clean public spaces. Including only relevant details makes the drawing look more organized and easier to understand.
Avoid overcrowding your drawing with unnecessary details, as a clean and organized design is often more effective. If your competition allows, add a short environmental slogan to reinforce your message and leave a lasting impression on viewers.
Before adding colors, check whether your main message is easy to understand at a glance. A clean, balanced drawing with one strong idea usually creates a greater impact than a crowded design filled with unnecessary details.
Best Pollution-Free City Drawing Slogans
A short, meaningful slogan reinforces the message behind your drawing and helps viewers understand its purpose at a glance. Choose a slogan that matches your theme instead of using one that feels unrelated to your artwork.
Keep the City Green, Keep the Future Clean.
Clean Air, Healthy Life.
Plant More Trees, Breathe Fresh Air.
Choose Green, Live Clean.
Reduce Pollution, Build a Better Future.
Every Tree Counts.
Ride a Bicycle, Reduce Pollution.
Recycle Today for a Better Tomorrow.
Save Nature, Save Our Future.
Together We Can Build a Pollution-Free City.
Clean City
Green City, Clean City, My Dream City.
Clean Air, Healthy Future.
Green Transportation
Ride Green, Keep the Air Clean.
Nature Conservation
Protect Nature, Protect Life.
Plant Trees, Breathe Free.
Frequently Asked Questions
What is a pollution-free city drawing?
A pollution-free city drawing shows a clean, healthy, and environmentally friendly city. It usually includes green transportation, renewable energy, trees, parks, and proper waste management to illustrate how cities can reduce pollution.
Which pollution-free city drawing is easiest for beginners?
Smoggy City vs. Clean City is one of the easiest ideas for beginners because it uses a simple side-by-side layout to compare pollution with sustainable living. The clear contrast makes the environmental message easy to understand while keeping the drawing simple to create.
How can I make my pollution-free city drawing stand out?
Choose one clear theme instead of combining too many ideas. Keep the layout neat, use bright colors, and include a short slogan that matches your environmental message.
Which colors work best for a pollution-free city drawing?
Green works well for trees and parks, blue for the sky and water, and yellow for sunlight and clean energy. Natural color combinations usually make the drawing look brighter and more realistic.
Which pollution-free city drawing idea is best for school competitions?
A Smoggy City vs. Clean City drawing is a popular choice because it presents both the environmental problem and the solution in a single poster. Its clear visual contrast makes the environmental message easy for both judges and viewers to understand at a glance.
Can I use this drawing for EVS projects and Environment Day activities?
Yes. Pollution-free city drawings are widely used for school competitions, EVS projects, Earth Day, World Environment Day, and other environmental awareness programs.
What should I avoid while drawing a pollution-free city?
Avoid overcrowding the page with too many objects, mixing different themes, or using dull colors throughout the drawing. A simple, well-organized design with one clear message is usually more effective.
Conclusion
A pollution-free city drawing is most effective when it communicates one clear environmental message through simple, practical ideas. Whether you choose a split-city comparison, a green smart city, or a nature-focused theme, keep the layout balanced and the message easy to understand. A thoughtful design often leaves a stronger impression than an overly detailed drawing.
Explore More Environmental Drawing Ideas
If you’re looking for more environmental drawing ideas or want to learn about different types of pollution, explore the related guides below. You may also find the following guides helpful if you’re exploring environmental drawing topics or learning about different types of pollution.
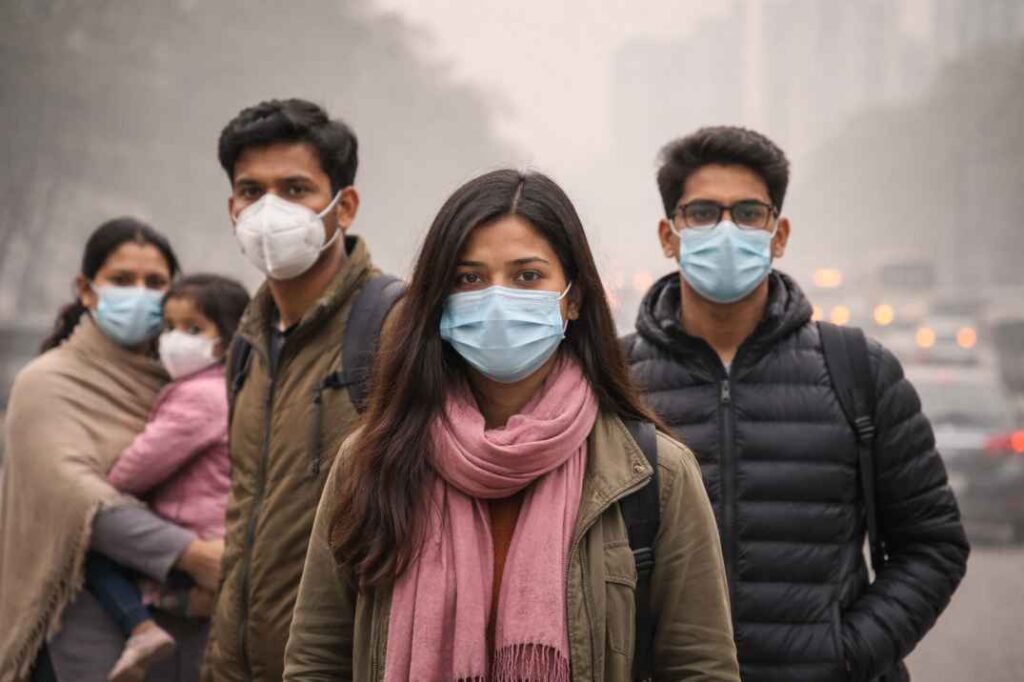
Air quality can vary significantly across Indian cities depending on traffic, industrial activity, weather conditions, and seasonal factors. Many people check AQI values before going outside but are often unsure what AQI level is actually considered safe.
In India, AQI values between 0 and 100 are generally considered acceptable for most people. As AQI rises above 100, pollution exposure increases and some individuals may begin experiencing health effects, particularly during prolonged outdoor activity.
Understanding safe AQI ranges can help you make better decisions about outdoor exercise, commuting, and reducing unnecessary pollution exposure.
This guide explains what different AQI values mean, when outdoor activities remain safe, and what precautions are recommended under India’s CPCB AQI framework.
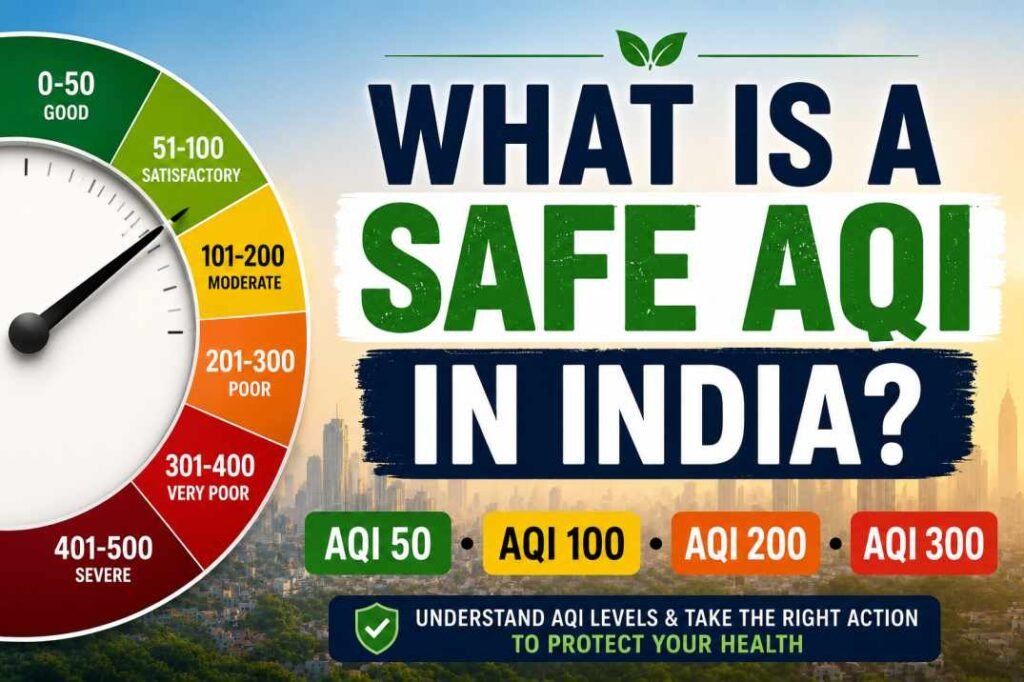
Safe AQI in India is generally considered between 0 and 100 under the CPCB AQI framework. AQI above 100 indicates increasing pollution exposure, while AQI above 200 may cause health concerns for sensitive groups.
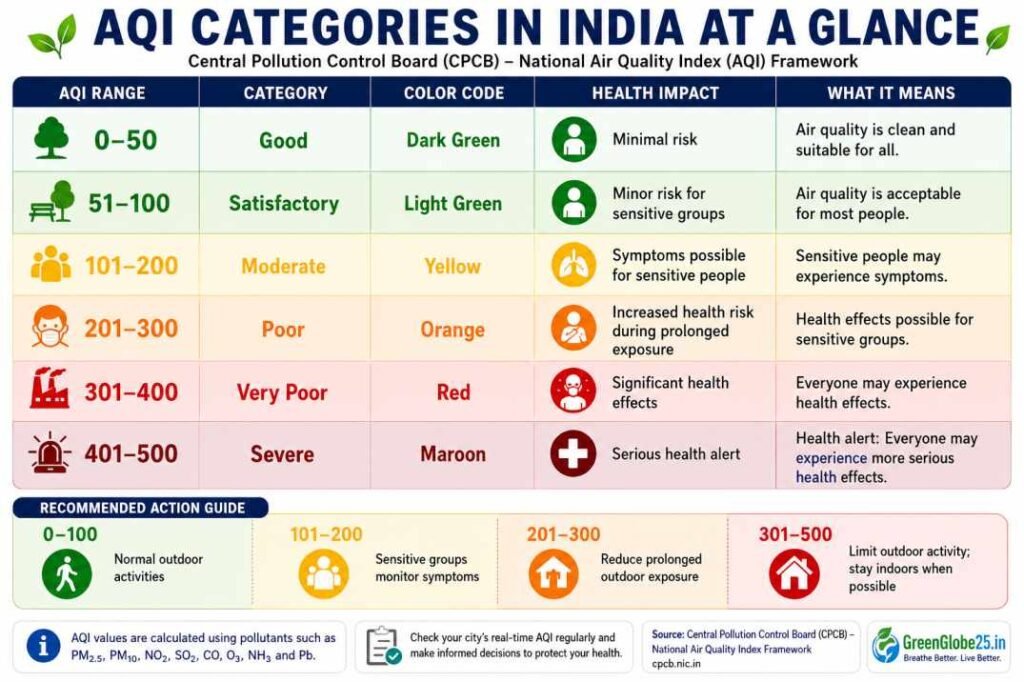
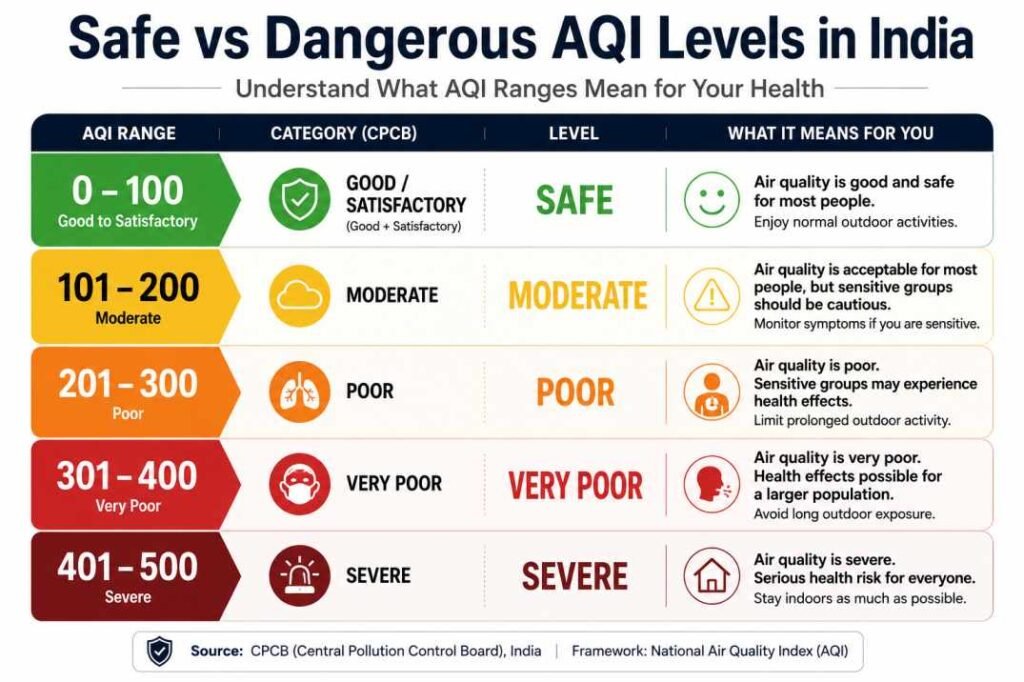
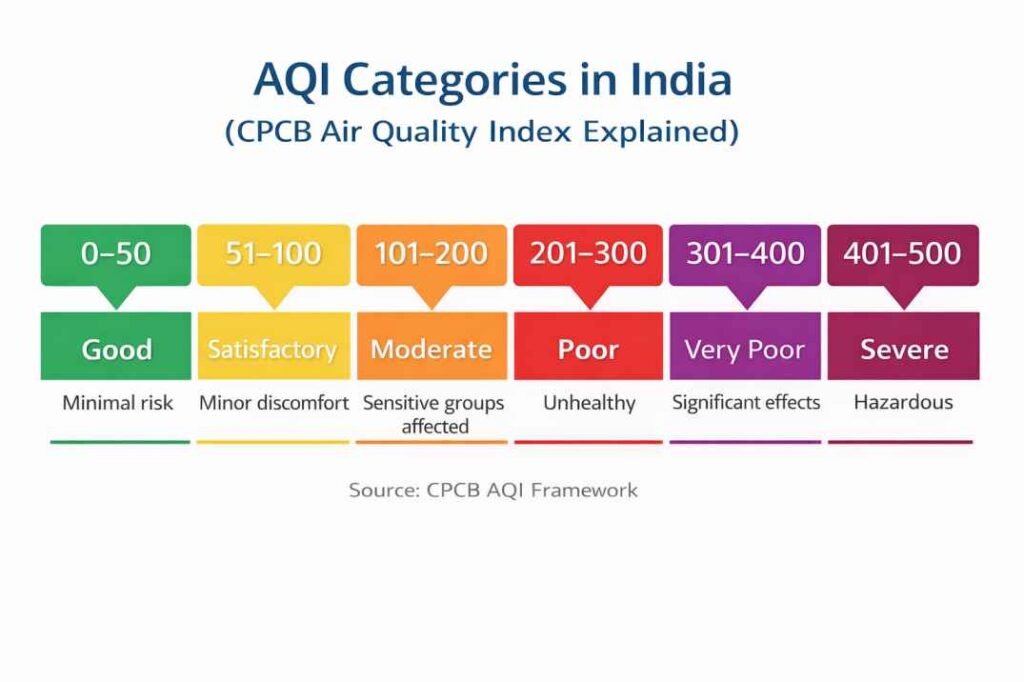
CPCB AQI categories in India with health impacts and recommended actions for different air quality levels.
Quick Answer
A safe AQI in India is generally between 0 and 100 under the CPCB Air Quality Index framework.
AQI 0–50 = Good
AQI 51–100 = Satisfactory
AQI 101–200 = Moderate
AQI 201–300 = Poor
AQI 301–400 = Very Poor
AQI 401–500 = Severe
These categories are defined under India’s CPCB Air Quality Index (AQI) framework.
For most people, AQI below 100 is considered safe. Once AQI exceeds 200, health risks increase and prolonged outdoor exposure may begin affecting even healthy individuals.
Table of Contents
What Is AQI and Why Does It Matter?
AQI (Air Quality Index) is a system used to describe how clean or polluted the air is at a particular location. Instead of showing pollution measurements for individual pollutants separately, AQI combines multiple pollutants into a single number that is easier for the public to understand. To understand these numbers better, see How AQI is Calculated in India.
In India, the Central Pollution Control Board (CPCB) uses the National Air Quality Index framework to report air quality conditions across cities and monitoring stations. The underlying data comes from monitoring networks that continuously collect pollution measurements. Learn more in How Real-Time AQI Data Is Collected in India.
AQI is calculated using pollutants such as:
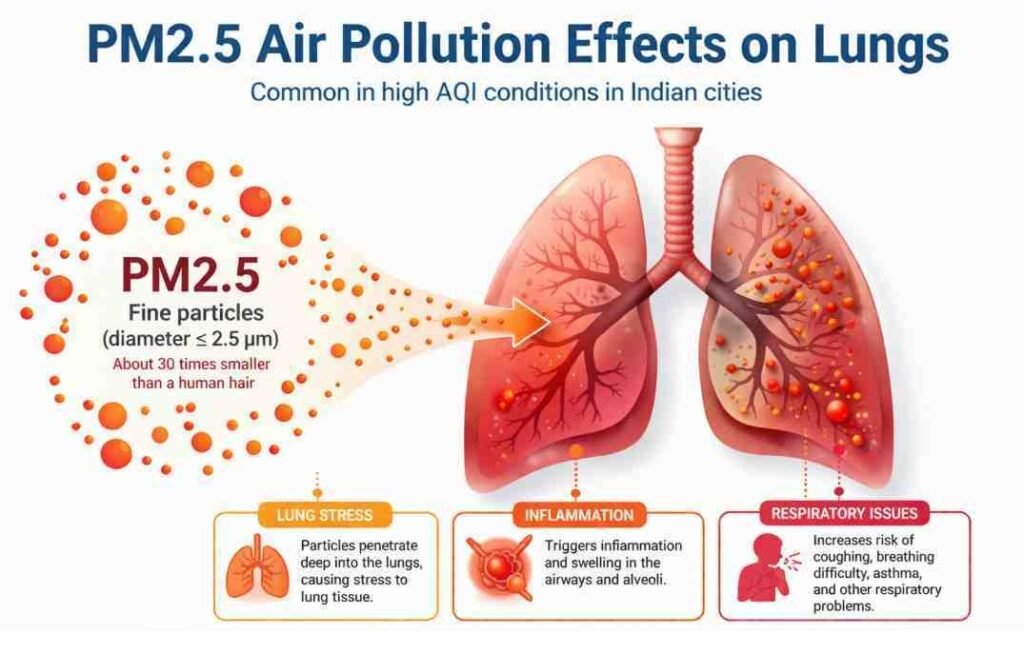
PM2.5 (fine particulate matter)
PM10 (coarse particulate matter)
Nitrogen Dioxide (NO₂)
Sulfur Dioxide (SO₂)
Carbon Monoxide (CO)
Ozone (O₃)
Ammonia (NH₃)
Lead (Pb)
As pollution levels increase, AQI values rise and potential health risks become greater.
For example:
An AQI of 40 generally indicates clean air with minimal health concerns.
An AQI of 120 suggests moderate pollution that may affect sensitive groups.
An AQI of 250 indicates poor air quality where prolonged exposure can affect a larger portion of the population.
An AQI above 400 represents severe pollution conditions requiring stronger precautions.
AQI matters because it helps people make practical decisions about outdoor activities, exercise, commuting, and pollution exposure. Rather than guessing whether the air is safe, AQI provides a standardized way to assess air quality and potential health risks. These AQI values are generated using data from Air Pollution Monitoring Stations located across India.
What Is Considered a Safe AQI in India?
Under India’s National Air Quality Index (AQI) framework, air quality is generally considered safe when AQI remains between 0 and 100. This range includes the Good and Satisfactory categories, where pollution levels are relatively low and health risks for the general population are minimal.
Many people search for the normal AQI level in India or the safe AQI range. Under the CPCB Air Quality Index framework, an AQI between 0 and 100 is generally regarded as the normal and acceptable range for most people.
The CPCB AQI categories are shown below:
AQI Range
Category
General Health Impact
0–50
Good
Minimal impact
51–100
Satisfactory
Minor breathing discomfort for a small number of sensitive individuals
101–200
Moderate
Breathing discomfort possible for people with respiratory conditions
201–300
Poor
Increased discomfort during prolonged exposure
301–400
Very Poor
Significant health effects possible
401–500
Severe
Serious health risks for a larger population
AQI levels below 100 are generally considered safe, while higher AQI ranges indicate increasing health risks.
For most healthy adults, AQI below 100 is generally considered safe for normal outdoor activities, commuting, walking, and exercise.
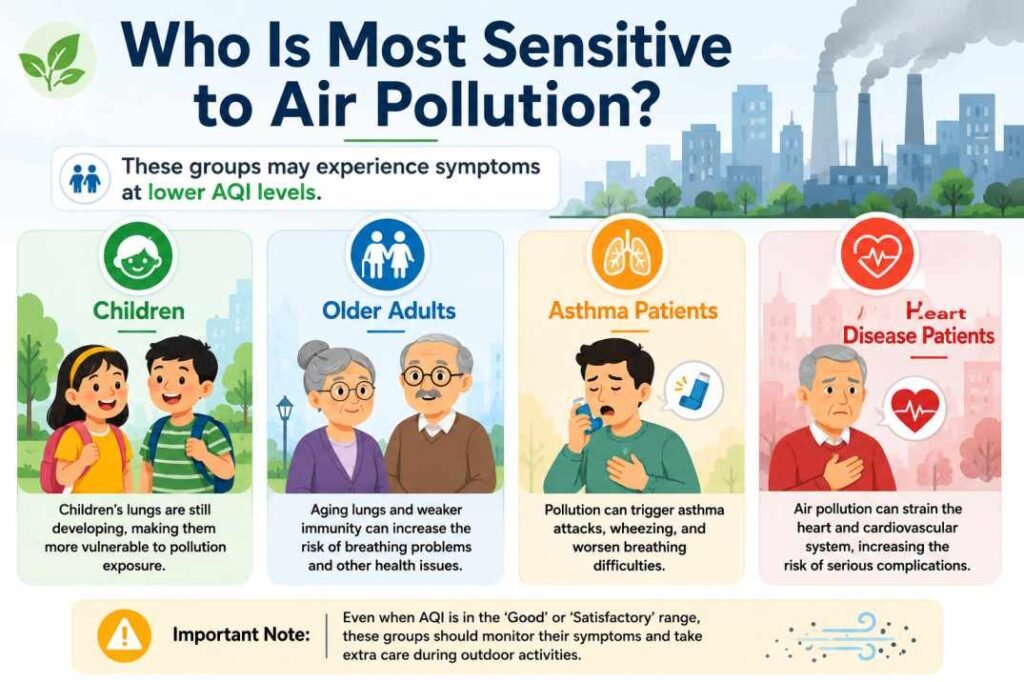
However, “safe” does not always mean the same thing for everyone. Children, older adults, and people with asthma or other respiratory conditions may be more sensitive to air pollution even when AQI remains within the satisfactory range.
As AQI rises above 100, pollution exposure gradually increases. This does not necessarily mean the air becomes immediately dangerous, but it indicates that some individuals may begin experiencing symptoms such as throat irritation, coughing, or breathing discomfort during extended outdoor exposure.
Once AQI exceeds 200, health concerns become more significant because pollution concentrations are high enough to affect a broader section of the population, particularly during repeated exposure over several days.
Is AQI 50 Safe?
Yes. AQI 50 falls within the Good category and is generally considered safe for nearly everyone.
At this level, air pollution concentrations are relatively low, and most people can continue normal outdoor activities without concern. Walking, cycling, outdoor exercise, sports, and daily commuting can typically be performed without pollution-related restrictions.
Children, older adults, and individuals with respiratory conditions generally face minimal pollution-related risk when AQI remains in the Good category.
Although AQI 50 is considered safe, it does not necessarily mean the air is completely free of pollutants. Instead, it indicates that pollution levels are low enough that adverse health effects are unlikely for the vast majority of the population.
Examples of activities generally considered safe at AQI 50 include:
Outdoor exercise
School sports activities
Walking and cycling
Outdoor recreation
Children’s playground activities
For comparison, many cities experience AQI values significantly above 50 during periods of heavy traffic, industrial emissions, or unfavorable weather conditions. As a result, AQI 50 is often viewed as a desirable air quality target.
Is AQI 100 Safe?
In most situations, yes.
AQI 100 represents the upper limit of the Satisfactory category under the CPCB AQI framework. Air quality at this level is still generally considered acceptable for the general population.
Most healthy adults can continue normal outdoor activities without significant concern. However, individuals who are particularly sensitive to air pollution may begin noticing minor symptoms during prolonged outdoor exposure.
These sensitive groups may include:
People with asthma
Individuals with chronic respiratory conditions
Older adults
Young children
People with cardiovascular disease
AQI 100 is not usually considered dangerous, but it does indicate higher pollution exposure than AQI values in the Good category.
AQI 50 vs AQI 100
Both AQI 50 and AQI 100 are generally considered safe. The difference is that AQI 100 represents a higher pollution level and a smaller margin before air quality begins entering the Moderate category.
For healthy individuals, the practical difference may be small. For sensitive groups, however, AQI 100 may require greater awareness of symptoms during extended outdoor activity.
In most Indian cities, AQI values fluctuate throughout the day. Therefore, a single AQI reading should be interpreted alongside overall exposure duration and daily air quality trends.
Common AQI Questions
AQI Value
Is It Safe?
Explanation
40
✅ Yes
Excellent air quality.
60
✅ Yes
Safe for most people.
75
✅ Yes
Satisfactory air quality.
80
✅ Yes
Generally safe.
100
✅ Usually Yes
Upper limit of satisfactory.
150
⚠ Moderate
Sensitive groups should reduce exposure.
200
❌ Poor
Limit prolonged outdoor activity.
300
❌ Very Poor
Avoid outdoor activity.
500
🚫 Severe
Serious health risk for everyone.
Is AQI 150 Safe?
AQI 150 falls within the Moderate category under the CPCB Air Quality Index framework. While it is not typically considered hazardous for the general population, it is no longer regarded as ideal air quality.
Most healthy adults can continue normal daily activities at AQI 150. However, pollution exposure is noticeably higher than in the Good or Satisfactory categories, and some sensitive individuals may begin experiencing symptoms during prolonged outdoor exposure.
People who may be more affected include:
Children
Older adults
People with asthma
Individuals with chronic respiratory diseases
People with cardiovascular conditions
Common symptoms may include:
Mild throat irritation
Coughing
Eye irritation
Breathing discomfort during exercise
AQI 150 does not usually require people to remain indoors, but it may be sensible to reduce prolonged outdoor activities if pollution levels remain elevated for several hours or days.
Is AQI 150 Safe for Children?
Children are generally more sensitive to air pollution because their lungs are still developing and they tend to spend more time outdoors.
At AQI 150, most children can continue normal activities. However, schools, parents, and caregivers should pay attention to children who have asthma or other respiratory conditions.
If a child develops symptoms such as coughing, wheezing, or breathing discomfort, outdoor activity may need to be reduced.
Is AQI 150 Safe for Outdoor Exercise?
AQI 150 represents a situation where exercise decisions should be made more carefully.
Light and moderate activities such as:
Walking
Casual cycling
Recreational outdoor activities
are generally acceptable for healthy individuals.
However, prolonged high-intensity exercise may increase pollution exposure because people breathe more deeply and inhale larger amounts of polluted air.
Examples of activities that may require caution include:
Long-distance running
Competitive sports
High-intensity cycling
Extended outdoor workouts
AQI 150 vs AQI 100
The difference between AQI 100 and AQI 150 is not always visible to the eye, but pollution concentrations are substantially higher.
AQI
Category
General Interpretation
100
Satisfactory
Generally safe for most people
150
Moderate
Increased exposure for sensitive groups
AQI 150 is often the point where sensitive groups begin paying closer attention to air quality conditions.
Is AQI 200 Dangerous?
AQI 200 sits at the upper end of the Moderate category and marks an important threshold in air quality assessment. While it is not classified as “Poor” under the CPCB framework until AQI exceeds 200, many people begin paying closer attention to air quality conditions as AQI approaches this level.
For healthy adults, short-term outdoor activities are usually still possible. However, prolonged exposure may increase the likelihood of respiratory discomfort, especially during physical activity.
At AQI 200, sensitive groups may experience:
Increased coughing
Throat irritation
Breathing discomfort
Asthma symptom aggravation
Reduced exercise tolerance
The groups most likely to be affected include:
Children
Older adults
People with asthma
Individuals with chronic lung disease
People with cardiovascular conditions
Is AQI 200 Dangerous for Children?
Children generally face higher pollution exposure risks because their lungs are still developing and they often spend more time outdoors.
At AQI 200:
Outdoor sports may need to be reduced.
Extended playground activities should be monitored.
Children with asthma should follow medical advice and carry prescribed medications when necessary.
While AQI 200 is not typically considered an emergency, it represents a level where pollution-related symptoms become more likely for sensitive individuals.
Is AQI 200 Safe for Outdoor Exercise?
AQI 200 is often considered a caution point for outdoor exercise.
Activities such as:
Running
Competitive sports
High-intensity cycling
Extended outdoor workouts
may increase pollution exposure because breathing rates become significantly higher during exercise.
Many health organizations recommend reducing strenuous outdoor activity when air quality deteriorates to this level.
Light activities such as walking are generally associated with lower exposure than vigorous exercise.
AQI 150 vs AQI 200
Although both values fall within the Moderate category, AQI 200 represents substantially higher pollution exposure.
AQI
Category
Practical Interpretation
150
Moderate
Sensitive groups should exercise caution
200
Moderate (upper limit)
Increased likelihood of symptoms during prolonged exposure
As AQI approaches or exceeds 200, the probability of pollution-related discomfort increases, particularly for people who spend several hours outdoors.
Is AQI 300 Dangerous?
Yes. AQI 300 represents a much more serious air quality situation than AQI 150 or AQI 200.
Under the CPCB Air Quality Index framework, AQI values above 200 enter the Poor category. As AQI approaches 300, pollution concentrations become high enough to affect a larger portion of the population, not just sensitive groups.
At AQI 300, health effects may become more noticeable because people are exposed to higher levels of particulate matter and other pollutants.
Possible symptoms include:
Persistent coughing
Throat irritation
Eye irritation
Shortness of breath during physical activity
Increased respiratory discomfort
People with asthma, chronic respiratory diseases, and cardiovascular conditions face greater risks and may experience symptoms more quickly than healthy individuals.
Is AQI 500 Safe?
No. AQI 500 represents the highest level of the Severe category under the CPCB Air Quality Index. At this level, air pollution poses serious health risks for nearly everyone, and outdoor activities should be avoided whenever possible.
Is AQI 300 Dangerous for Healthy Adults?
AQI 300 does not affect everyone in the same way, but it represents a level where even healthy adults may notice pollution-related discomfort.
Activities that may become more difficult include:
Long-distance running
Outdoor sports
Cycling in heavy traffic areas
Extended outdoor work
The longer a person remains outdoors, the greater the potential exposure to polluted air.
Is AQI 300 Dangerous for Children and Older Adults?
Children and older adults are generally considered more vulnerable to air pollution.
At AQI 300:
Outdoor sports may need to be limited.
Prolonged outdoor exposure should be reduced.
Individuals with respiratory conditions should closely monitor symptoms.
Schools and caregivers may choose to modify outdoor activities depending on local conditions.
Because children breathe more rapidly than adults, they may receive a higher pollution dose relative to their body size.
AQI 200 vs AQI 300
Many people assume AQI 300 is only slightly worse than AQI 200.
In reality, the difference can be substantial.
AQI
Category
General Interpretation
200
Moderate (upper range)
Increased caution for sensitive groups
201–300
Poor
Health effects become more likely across a broader population
300
Upper Poor Range
Significant pollution exposure and greater health concerns
As AQI increases, exposure risk does not rise in a perfectly linear way. Higher pollution concentrations can lead to disproportionately greater health impacts during prolonged exposure.
Should You Exercise Outdoors at AQI 300?
Many people choose to reduce or postpone strenuous outdoor exercise when AQI approaches 300.
This is because exercise increases breathing rate, causing larger volumes of polluted air to reach the lungs.
If AQI remains around 300:
Light outdoor activity may be preferable to vigorous exercise.
Sensitive individuals should exercise additional caution.
Indoor exercise options may reduce exposure.
Certain groups may experience air pollution symptoms at lower AQI levels than the general population.
Safe AQI Levels for Children, Older Adults, and People With Asthma
A safe AQI level can vary depending on a person’s age, health condition, and sensitivity to air pollution. While AQI below 100 is generally considered acceptable for most people, some groups may experience symptoms at lower pollution levels than the general population.
Safe AQI for Children
Children are more sensitive to air pollution because their lungs are still developing and they spend more time outdoors.
General guidance for children:
AQI 0–100 is generally acceptable.
Above AQI 100, children with asthma or respiratory conditions should limit prolonged outdoor exposure if symptoms develop.
Above AQI 200, reducing outdoor sports and extended play is recommended.
Safe AQI for Older Adults
Older adults may be more sensitive to air pollution because of age-related changes in lung function and a higher likelihood of underlying health conditions.
For many older adults:
AQI below 100 is generally preferred.
AQI between 100 and 200 may require caution during prolonged outdoor exposure.
AQI above 200 can increase the likelihood of respiratory or cardiovascular discomfort.
Individuals with existing heart or lung conditions should pay particular attention to local air quality reports.
Safe AQI for People With Asthma
People with asthma should keep prescribed medication available and follow medical advice when outdoor exposure is expected.
For many asthma patients:
AQI 0–100 is usually the most comfortable range.
Above AQI 100, monitor symptoms and reduce prolonged outdoor exposure if necessary.
Above AQI 200, outdoor activities may need to be limited based on medical advice.
People with asthma should keep prescribed medications available and follow their healthcare provider’s recommendations.
Comparison Table
Group
Preferred AQI Range
Additional Caution Often Begins
Healthy Adults
0–100
Above 150
Children
0–100
Above 100
Older Adults
0–100
Above 100
People With Asthma
0–100
Above 100
Safe AQI for Outdoor Exercise
Air quality becomes especially important during exercise because physical activity increases breathing rate. When people exercise outdoors, they inhale larger volumes of air and may also inhale more pollutants.
As a result, the AQI level that feels acceptable during normal daily activities may not be ideal for vigorous exercise.
The table below provides general guidance for outdoor activities at different AQI levels.
AQI Range
Category
Outdoor Exercise Guidance
0–50
Good
Generally safe for all outdoor activities
51–100
Satisfactory
Safe for most people, including exercise and sports
101–150
Moderate
Sensitive groups should monitor symptoms during prolonged activity
151–200
Moderate
Reduce prolonged high-intensity outdoor exercise if sensitive to pollution
201–300
Poor
Limit strenuous outdoor activity, especially for sensitive groups
301–400
Very Poor
Consider reducing outdoor exercise significantly
401–500
Severe
Outdoor exercise generally not recommended
Is AQI 100 Safe for Exercise?
For most healthy adults, AQI 100 is generally considered acceptable for outdoor exercise.
Activities such as:
Walking
Jogging
Cycling
Recreational sports
can usually continue without significant restrictions.
However, individuals with asthma or respiratory conditions may prefer to monitor symptoms more closely as AQI approaches the upper end of the Satisfactory category.
Is AQI 150 Safe for Exercise?
AQI 150 represents a point where exercise decisions become more dependent on individual sensitivity.
Light and moderate activities are often manageable for healthy adults, but prolonged high-intensity exercise may increase pollution exposure.
Examples include:
Long-distance running
Competitive sports
High-intensity interval training
Extended cycling sessions
At this level, sensitive groups may choose to shorten workout duration or exercise during times when air quality is slightly better.
Is AQI 200 Safe for Exercise?
AQI 200 is generally considered a caution point for strenuous outdoor exercise.
During vigorous activity, people inhale significantly more air than during rest, increasing the amount of pollutants reaching the lungs.
At AQI 200:
Walking may still be reasonable for many people.
High-intensity exercise may increase pollution exposure substantially.
Sensitive groups should exercise additional caution.
Why Exposure Duration Matters
Many people focus only on the AQI number, but exposure duration also plays an important role.
For example:
A 15-minute walk at AQI 150 may result in relatively limited exposure.
A two-hour outdoor training session at the same AQI may lead to much greater pollution intake.
This is one reason why air quality recommendations often consider both AQI levels and the amount of time spent outdoors.
Author Observation
People often ask whether a specific AQI value is “safe” for exercise. In practice, the answer depends on the intensity and duration of the activity. A short walk and a marathon training session place very different demands on the body, even when performed under the same AQI conditions.
Why Safe AQI Levels Can Be Different for Different People
Many people search for a single AQI value that is either “safe” or “unsafe.” In reality, air pollution affects people differently depending on age, health status, activity level, and exposure duration.
This is why the same AQI reading may have very different effects on different individuals.
Age Matters
Children and older adults are generally more sensitive to air pollution than healthy working-age adults.
Children:
Have developing lungs
Spend more time playing outdoors
May inhale more air relative to their body size
Older adults:
Often have reduced lung function
May have underlying cardiovascular or respiratory conditions
Can experience symptoms more easily during pollution episodes
As a result, AQI levels that are manageable for a healthy adult may cause discomfort for more vulnerable groups.
Existing Health Conditions Matter
People with certain medical conditions may be affected by air pollution at lower AQI levels.
Examples include:
Asthma
Chronic obstructive pulmonary disease (COPD)
Heart disease
Allergic respiratory conditions
For these individuals, even moderate pollution levels may trigger symptoms such as coughing, wheezing, chest tightness, or breathing discomfort.
Activity Level Matters
AQI exposure depends not only on pollution concentration but also on how much air a person breathes.
For example:
Sitting indoors requires relatively little physical effort.
Walking increases breathing rate.
Running or playing sports significantly increases air intake.
This means two people exposed to the same AQI can receive very different pollution doses depending on their activity level.
Exposure Duration Matters
One of the most overlooked factors is exposure time.
A short period outdoors at AQI 150 may have limited impact on many people.
However:
Several hours outdoors
Daily exposure during commuting
Repeated exposure over multiple days
can increase overall pollution intake substantially.
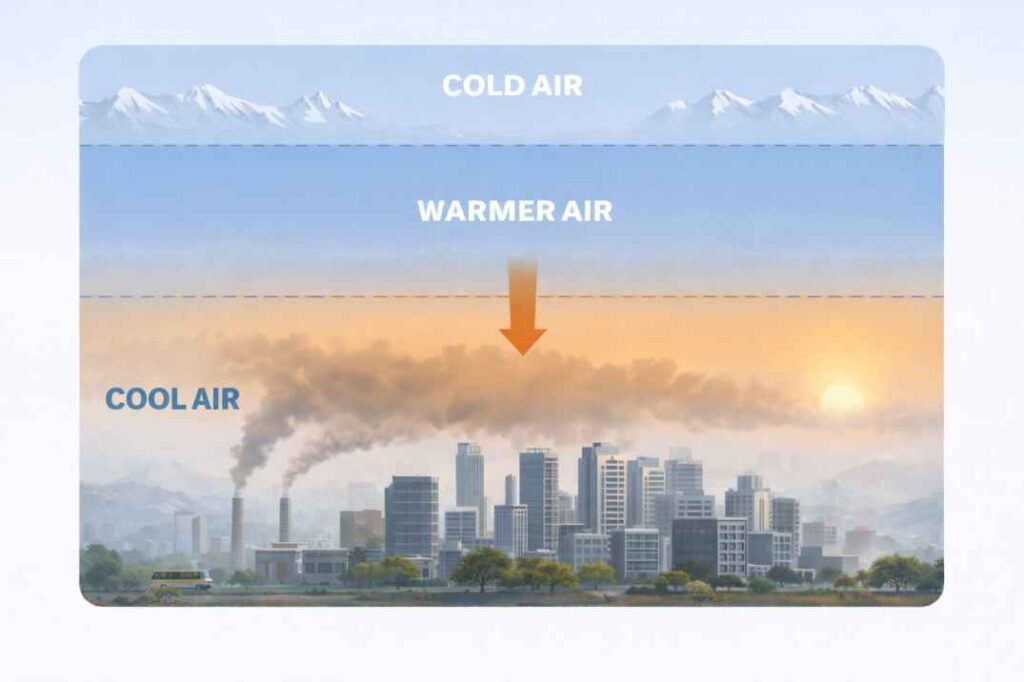
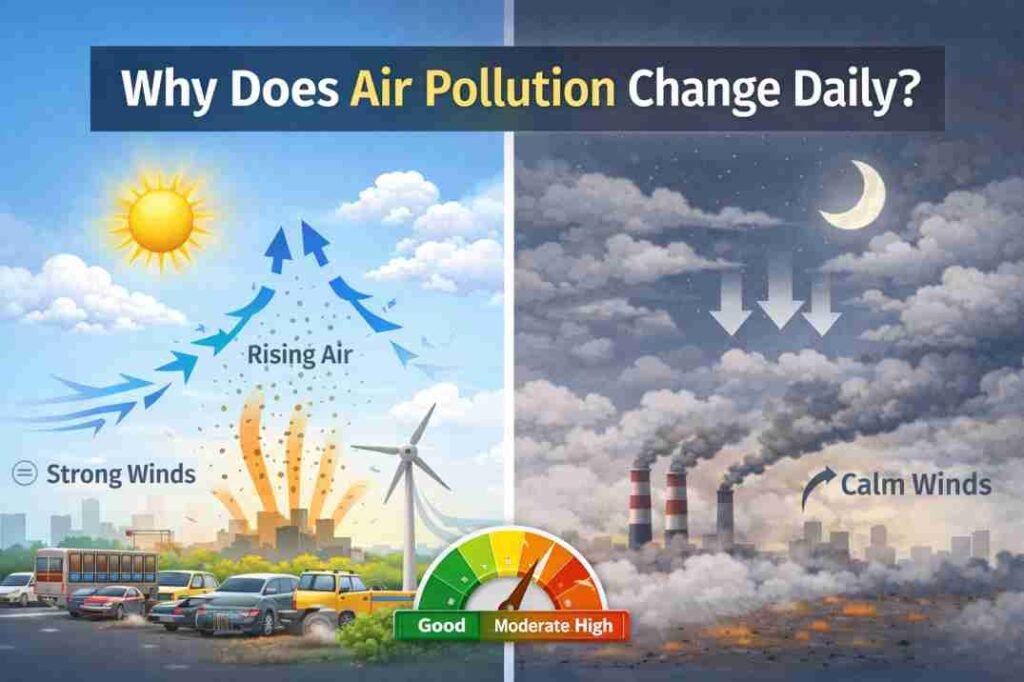
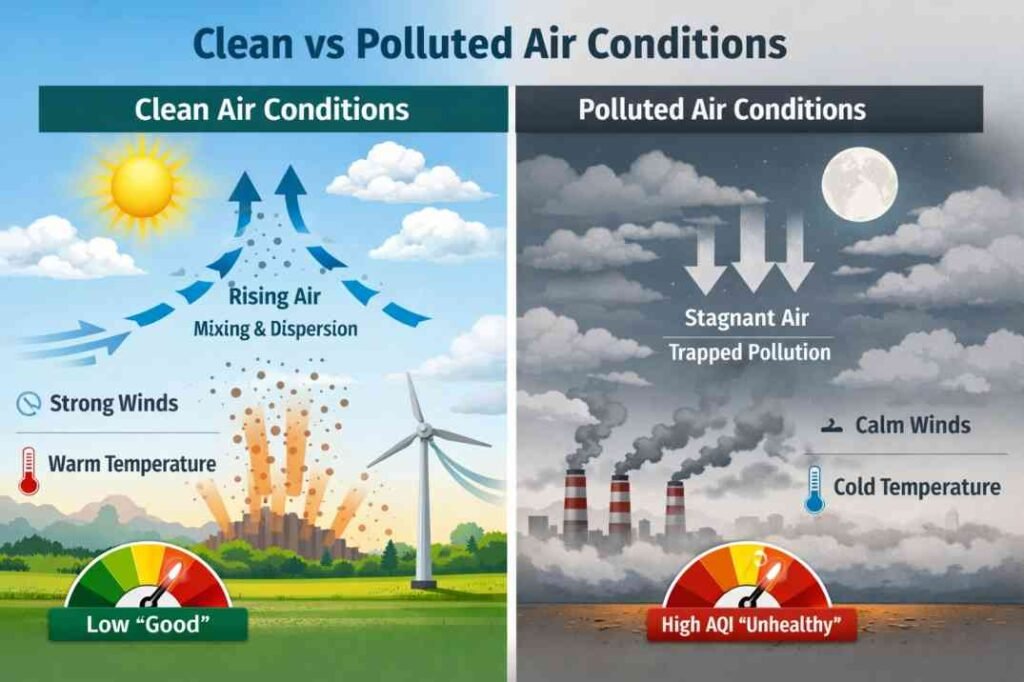
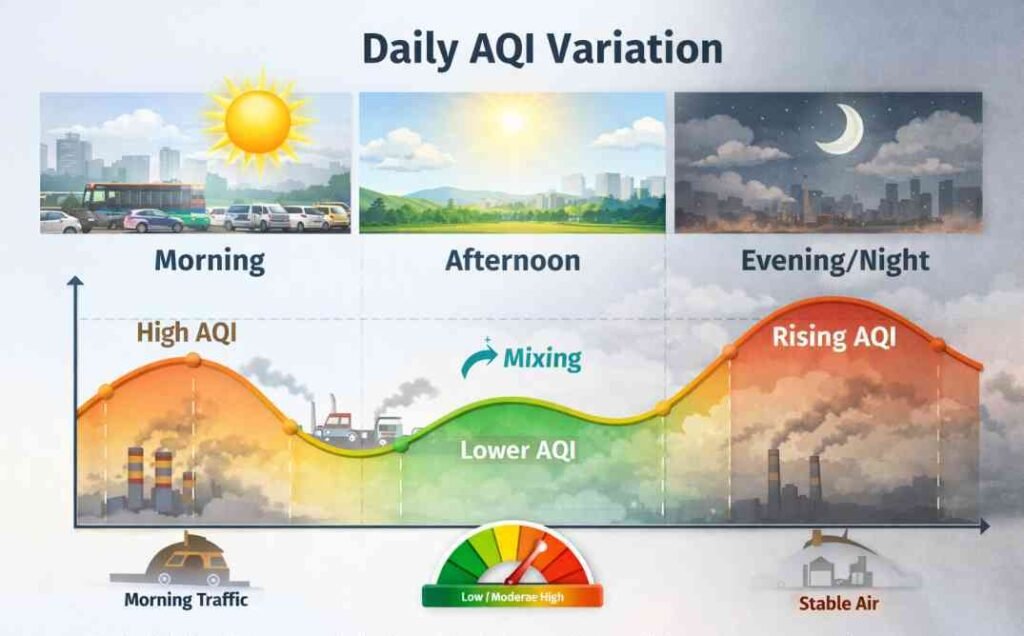
Weather and Local Conditions Matter
AQI values can change throughout the day because of:
Traffic patterns
Wind speed
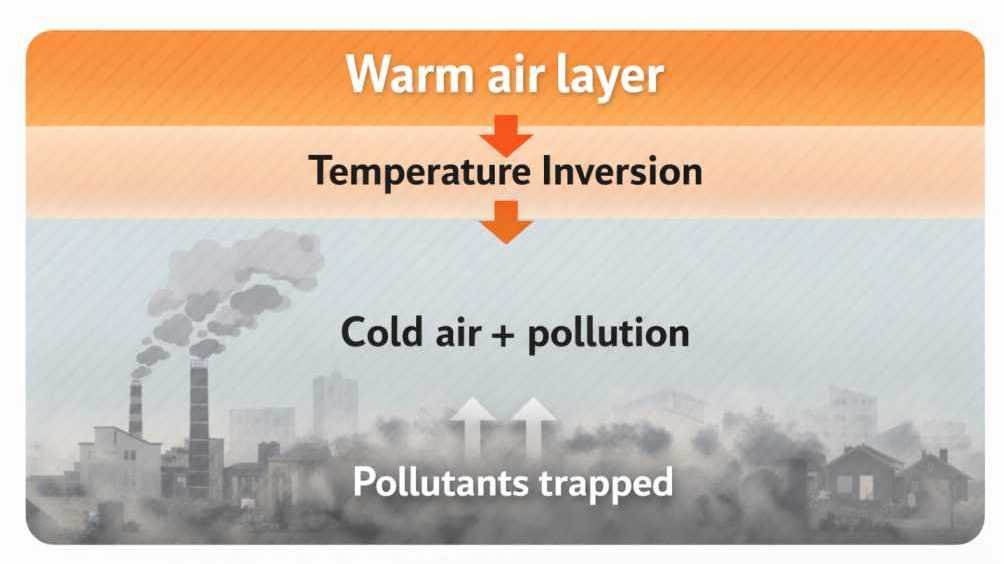
Temperature inversions
Industrial activity
Seasonal factors
This is one reason why people should consider both current AQI readings and broader air quality trends rather than relying on a single number.
Daily AQI fluctuations are often influenced by weather conditions, atmospheric mixing, and local emissions. Learn more in Why Air Pollution Changes Daily.
Author Observation
One common misconception is that air quality becomes important only when AQI reaches very high levels. In practice, long-term exposure to moderate pollution can be just as important as short-term exposure to severe pollution. Understanding personal exposure patterns often provides more useful insights than focusing on a single AQI reading alone.
What Should You Do at Different AQI Levels?
AQI values are most useful when they help people make practical decisions. While a single AQI reading does not determine exactly how every individual will respond, it can provide general guidance for outdoor activities and pollution exposure.
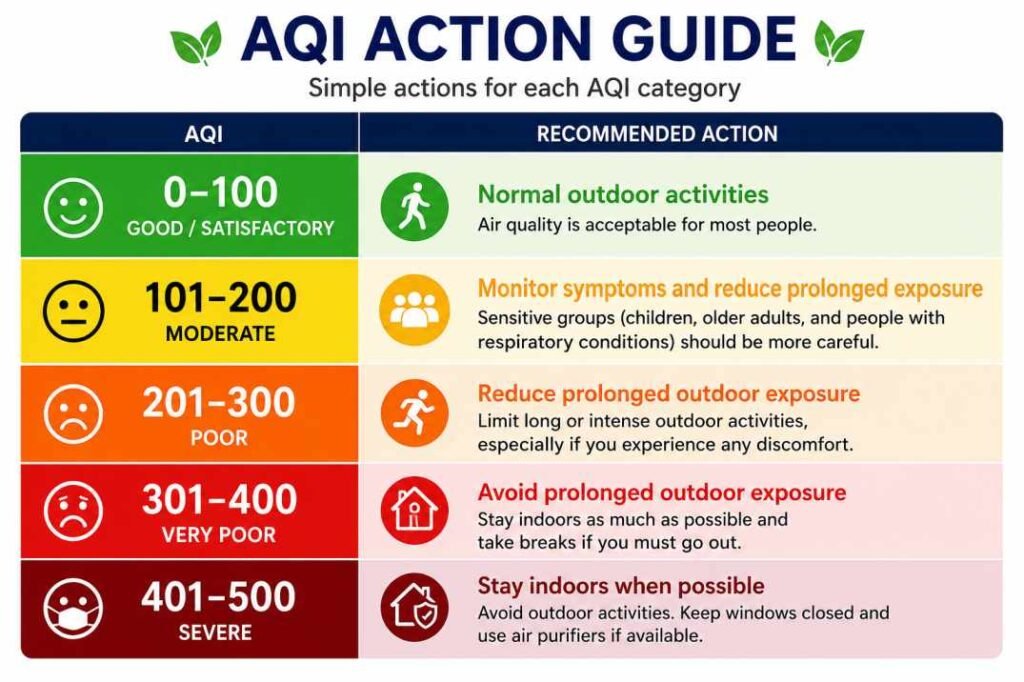
The table below summarizes common precautions at different AQI levels.
AQI Range
Category
Practical Advice
0–50
Good
Normal outdoor activities are generally safe.
51–100
Satisfactory
Most people can continue normal activities without restrictions.
101–200
Moderate
Sensitive groups should monitor symptoms during prolonged outdoor exposure.
201–300
Poor
Reduce prolonged outdoor activities, especially for children, older adults, and people with respiratory conditions.
301–400
Very Poor
Limit outdoor exposure when possible and reduce strenuous outdoor exercise.
401–500
Severe
Stay indoors when practical and follow local health advisories.
AQI 0–100: Generally Safe for Most People
When AQI remains below 100, air quality is generally considered acceptable for daily activities.
Most people can:
Walk outdoors
Exercise normally
Commute without special precautions
Participate in outdoor sports and recreation
Sensitive individuals should still pay attention to personal symptoms, but significant restrictions are usually unnecessary.
AQI 101–200: Increased Awareness May Be Helpful
At this stage, air pollution levels begin rising above the ideal range.
People with asthma, allergies, or respiratory conditions may benefit from:
Monitoring symptoms
Avoiding unnecessary prolonged exposure
Checking local AQI updates before outdoor activities
Healthy adults can usually continue normal activities, although exposure increases compared with cleaner air conditions.
AQI 201–300: Consider Reducing Exposure
AQI above 200 indicates that pollution levels are becoming high enough to affect a broader portion of the population.
At this level:
Prolonged outdoor exercise may not be ideal.
Sensitive groups should take additional precautions.
Outdoor exposure should be reduced when practical.
People who spend several hours outdoors each day may receive substantially higher pollution exposure than occasional outdoor visitors.
AQI 301–400: Significant Pollution Levels
When AQI enters the Very Poor category, pollution concentrations become a more serious concern.
Many people choose to:
Reduce outdoor exercise
Limit unnecessary outdoor activities
Monitor pollution forecasts more closely
Individuals with respiratory conditions may experience symptoms more easily during these periods.
AQI 401–500: Severe Air Quality Conditions
The Severe category represents the highest AQI range within the CPCB framework.
At this level:
Outdoor exposure should be minimized when possible.
Strenuous outdoor activities are generally discouraged.
Sensitive groups may require additional precautions.
Local authorities may issue health advisories depending on conditions.
Author Observation
Many people focus only on whether the AQI has crossed a specific threshold. In practice, pollution management is often about reducing unnecessary exposure rather than reacting only when conditions become severe. Small decisions—such as avoiding peak pollution hours or reducing prolonged outdoor activity—can help lower cumulative exposure over time.
Frequently Asked Questions
What is the safe AQI limit in India?
AQI between 0 and 100 is generally considered safe for most people under the CPCB Air Quality Index framework. This includes the Good and Satisfactory categories.
What is the normal AQI level in India?
There is no single normal AQI level because air quality varies by city, season, weather, and local pollution sources. However, AQI below 100 is generally considered acceptable.
Which AQI category is the best?
The Good category (AQI 0–50) represents the cleanest air and the lowest pollution-related health risk.
Is AQI 75 safe?
Yes. AQI 75 falls within the Satisfactory category and is generally considered safe for normal daily activities and outdoor exercise.
Is AQI 100 safe for outdoor exercise?
For most healthy adults, AQI 100 is generally considered acceptable for outdoor exercise. Sensitive individuals may choose to monitor symptoms during prolonged activity.
Is AQI 150 unhealthy?
AQI 150 falls within the Moderate category. While it is not usually considered dangerous for healthy adults, sensitive groups may experience breathing discomfort during prolonged exposure.
Is AQI 200 dangerous?
AQI 200 represents the upper end of the Moderate category and is often viewed as a caution point. Sensitive groups may experience noticeable symptoms, and prolonged outdoor exposure may increase health risks.
Is AQI 300 hazardous?
AQI 300 indicates poor air quality and significantly higher pollution exposure. Health effects become more likely across a broader portion of the population, especially during extended outdoor activity.
What AQI level should children avoid?
Children are generally more sensitive to air pollution than adults. When AQI exceeds 100, parents and schools may wish to monitor outdoor activity more carefully. Above AQI 200, prolonged outdoor exposure may need to be reduced.
What AQI level should people with asthma avoid?
People with asthma often experience symptoms more easily during pollution episodes. AQI above 100 may require additional caution, while AQI above 200 can significantly increase the likelihood of respiratory discomfort.
What is the normal AQI level in India?
The normal AQI level in India is generally between 0 and 100 under the CPCB Air Quality Index framework. This includes both the Good (0–50) and Satisfactory (51–100) categories.
What is a safe AQI range?
A safe AQI range is generally considered between 0 and 100 for most healthy people. Higher AQI values indicate increasing pollution exposure and may affect sensitive groups.
Recommended actions for different AQI categories based on India’s air quality framework.
Conclusion
A safe AQI in India is generally considered to be between 0 and 100. Within this range, air quality is usually acceptable for most people, including normal outdoor activities and exercise.
As AQI rises above 100, pollution exposure increases and sensitive groups may begin experiencing symptoms. AQI above 200 represents a more significant health concern, particularly during prolonged exposure, while AQI above 300 can affect a much larger portion of the population.
The most important thing to remember is that air pollution risk depends not only on the AQI number itself but also on age, health status, activity level, and exposure duration. Understanding AQI categories can help individuals make better decisions about outdoor activities and reduce unnecessary pollution exposure.
Understanding the major Sources of Air Pollution can also help explain why AQI varies across cities and seasons.
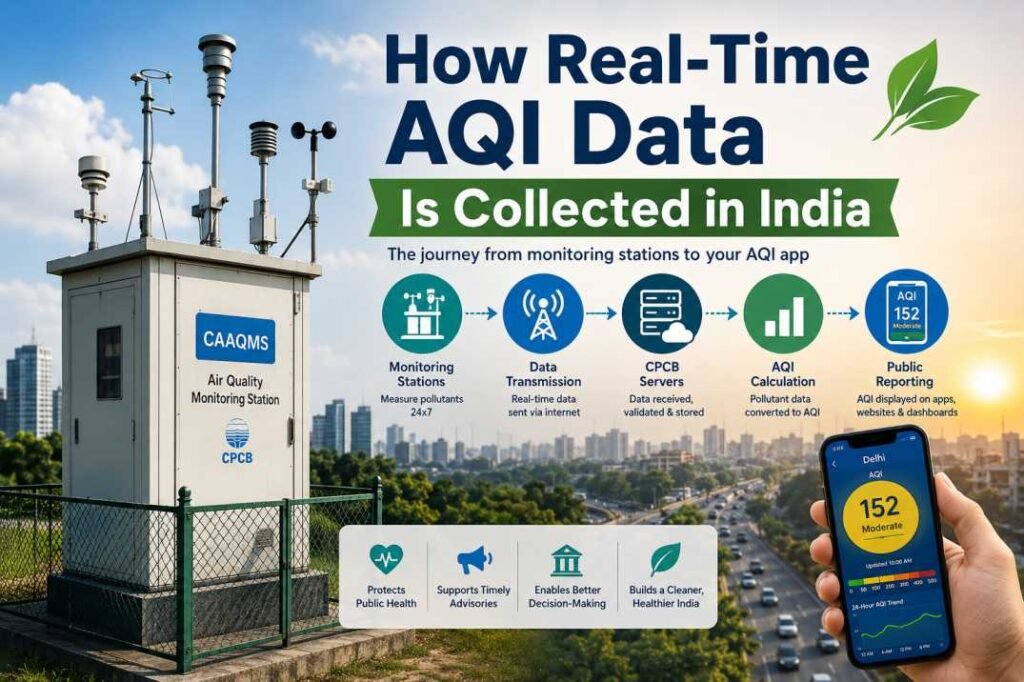
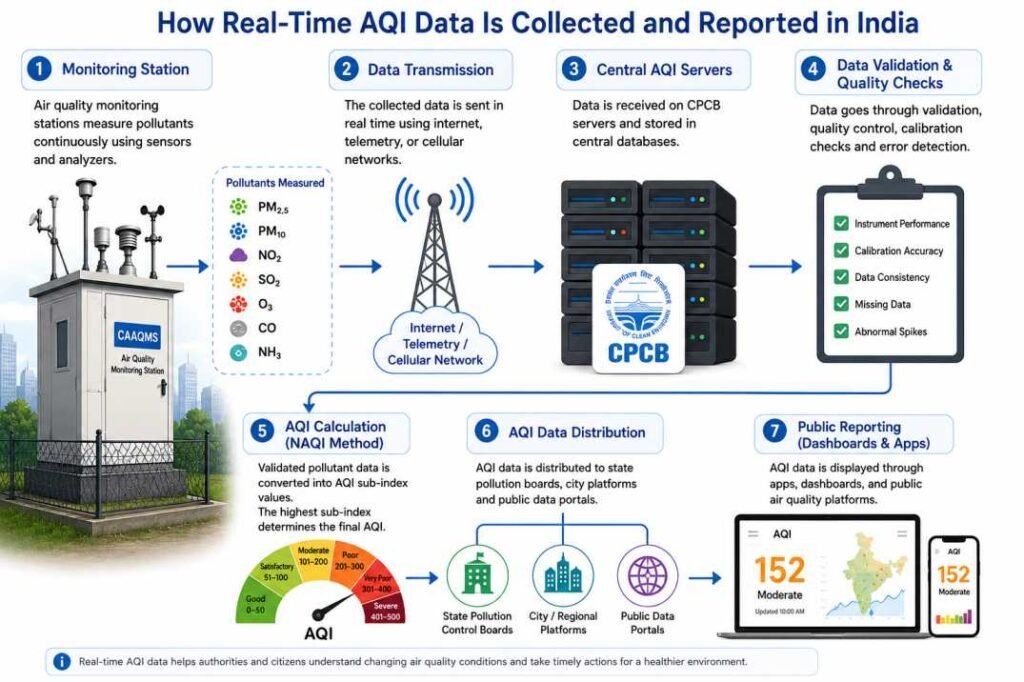
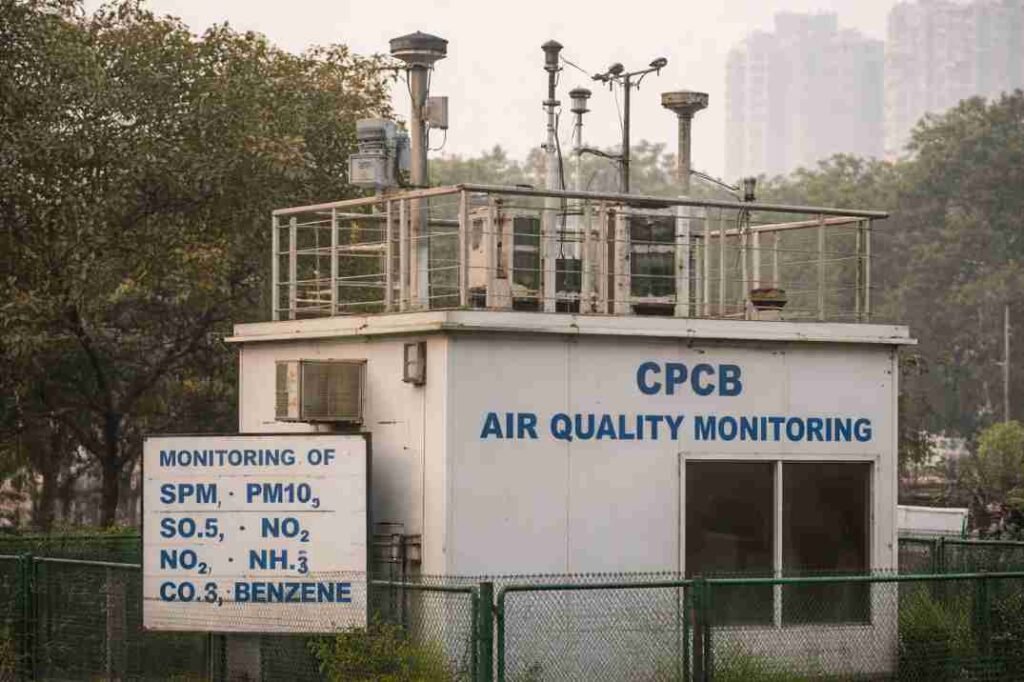
Real-time Air Quality Index (AQI) reporting in India depends on continuous monitoring systems that measure air pollutants throughout the day.
These systems collect pollution data from monitoring stations installed across cities, industrial regions, and urban environments. The collected measurements are processed, validated, and converted into AQI values used in public air quality reporting.
In India, most real-time AQI monitoring is coordinated through the Central Pollution Control Board (CPCB) and state pollution control agencies using Continuous Ambient Air Quality Monitoring Stations (CAAQMS).
This guide explains how real-time AQI data is collected, how monitoring stations transmit pollution measurements, and how AQI values are updated on public reporting platforms.
What Is Real-Time AQI Data?
Real-time AQI data refers to continuously updated air pollution measurements collected from automated monitoring stations.
Unlike manual air monitoring systems that rely on periodic sampling, real-time systems measure pollutant concentrations continuously and transmit data automatically to central databases.
This allows environmental agencies to monitor changing pollution levels throughout the day.
Real-time AQI reporting is especially important in large cities where pollution levels can change rapidly because of:
traffic emissions
industrial activity
weather conditions
seasonal pollution
construction dust
How Monitoring Stations Collect Pollution Data
Real-time AQI data is collected using air quality monitoring stations equipped with pollutant analyzers and atmospheric sensors.
These stations continuously measure pollutants present in ambient air and record pollutant concentrations at regular intervals.
Most Indian cities use:
Continuous Ambient Air Quality Monitoring Stations (CAAQMS)
Real-time AQI values can rise or fall within hours because pollution levels are strongly affected by traffic activity, weather conditions, industrial emissions, and atmospheric stability.
Limitations of Real-Time AQI Data
Although real-time AQI systems provide valuable information, they also have limitations.
Monitoring Coverage Is Uneven
Some cities and rural regions have fewer monitoring stations, which can reduce spatial coverage.
Short-Term Fluctuations Can Occur
Pollution levels may change rapidly within short time periods because of local emissions and weather conditions.
Instrument Maintenance Is Important
Real-time systems require regular calibration, maintenance, and quality checks to maintain reliable measurements.
Why Real-Time AQI Monitoring Is Important
Real-time AQI monitoring helps governments, researchers, and the public understand changing air pollution conditions.
It supports:
public health advisories
pollution control planning
environmental research
AQI forecasting
emergency pollution response
Continuous monitoring also helps scientists identify pollution trends and evaluate the effectiveness of pollution control measures.
Quick Takeaway: Real-time AQI monitoring helps authorities detect pollution spikes quickly and provide faster public air quality updates.
Conclusion
Real-time AQI data in India is collected using continuous air quality monitoring systems that measure pollutant concentrations throughout the day.
These monitoring stations transmit pollution data to CPCB and environmental reporting platforms, where pollutant measurements are validated and converted into AQI values.
Understanding how real-time AQI data is collected helps explain why AQI values change continuously and how air pollution information is generated for public reporting.
Frequently Asked Questions
What is real-time AQI data?
Real-time AQI data refers to continuously updated pollution measurements collected from automated air quality monitoring stations.
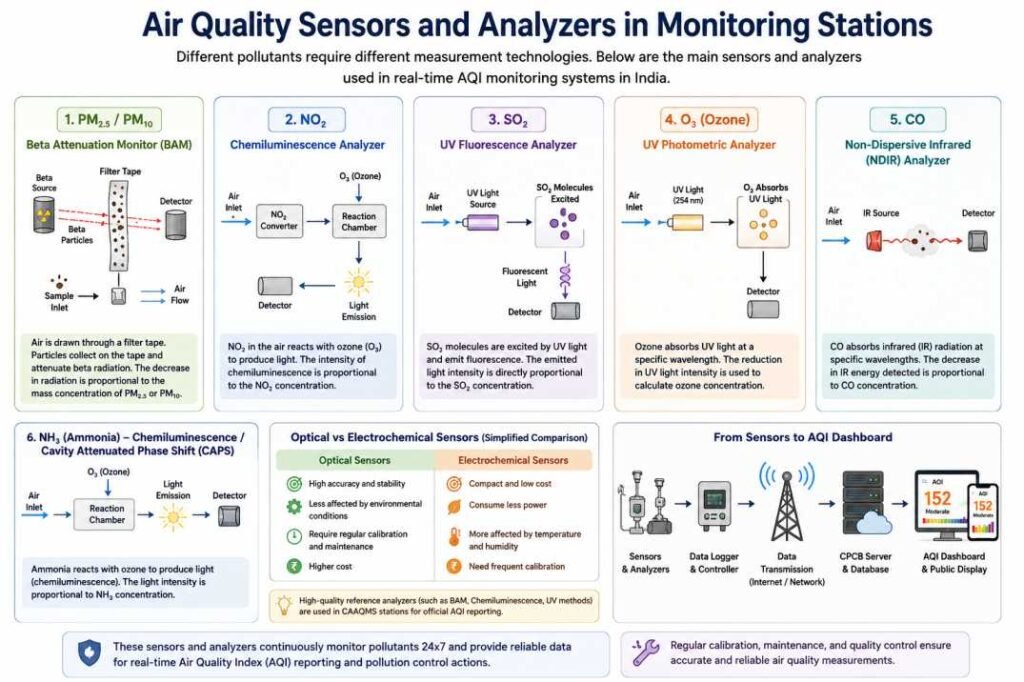
Which pollutants are measured in real-time AQI systems?
Real-time AQI systems commonly measure PM₂.₅, PM₁₀, NO₂, SO₂, O₃, CO, and NH₃.
What is CAAQMS?
CAAQMS stands for Continuous Ambient Air Quality Monitoring System. These systems continuously measure air pollutants and transmit data automatically for AQI reporting.
Why does AQI change throughout the day?
AQI changes because pollution levels vary due to traffic emissions, weather conditions, industrial activity, and atmospheric changes.
Who manages AQI reporting in India?
AQI reporting in India is coordinated mainly through the Central Pollution Control Board (CPCB) and associated environmental monitoring agencies.
Why do AQI apps sometimes show different values?
AQI values may differ slightly between apps because reporting platforms can use different monitoring stations, update intervals, or data validation methods.
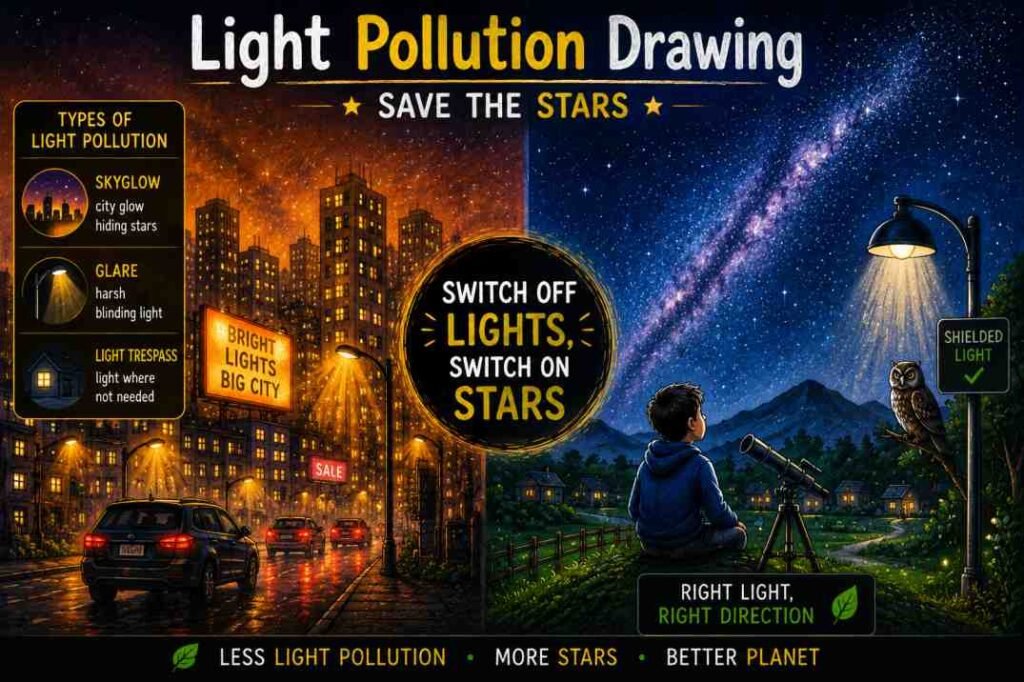
Light pollution occurs when artificial lighting is excessive or poorly directed, causing the night sky to become brighter than it naturally should be. Instead of illuminating only the intended area, unwanted light escapes upward and outward, reducing natural darkness and making stars less visible.
In many cities, streetlights, billboards, floodlights, and decorative LED lights produce excess artificial light that spreads upward and outward, creating a bright glow over urban areas known as skyglow. As a result, fewer stars are visible at night, and excessive nighttime lighting can also disrupt wildlife and natural sleep patterns.
This guide presents easy light pollution drawing ideas that help students explain how excessive nighttime lighting affects stars, wildlife, sleep, and energy conservation through simple, educational posters. Whether you’re preparing a school project, EVS assignment, or environmental awareness competition, these ideas combine creativity with scientific understanding.
Quick Answer Box
What is Light Pollution?
Light pollution is excessive, misdirected, or unnecessary artificial light at night that brightens the sky, reduces natural darkness, and interferes with the visibility of stars. It is commonly caused by unshielded streetlights, floodlights, illuminated billboards, stadium lighting, and decorative LED lights.
Main Effects of Light Pollution
Reduces the visibility of stars and the Milky Way
Creates skyglow, glare, and light trespass
Disrupts wildlife behavior and natural sleep cycles
Wastes electricity through unnecessary outdoor lighting
Understanding Light Pollution
Light pollution occurs when artificial lighting is excessive, poorly directed, or used where it is unnecessary at night. Instead of illuminating only the intended area, artificial light spreads into the sky, nearby homes, and natural habitats. This unwanted light reduces natural darkness and creates environmental, health, and visibility problems.
The most noticeable effects of light pollution include:
Reduced visibility of stars and the Milky Way
Disrupted human sleep cycles
Disturbed movement and behavior of nocturnal wildlife
Increased energy waste from unnecessary outdoor lighting
In many Indian cities, decorative LED lighting, illuminated commercial signboards, wedding floodlights, and unshielded streetlights contribute significantly to skyglow and nighttime glare, making it harder to observe a naturally dark night sky.
To make your light pollution drawing more accurate and educational, include the four main types of light pollution shown below. Understanding these categories will help you create a poster that explains both the causes and effects of excessive nighttime lighting.
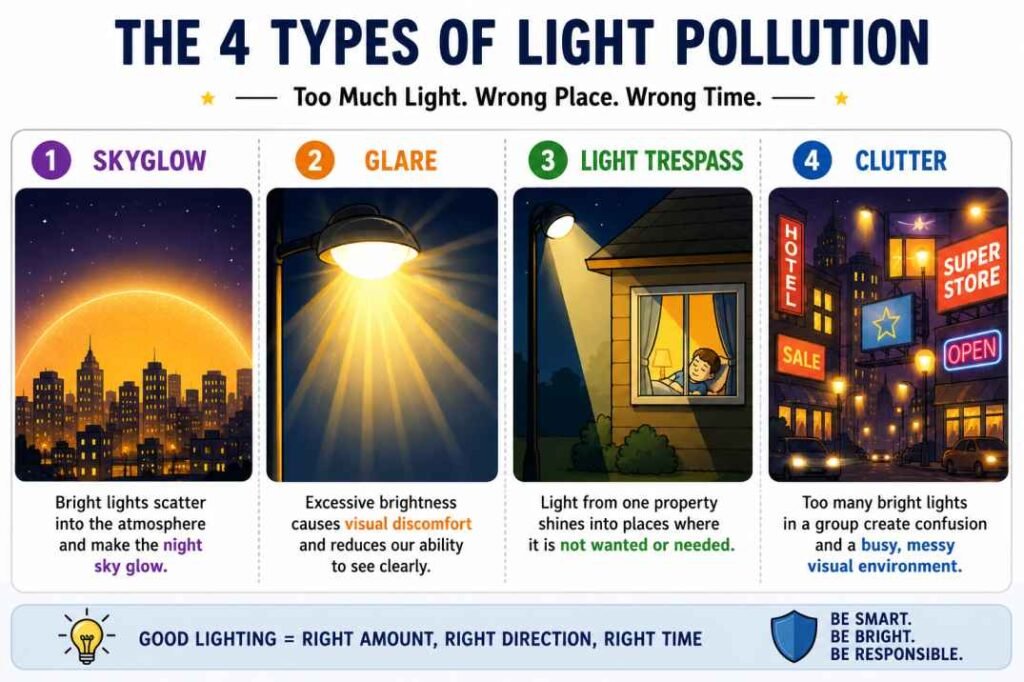
The 4 Types of Light Pollution
Educational infographic showing the four main types of light pollution with simple real-world examples for students.
1. Skyglow
Skyglow is the orange or whitish glow visible above cities at night. It occurs when artificial light scatters through dust, water vapor, and other particles in the atmosphere, brightening the night sky and making stars difficult to see.
Drawing Idea:
A bright city skyline with very few visible stars.
2. Glare
Glare is excessively bright light that causes visual discomfort and can temporarily reduce visibility. It is commonly produced by unshielded LED lights, vehicle headlights, and powerful outdoor floodlights.
Drawing Idea:
A person covering their eyes from a harsh floodlight or streetlight.
3. Light Trespass
Light trespass occurs when unwanted artificial light spills into areas where it is not needed, such as through a bedroom window or into natural wildlife habitats.
Drawing Idea:
Streetlight rays entering a sleeping child’s room.
4. Clutter
Light clutter refers to a dense concentration of bright lights in one area, such as busy commercial streets, shopping districts, or advertising zones. Too many closely grouped lights can create visual confusion and increase nighttime glare.
Drawing Idea:
Multiple glowing signboards and tangled electric lights in a busy city street.
Materials Needed for Your Drawing
Choosing the right drawing materials can make your light pollution poster more realistic and visually effective. Dark backgrounds combined with bright contrast colors help highlight skyglow, glare, and artificial lighting, making the environmental effects easier to understand.
Base Paper
Black or dark blue chart paper for creating realistic nighttime backgrounds and strong contrast.
White drawing paper for colored pencils, crayons, watercolors, or sketch pens.
Coloring Tools
Oil pastels for blending realistic skyglow and light effects.
Yellow, orange, and white colors to highlight artificial lighting.
Dark blue, purple, and black shades for creating natural nighttime skies.
Extra Tools
Ruler for drawing straight light rays and building edges.
Pencil and eraser for sketching city skylines before coloring.
Drawing Tip for Students
Keep most of the background dark and use bright colors only for artificial light sources. This creates stronger contrast and makes the effects of light pollution easier to recognize.
Beginner-Friendly Option
Students in lower classes can create simple posters using crayons or sketch pens instead of advanced coloring materials. Focus on one clear message rather than adding too many details.
What Is a Light Pollution Poster?
A light pollution poster is an educational drawing that explains how excessive artificial lighting affects stars, wildlife, human health, and energy conservation. Students commonly create these posters for school projects, EVS activities, environmental awareness campaigns, and poster competitions.
How to Draw a Light Pollution Poster
Start by drawing a dark nighttime background using black, dark blue, or purple shades. A dark sky creates strong contrast, making artificial lighting and skyglow easier to highlight.
Next, add bright artificial light sources such as streetlights, billboards, floodlights, or illuminated buildings. These elements show the common sources of light pollution in urban areas.
To show light pollution effects, add glowing halos, glare, or skyglow around bright lights using yellow, orange, or white shades. Soft blending can make artificial lighting appear more realistic.
Include stars, wildlife, sleeping people, or a dark rural landscape to compare natural darkness with brightly lit urban areas. This visual contrast makes the effects of light pollution easier to understand.
Finally, label important features with terms such as “Skyglow,” “Glare,” or “Light Trespass,” and finish your poster with a short awareness slogan. Scientific labels make your drawing more informative, while a clear slogan reinforces the environmental message.
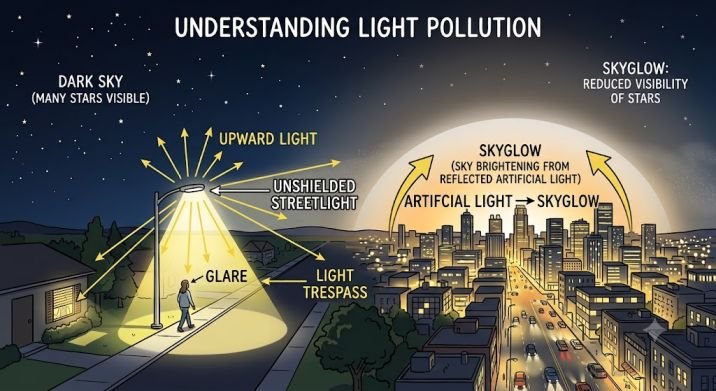
Simple Light Pollution Diagram
The labeled diagram below illustrates how unshielded outdoor lighting creates the four main types of light pollution: upward light, glare, light trespass, and skyglow. Understanding these effects will help you identify the correct elements to include in an accurate and educational light pollution poster.
This simple light pollution diagram explains how unshielded streetlights create upward light, glare, light trespass, and skyglow, reducing the visibility of stars and brightening the night sky.
Class-Wise Strategy for Students
Students of different age groups can choose drawing ideas based on their artistic skills and scientific understanding. The suggestions below help match each class level with an appropriate poster topic.
Class Range
Recommended Poster Idea
Awareness Focus
Class 1–3
Stars, moon, and switching off lights
Understanding the importance of natural darkness and switching off unnecessary lights
Class 4–6
Skyglow, wildlife, and city lighting
Understanding how excessive lighting affects stars, wildlife, and the environment
Class 7–10
Sleep disruption, energy waste, and shielded lighting
Scientific and health impacts of light pollution
Easy Light Pollution Drawing Ideas
The drawing ideas below are simple, beginner-friendly, and designed to communicate one clear environmental message. They are suitable for school projects, EVS activities, classroom assignments, and poster competitions. You can choose a concept such as a bright streetlight hiding the stars, a city affected by skyglow, or a hand switching off unnecessary lights to create an effective awareness poster.
Light Pollution Drawing Ideas for Students
The following light pollution drawing ideas are simple, educational, and suitable for school projects, EVS activities, and environmental awareness competitions. Each idea focuses on a different effect of excessive nighttime lighting and can be adapted for students of different age groups.
1. Light Switch Action (Beginner-Friendly)
Draw a hand switching off an unnecessary outdoor light while stars gradually reappear in the night sky. This simple before-and-after concept shows how reducing unnecessary lighting helps restore natural darkness and improve the visibility of stars.
Create a split poster comparing a brightly lit city with a dark rural landscape. The city side should show skyglow and only a few visible stars, while the rural side highlights a naturally dark sky filled with stars.
Educational Message: Excessive urban lighting creates skyglow, reducing the visibility of stars and the natural beauty of the night sky.
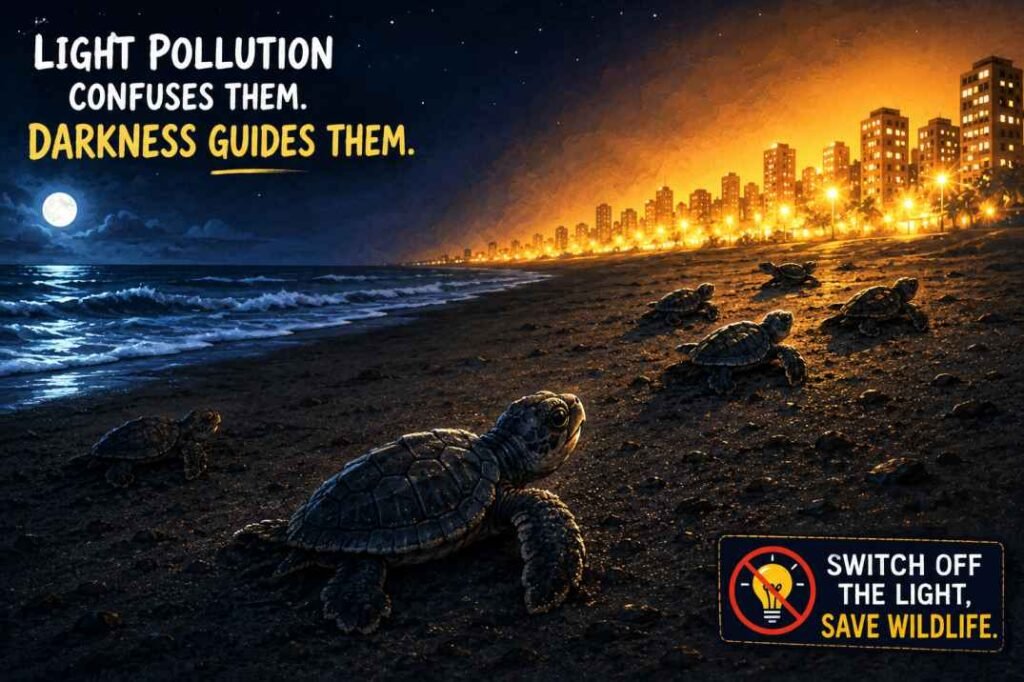
3. Sea Turtle Confusion
Draw baby sea turtles moving toward bright artificial lights instead of the ocean. This poster demonstrates how coastal lighting can interfere with wildlife navigation and natural behavior.
Educational Message: Artificial lighting near beaches can confuse baby sea turtles and disrupt their journey to the sea.
Artificial lighting near beaches can confuse baby sea turtles and disrupt their natural movement toward the ocean.
4. Sleep Disruption from Artificial Light
Illustrate a student trying to sleep while bright streetlight rays shine through a bedroom window. The contrast between darkness and artificial light clearly shows how nighttime lighting can interfere with healthy sleep.
Educational Message: Excessive outdoor lighting at night can reduce sleep quality by disrupting the body’s natural sleep cycle.
5. Festival Lights vs Stars
Draw brightly decorated streets during a festival or wedding celebration with very few visible stars overhead. Compare this with a naturally dark sky to highlight the impact of excessive decorative lighting.
Educational Message: Excessive decorative lighting during celebrations contributes to skyglow and reduces the visibility of the night sky.
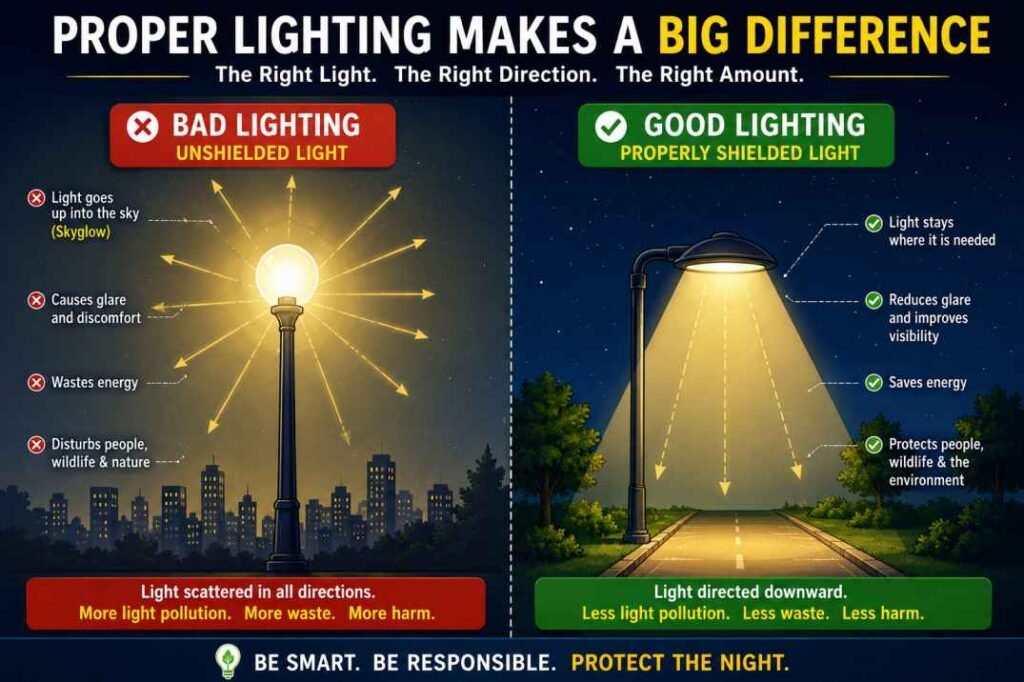
Comparison showing how properly shielded lights reduce glare, skyglow, and wasted energy compared with unshielded lighting.
Common Mistakes Students Should Avoid
Overcrowding the Poster
Avoid filling your poster with too many buildings, lights, slogans, and decorative elements. Focusing on one clear environmental message makes your drawing easier to understand and more visually effective.
Using Bright Backgrounds
Avoid using white or very bright backgrounds for your poster. Dark blue, purple, or black backgrounds create stronger contrast, making skyglow, stars, and artificial lighting easier to distinguish.
Missing Scientific Labels
Label important features using scientific terms such as “Skyglow,” “Glare,” “Light Trespass,” or “Clutter.” Clear labels help viewers understand the environmental concept behind your drawing.
Weak Contrast Between Dark and Bright Areas
When comparing natural darkness with brightly lit urban areas, use strong contrast so the difference is immediately visible. A clear visual comparison makes your environmental message easier to understand, even from a distance.
Ignoring Accuracy
Make sure your drawing matches real examples of light pollution. For instance, skyglow should appear above cities, while light trespass should show unwanted light entering homes or natural habitats. Accurate illustrations make your poster more educational and scientifically correct.
Light Pollution in India: A Growing Concern
Light pollution is becoming more noticeable in many Indian cities and towns due to excessive decorative lighting, illuminated commercial signboards, floodlights, and unshielded streetlights. These light sources brighten the night sky, reduce natural darkness, and make stars more difficult to see.
During festivals, wedding celebrations, and large public events, decorative LEDs and temporary floodlights can make stars less visible by increasing skyglow. In busy urban areas, illuminated billboards, shopping districts, and high-rise buildings also contribute to glare and excessive nighttime brightness.
Students can identify signs of light pollution by observing:
Areas where only a few stars are visible.
Overly bright or unshielded streetlights.
Artificial light entering homes through windows at night.
Excessive decorative lighting during festivals or celebrations.
Using shielded outdoor lighting and reducing unnecessary nighttime illumination can help protect natural darkness, save energy, and improve the visibility of the night sky.
In some large Indian cities, increasing skyglow means that only a few bright stars remain visible at night. This highlights the importance of using responsible outdoor lighting to protect India’s natural night skies for future generations.
Why Light Pollution Matters
Light pollution affects more than the visibility of stars. Excessive artificial lighting at night can disrupt human health, interfere with wildlife behavior, and waste electricity through unnecessary outdoor lighting.
Sleep and Nighttime Lighting
The human body naturally produces melatonin in response to darkness, helping regulate healthy sleep cycles. Bright artificial lighting at night, especially near homes and bedrooms, can interfere with this natural process and reduce sleep quality.
Wildlife and Darkness
Many animals rely on natural darkness for hunting, migration, feeding, and nighttime movement. Artificial lighting can confuse birds, insects, sea turtles, and other nocturnal wildlife, disrupting their natural behavior.
Wasted Light and Skyglow
Unshielded outdoor lighting often directs unnecessary light into the sky instead of illuminating the intended area. This wasted light increases electricity consumption and contributes to skyglow, reducing the visibility of the night sky.
Understanding these effects helps students create posters that not only look attractive but also explain why responsible outdoor lighting is important for people, wildlife, and the environment.
Tips for Creating an Effective Light Pollution Poster
An effective light pollution poster should communicate one clear environmental message while using simple visuals that are easy to understand. The following tips will help you create a poster that is both visually appealing and educational.
Use Clear Night-Sky Contrast
Use a dark background with bright artificial light sources to create strong visual contrast. This makes skyglow, glare, and other light pollution effects easier for viewers to recognize.
Focus on One Main Message
Choose one central theme, such as skyglow, wildlife, sleep, or energy conservation. A focused poster is easier to understand and leaves a stronger impression than one covering too many ideas.
Label Important Concepts
Use short labels for important features, such as “Skyglow,” “Glare,” “Light Trespass,” or “Clutter.” Scientific labels help viewers quickly understand the environmental concept shown in your drawing.
Make Important Elements Easy to Notice
Arrange important elements such as stars, wildlife, streetlights, and city lights so they are easy to identify at a glance. Avoid hiding the main message behind unnecessary details or decorations.
Light Pollution Drawing Competition Tips
If you are preparing a poster for a school drawing competition, focus on one clear environmental message instead of adding too many ideas to the same drawing. Use strong contrast between a naturally dark sky and brightly lit urban areas so the effects of light pollution are easy to recognize.
Include simple scientific labels such as “Skyglow,” “Glare,” or “Light Trespass” where appropriate. Keep your slogan short and make sure the main elements, such as stars, wildlife, or streetlights, remain clearly visible. A well-organized poster that combines scientific accuracy with creativity is usually more effective than a drawing filled with unnecessary details.
Common Questions About Light Pollution
Why can’t we see many stars in cities?
Bright artificial lighting creates skyglow by scattering light into the atmosphere. This brightens the night sky, making faint stars difficult to see, especially in heavily populated urban areas.
What are the main causes of light pollution?
The main causes of light pollution include unshielded streetlights, floodlights, illuminated billboards, stadium lighting, and excessive decorative LED lights. These light sources spread unnecessary light into the sky and surrounding areas instead of focusing it where it is needed.
How does light pollution affect wildlife?
Artificial lighting can confuse birds, insects, sea turtles, and other nocturnal animals by disrupting their natural movement, migration, and navigation, all of which depend on darkness.
What is the easiest light pollution drawing for kids?
One of the easiest ideas is to draw a bright streetlight with only a few visible stars and a child switching off the light. Add a simple slogan such as “Switch Off Lights, Save the Stars” to clearly communicate the environmental message.
What should a light pollution poster include?
A good light pollution poster should include a clear illustration of excessive artificial lighting, visible effects such as skyglow or glare, natural elements like stars or wildlife, scientific labels where appropriate, and one simple environmental message.
Which colors are best for a light pollution poster?
Dark blue, black, and purple backgrounds create strong contrast, while yellow, orange, and white colors help illustrate artificial lighting and skyglow. This is consistent with the materials guidance earlier in the article.
Which type of light pollution is easiest to draw?
Skyglow is one of the easiest types to illustrate because it can be shown as a bright city skyline with only a few visible stars, making the environmental impact easy to understand. This reflects the earlier “Skyglow” example.
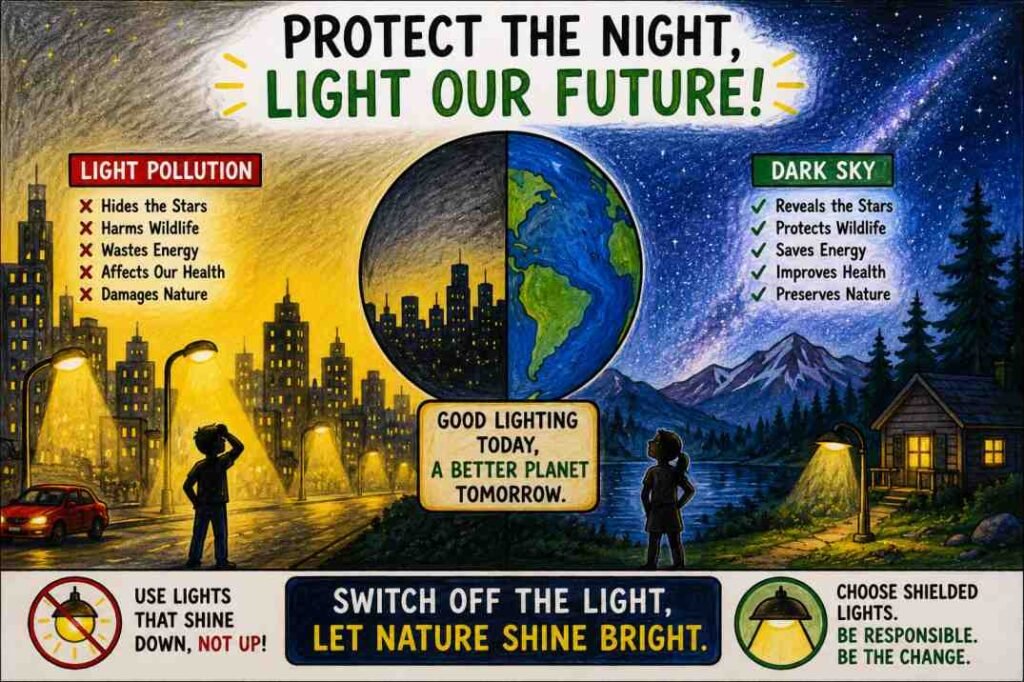
Student awareness poster showing how reducing unnecessary lighting can help protect stars, wildlife, and natural darkness.
Simple Poster Checklist
✓ Did I include at least one scientific term such as “Skyglow,” “Glare,” “Light Trespass,” or “Clutter”?
✓ Does the poster communicate one clear environmental message?
✓ Is the contrast between the dark sky and artificial lighting easy to see?
✓ Are the main elements, such as stars, streetlights, or wildlife, clearly visible?
Conclusion
Light pollution drawings help students understand why protecting natural darkness is important for stars, wildlife, human health, and energy conservation. By creating simple posters and visual comparisons, students can raise awareness about responsible nighttime lighting in schools and communities.
Even small changes, such as reducing unnecessary outdoor lighting and using shielded fixtures, can help preserve darker night skies while saving energy and supporting the environment.
Globe at Night — Citizen-science project for observing and measuring night-sky visibility.
These resources provide additional educational information for students and teachers who want to learn more about light pollution and responsible outdoor lighting.
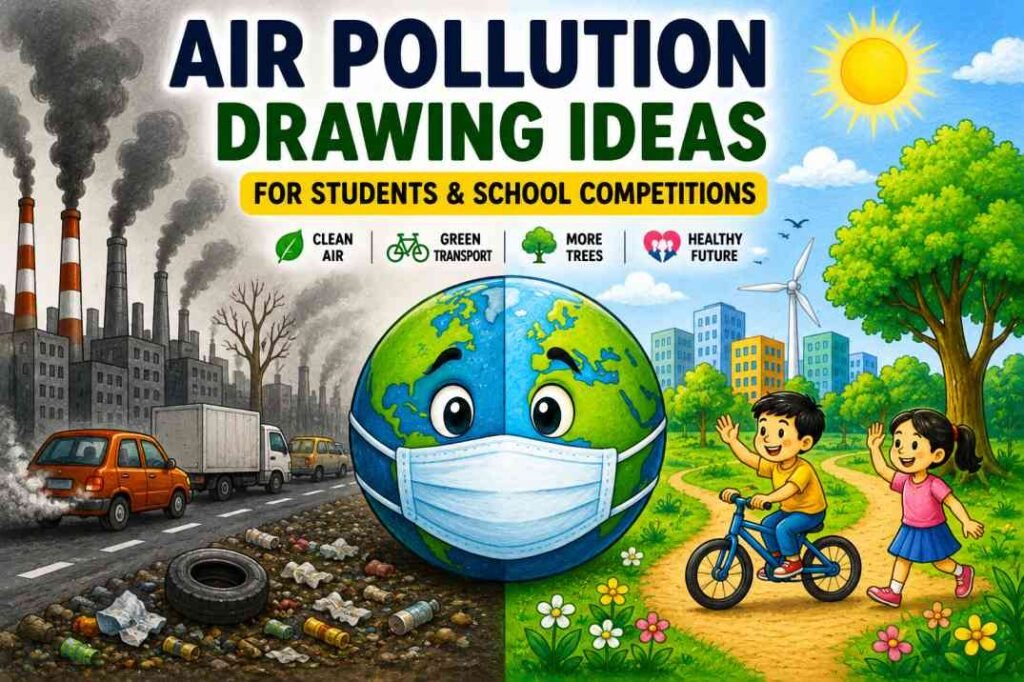
Quick Answer: Air pollution drawing ideas help students create meaningful school posters that explain environmental problems through simple visual comparisons. This guide helps students choose age-appropriate drawing themes, understand what judges often look for in school competitions, avoid common poster mistakes, and learn the environmental concepts behind each drawing idea.
In many Indian schools, air pollution is a common theme for EVS activities, science projects, and poster competitions because it connects environmental awareness with creative learning. The drawing ideas in this guide cover topics such as polluted vs clean environments, traffic pollution, factory emissions, and practical solutions that are suitable for different class levels.
If you want to understand the science behind these drawing ideas, you can also explore our detailed guide on What Is Air Pollution?. Whether you are preparing for a classroom activity, school project, or drawing competition, this guide will help you select an appropriate theme and present a clear environmental message.
How School Poster Competitions Are Usually Judged
In many school competitions, teachers and judges first look for whether the environmental message is clear and easy to understand at first glance. Simple posters with one strong idea often perform better than overcrowded drawings.
Students can improve their posters by focusing on:
clear contrast between polluted and clean environments
neat outlines and readable labels
one strong environmental message
balanced coloring instead of excessive decoration
simple slogans that are easy to remember
Make sure every major object in the drawing supports the main environmental message instead of adding unnecessary decorative elements.
Original ideas usually stand out more than copied designs during classroom evaluations. Posters that accurately explain an environmental concept often leave a stronger impression than posters that focus only on artistic decoration.
Common Mistakes Students Should Avoid
Avoid overcrowding the page with too many ideas.
Use dark outlines so important details are easy to see.
Keep the environmental message simple and easy to understand.
Check slogan spelling before final coloring.
Try to add original ideas instead of copying internet drawings exactly. Judges often notice when posters follow common internet templates without adding a personal environmental message or explanation.
Avoid adding pollution sources, scientific labels, or slogans that you cannot explain if a teacher or judge asks about them.
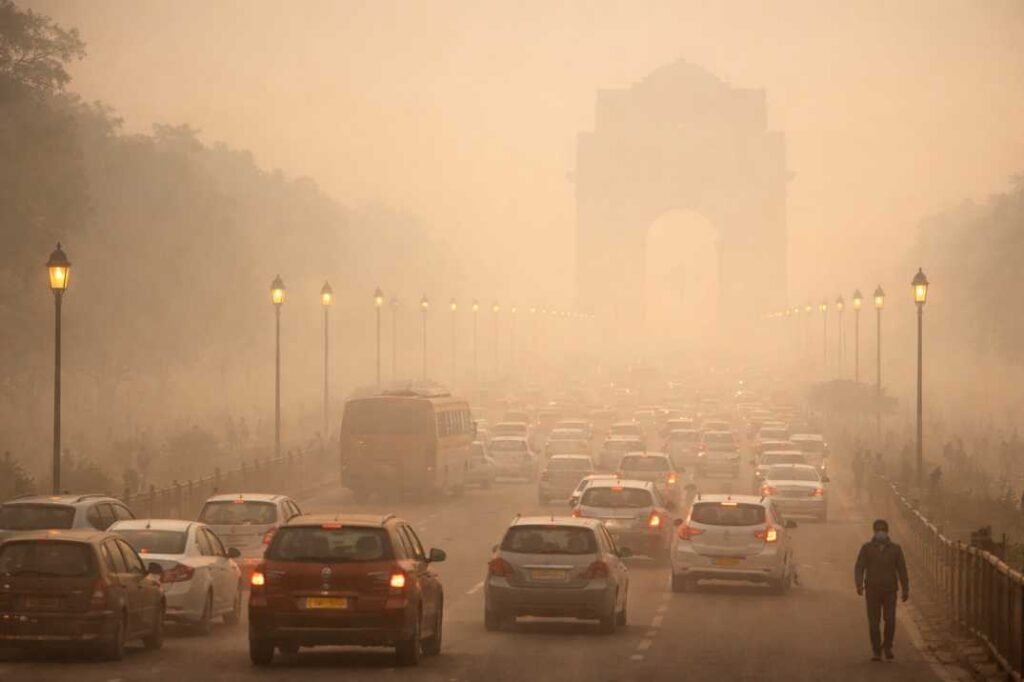
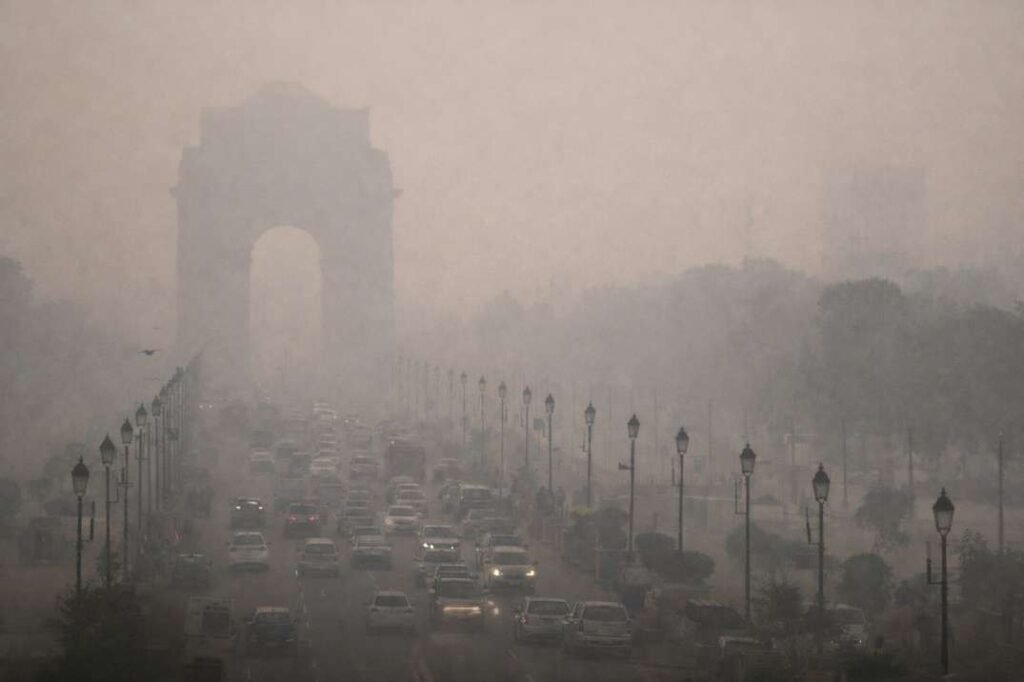
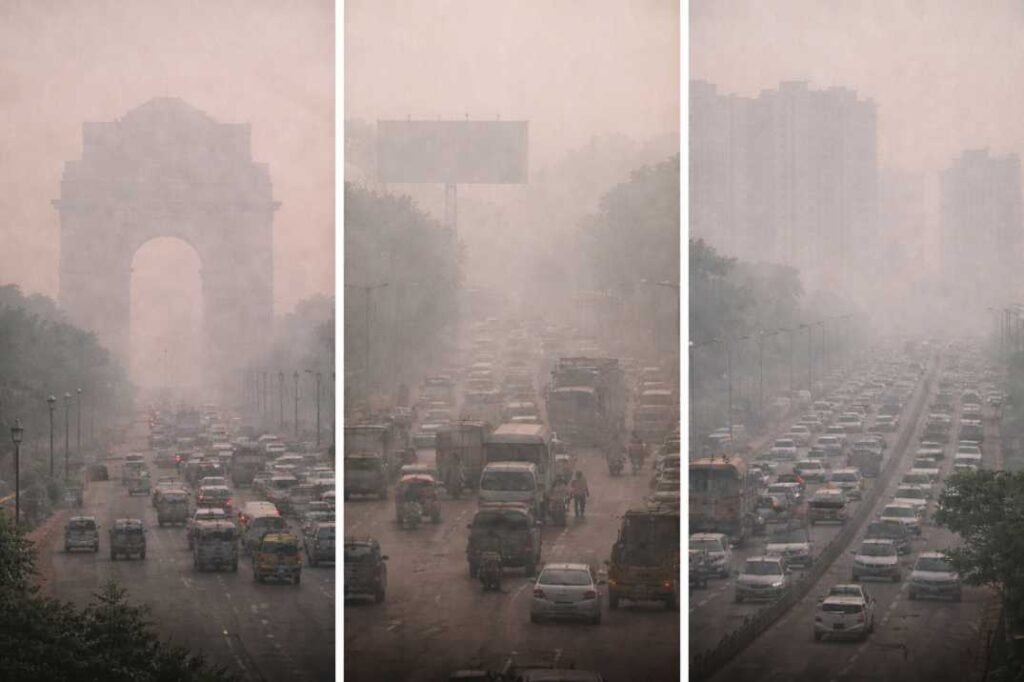
Air Pollution in Indian Cities
Many air pollution drawing themes are inspired by real environmental problems seen in Indian cities. Understanding these examples helps students create posters that are not only visually appealing but also scientifically meaningful.
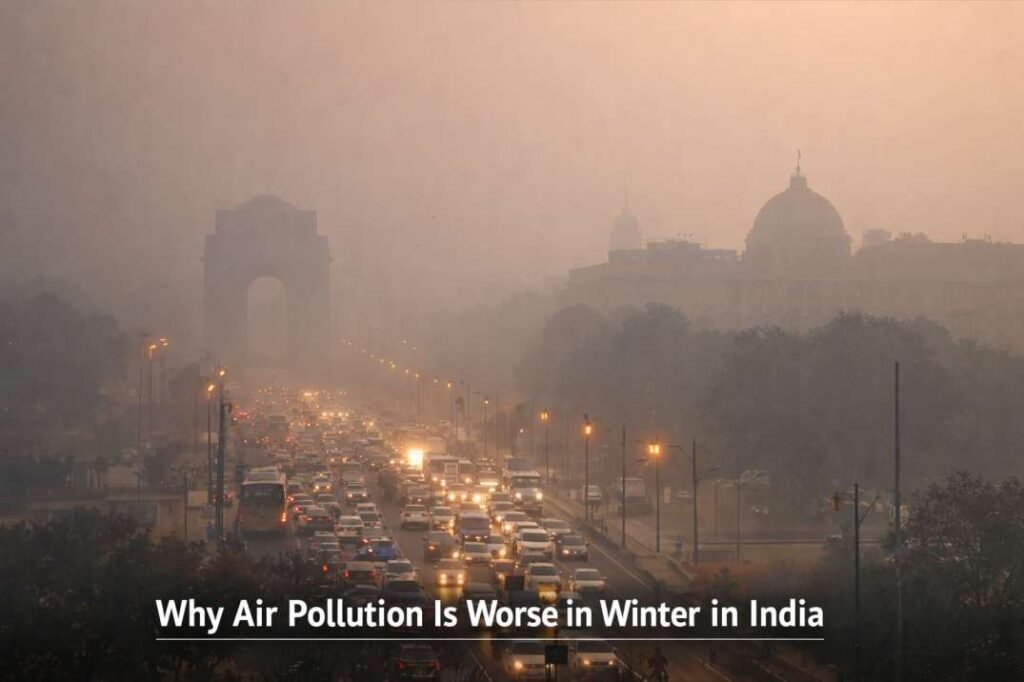
Several Indian cities experience seasonal air pollution caused by traffic emissions, industrial activities, construction dust, and weather conditions. These real-world situations often inspire themes used in EVS projects and school poster competitions.
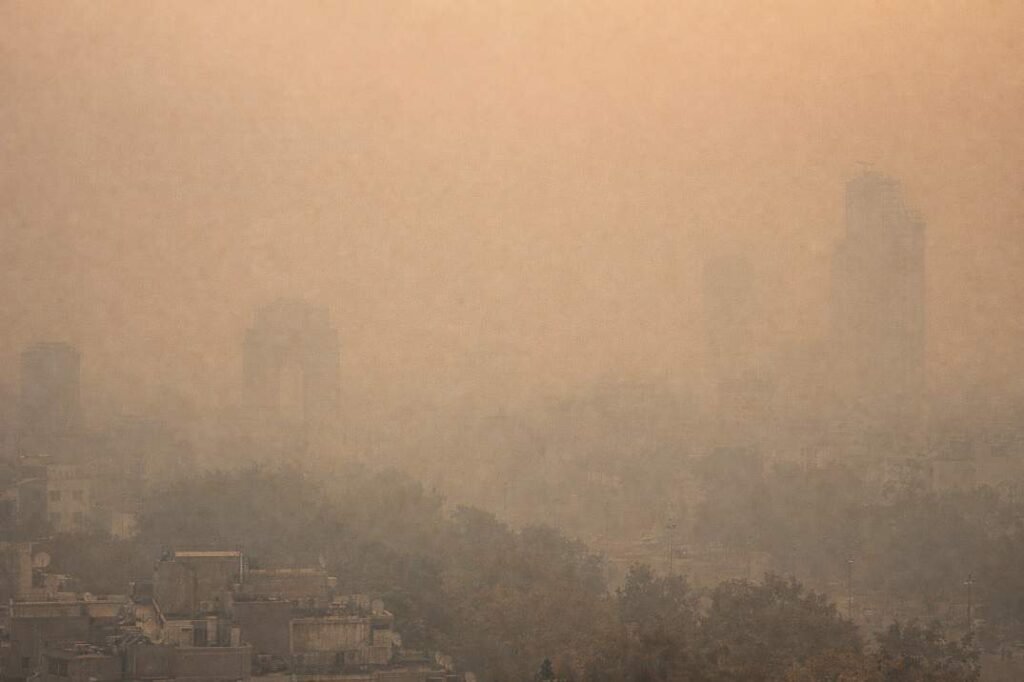
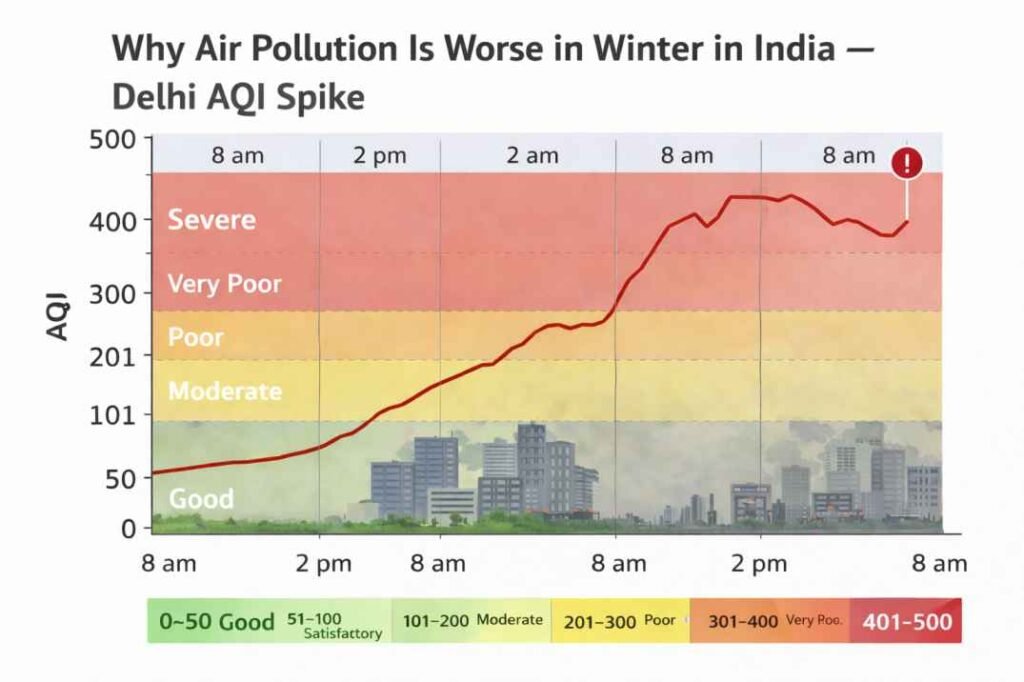
Cities like Delhi, Kolkata, and Kanpur often experience high pollution levels during winter because smoke, dust, and pollutants remain trapped close to the ground.
Students who want to understand how air quality is measured and why pollution levels vary between cities can explore our detailed guide on How AQI Is Calculated.
Real-World Example: During severe winter pollution episodes, cities such as Delhi have recorded AQI levels above 300, which fall into the Very Poor or Severe air quality categories. At these levels, prolonged outdoor activity may increase health risks, especially for children, older adults, and people with respiratory conditions.
These real-world examples can help students create more accurate posters by connecting their drawings with actual environmental conditions rather than using generic pollution scenes.
Materials Needed for Air Pollution Drawings
Most school air pollution posters can be created using basic classroom supplies. Choosing the right materials helps students make important objects, labels, and environmental comparisons easier to understand, especially during classroom presentations and drawing competitions.
Material
Why It Is Useful
Drawing paper
Provides enough space to compare clean and polluted environments without making the poster look crowded.
HB Pencil
Helps sketch the layout before adding colour, making it easier to correct mistakes.
Crayons or Colour Pencils
Allow students to create clear visual contrast, such as grey skies for pollution and blue skies for clean air.
Black Marker
Makes outlines, labels, and slogans easier to read from a distance.
Scale
Useful for dividing posters into comparison layouts such as “Clean City vs Polluted City” or creating neat title boxes.
Classroom Tip
Before colouring, lightly sketch the main layout so that pollution sources, environmental solutions, and slogans fit naturally on the page without overlapping each other.
Class-wise Air Pollution Drawing Ideas
Every age group understands environmental topics differently. Younger students usually learn through simple visual comparisons, while older students can explain pollution causes, health effects, and practical solutions in greater detail. The ideas below are matched to typical classroom learning levels so students can create posters that are both creative and educational.
Class Level
Recommended Drawing Theme
Main Learning Focus
Class 3
Clean vs Polluted Park
Recognizing clean and dirty surroundings
Class 4
Traffic Pollution
Understanding vehicle emissions
Class 5
Factory Smoke
Identifying pollution sources
Class 6
Save Trees, Save Air
Linking nature with cleaner air
Class 7
Air Pollution and Health
Understanding health impacts
Class 8
Climate, Pollution, and Solutions
Connecting environmental problems with practical actions
The class-wise suggestions below can help students choose drawing ideas that match their age, learning level, and school competition requirements.
Air Pollution Drawing Ideas for Class 3
Class 3 students learn best through simple visual comparisons. A poster showing one side with clean trees, birds, and blue skies and the other with smoke, litter, and polluted air makes the environmental message easy to understand.
Drawing Tip: Use large objects, bright colours, and minimal text so the main idea is immediately clear.
Why this works: Young learners can quickly understand the difference between healthy and polluted environments through clear visual contrast.
Air Pollution Drawing Ideas for Class 4
At this stage, students can begin showing common causes of pollution. Drawings featuring busy roads, vehicles releasing smoke, and people choosing bicycles or walking introduce the idea that transportation affects air quality.
Teacher Suggestion: Encourage students to explain why cleaner transport helps reduce pollution instead of focusing only on making the poster colourful.
Air Pollution Drawing Ideas for Class 5
Students are ready to identify multiple pollution sources. A drawing showing factories releasing smoke alongside trees, clean energy, or pollution-control measures helps demonstrate both the problem and possible solutions.
Learning Goal: After completing the poster, students should be able to identify at least one pollution source and one practical way to reduce it.
Air Pollution Drawing Ideas for Class 6
Upper primary students can create more informative posters by connecting environmental awareness with everyday actions. Including labels such as vehicle emissions, construction dust, industrial smoke, and tree planting makes the drawing more educational.
Project Extension: Ask students to label important pollution sources and environmental solutions to strengthen both presentation and understanding.
Air Pollution Drawing Ideas for Class 7
Students at this level can explore how pollution affects both people and the environment. Posters may compare polluted neighbourhoods with cleaner communities while showing health effects such as coughing, masks, or reduced visibility caused by smog.
Classroom Discussion: After completing the poster, discuss how public transport, cleaner energy, and planting more trees could improve the situation shown in the drawing.
Air Pollution Drawing Ideas for Class 8
Older students can create more analytical posters by combining environmental science with practical solutions. Themes such as air quality, renewable energy, pollution control, and sustainable transport allow students to explain both environmental challenges and ways to address them.
Competition Advice: Focus on one clear environmental message instead of combining too many ideas. Judges often find well-organized posters easier to understand than crowded designs.
Air Pollution Drawing Themes
The following air pollution drawing themes are commonly used in school activities, EVS projects, and environmental awareness competitions. Each idea highlights a different aspect of air pollution, helping students choose a poster that matches their class level, creativity, and learning objectives.
1. Smoggy City vs Clean City
Each drawing below highlights a different environmental problem and encourages students to think about cleaner and healthier surroundings.
A sample drawing for Class 3–5 showing the contrast between urban pollution and a green, sustainable city.
What to Draw
Divide the drawing into two equal sections. Show one side with traffic congestion, factory smoke, dusty roads, and grey skies, while the other side features green trees, clean streets, bicycles, and a bright blue sky. This side-by-side comparison makes the environmental message easy to understand at first glance.
Drawing Tip
Keep the layout balanced by giving both sides equal space. Use contrasting colours so viewers can immediately recognize the difference between polluted and clean environments.
Suggested Slogan
“Choose Clean Air, Choose a Better Future.”
Learning Outcome
Students learn how transportation, industrial activities, and urban greenery directly influence air quality. The comparison also demonstrates that environmental conditions can improve through practical everyday actions.
Best For
Classes 3–6, EVS activities, and school poster competitions.
2. Earth Wearing a Mask
Example poster showing Earth Wearing a Mask poster used for school environmental awareness activities. Photo by GreenGlobe25.
What to Draw
Draw the Earth wearing a protective face mask surrounded by smoke, factories, and polluted air. Include healthy trees, birds, or clean skies in another part of the drawing to show that environmental protection can restore cleaner air.
Presentation Tip
Use darker colours around polluted areas and brighter shades around cleaner environments to strengthen the visual contrast.
Suggested Slogan
“Protect the Planet Before It Needs Protection.”
Environmental Concept
This theme helps students understand that air pollution affects people across the world and that protecting clean air is a shared environmental responsibility.
Best For
Classes 4–8 and environmental awareness campaigns.
3. Tree vs Factory Drawing
A comparison showing how factory emissions pollute the air while trees help improve environmental quality.
What to Draw
Illustrate a healthy green tree on one side and a factory releasing smoke on the other. Show how trees support cleaner air while industrial emissions contribute to pollution. Adding people planting trees can reinforce the solution.
Drawing Tip
Keep the factory and tree similar in size so the comparison remains visually balanced instead of making one side dominate the poster.
Suggested Slogan
“More Trees, Less Smoke.”
Learning Outcome
Students understand the relationship between industrial development, environmental protection, and the importance of balancing both for healthier communities.
Best For
Classes 5–8, EVS projects, and sustainability lessons.
4. Bicycle vs Cars Drawing
A drawing comparing traffic pollution with cleaner bicycle-friendly environments.
What to Draw
Show one road filled with cars releasing exhaust smoke and another with people cycling or walking in a cleaner environment. Include trees, pedestrians, and clear skies to reinforce the benefits of sustainable transportation.
Poster Tip
Focus on one clear transportation message instead of adding too many unrelated pollution sources.
Suggested Slogan
“Ride a Bicycle, Reduce Pollution.”
Environmental Concept
Students learn how everyday transportation choices influence emissions and why cleaner travel options help improve air quality.
Best For
Classes 3–7 and road safety or environmental awareness activities.
5. Healthy vs Polluted Lungs
What to Draw
Draw two sets of lungs side by side. One should appear healthy with fresh air and greenery, while the other shows smoke, harmful particles, and damaged tissue caused by polluted air.
Drawing Tip
Avoid excessive medical detail. Simple visual differences are usually easier for younger students to understand.
Suggested Slogan
“Healthy Air, Healthy Lungs.”
Learning Outcome
Students connect air quality with respiratory health and recognize why reducing pollution is important for protecting public health.
Best For
Classes 6–8, science exhibitions, and health awareness programmes.
6. Playground Pollution Drawing
What to Draw
Illustrate children planting saplings in a neighbourhood while birds, flowers, and clean skies represent a healthier environment. This theme focuses on positive environmental action rather than only showing pollution.
Creative Tip
Use cheerful colours and smiling characters to emphasize that everyone can contribute to cleaner air.
Suggested Slogan
“Plant Today for Cleaner Air Tomorrow.”
Environmental Concept
Students learn that individual and community actions, such as planting trees, can contribute to a healthier environment and improve local air quality over time.
Best For
Classes 3–6, World Environment Day activities, and school awareness campaigns.
7. Save Environment Poster
Sample classroom drawing showing Save Trees poster encouraging children to protect trees and improve air quality. Photo by GreenGlobe25.
What to Draw
Combine important environmental symbols such as trees, clean energy, recycling, bicycles, and pollution control measures into one well-organized awareness poster. Keep the design focused on a single environmental message instead of including too many unrelated ideas.
Competition Tip
Arrange the main message in the centre and use supporting illustrations around it to keep the poster neat and easy to understand.
Suggested Slogan
“Small Actions Create a Cleaner Future.”
Learning Outcome
Students bring together multiple environmental concepts into one poster while learning how individual actions support cleaner air and environmental conservation.
Best For
Classes 5–8, inter-school competitions, and environmental awareness programmes.
Colour Ideas for Air Pollution Drawings
Colours help viewers understand the message of a pollution poster even before they read the slogan. Using colour intentionally makes the comparison between polluted and clean environments much more effective.
Colour
Where to Use
Purpose
Grey or Dark Brown
Smoke, smog, factory emissions
Shows polluted air and poor visibility.
Black
Vehicle exhaust, outlines, labels
Makes important objects and text stand out clearly.
Green
Trees, parks, forests
Represents cleaner air and environmental protection.
Blue
Sky, rivers, fresh surroundings
Creates a visual contrast with polluted areas.
Yellow or Orange
Sunlight, awareness messages
Draws attention to key parts of the poster without making it look overcrowded.
Colour Tip
Limit the poster to a few consistent colours instead of using every available shade. A simple colour scheme usually makes the environmental message clearer.
Tips for Parents and Teachers
Parents and teachers can turn drawing activities into simple environmental learning exercises by encouraging observation, discussion, and creative thinking instead of focusing only on artistic skills.
Encourage students to explain the meaning behind their drawings
Discuss pollution sources such as traffic, smoke, and waste burning
Support original ideas instead of copied designs
Use simple environmental examples from daily life
Encourage discussions about clean air and healthier surroundings
Ask students to explain why they included each pollution source or environmental solution in their drawing.
These activities can improve both environmental awareness and creative thinking among students.
How to Make Your Poster More Effective
A good environmental poster should communicate its message within a few seconds. Before finalising your drawing, check the following:
Keep one clear environmental message.
Make the title large enough to read from a distance.
Avoid filling every empty space with decorations.
Place the slogan where it does not hide important illustrations.
Check that labels are easy to read after colouring.
Make sure the polluted and clean sections are visually balanced.
Leave enough empty space so the main message remains easy to notice instead of making the poster look crowded.
Everyday Actions That Reduce Air Pollution
An awareness poster becomes more meaningful when it also suggests practical solutions.
Students can include ideas such as:
Walking or cycling for short distances.
Using public transport when possible.
Planting and protecting trees.
Avoiding the burning of leaves or waste.
Saving electricity to reduce energy demand.
Supporting cleaner surroundings by reducing litter and open waste burning.
Participate in local tree plantation or school environmental awareness programmes whenever possible.
Why These Actions Matter
Small individual actions may seem limited, but when many people adopt cleaner habits together, they can contribute to healthier communities and better air quality.
Air Pollution Drawing Competition Slogans
Students can use simple slogans to make their posters more memorable during school competitions.
The best slogans are short, easy to remember, and directly connected to the main idea of the poster. Choose one slogan that supports your drawing instead of adding several different messages.
Clean Air, Healthy Future
Stop Pollution, Save Lives
Plant Trees, Breathe Free
Every Breath Matters
Reduce Pollution, Protect Nature
Clean Air Is Everyone’s Right
Green Cities, Better Lives
Say No to Dirty Air
Conclusion
Air pollution drawings combine creativity with environmental education by helping students explain real-world pollution problems through simple visual communication. Whether used for classroom learning, EVS projects, or school competitions, a well-planned poster can encourage awareness, discussion, and practical environmental action.
Environmental Lessons from These Posters
Traffic, smoke, and factory emissions are major causes of air pollution.
Trees and green spaces help improve environmental quality.
Pollution can affect breathing, health, and outdoor activities.
Simple posters can spread environmental awareness in schools and communities.
Small everyday actions, when practiced by many people, can contribute to cleaner air and healthier communities.
Official Educational Sources
The following government and international organizations publish reliable information about air pollution, air quality monitoring, environmental health, and public awareness. The educational concepts discussed throughout this guide are based on these trusted sources.
These organizations publish official information on air pollution, air quality monitoring, environmental health, and public awareness used throughout this educational guide.
Common Questions from Students
Which drawing theme is easiest for primary school students?
A Clean City vs Polluted City comparison is usually the easiest because the visual differences are simple to draw and easy for judges to understand.
Which theme is best for a school competition?
Choose a theme that combines a clear environmental message with practical solutions rather than showing pollution alone. Posters that explain both the problem and the solution are often easier for viewers to understand.
Should I add a slogan?
Yes. A short slogan supports the main idea, but it should complement the drawing instead of becoming the main focus of the poster.
Can I use real Indian examples?
Yes. Referring to familiar situations such as traffic pollution, construction dust, or winter smog can make a poster more relevant, provided the message remains simple and age-appropriate.
Final Takeaway
A strong air pollution drawing is more than an attractive picture. It should help viewers quickly understand the environmental problem, explain at least one practical solution, and encourage positive action. By choosing an age-appropriate theme, using clear visual comparisons, and keeping the message focused, students can create posters that are both creative and educational.
Learn More About Air Pollution
Students who want to explore air pollution in greater detail can continue with the following educational guides.
Air pollution levels in many Indian cities can rise rapidly during winter, traffic congestion, and stagnant weather conditions. In India’s CPCB AQI system, pollution levels above 200 can begin affecting even healthy individuals during repeated exposure, while AQI above 300 and 400 falls into the “Very Poor” and “Severe” categories.
Quick tip: If AQI stays above 200 for several hours, reduce unnecessary outdoor exposure and avoid prolonged outdoor exercise during severe pollution days.
Disclaimer:This article is for educational purposes only and does not replace medical advice.
What AQI Level Is Dangerous in India?
AQI becomes dangerous in India once it enters the “Poor” category above 200. At this stage, repeated exposure can begin affecting even healthy individuals, especially during outdoor activity and multi-day pollution episodes.
Levels above 300 (“Very Poor”) and 400 (“Severe”) require stronger precautions because breathing discomfort, irritation, and overall exposure risk increase significantly.
In real-world conditions:
Moderate AQI levels mainly affect sensitive groups
Higher pollution levels can affect a much larger portion of the population
Severe pollution conditions require reduced outdoor exposure and stronger precautions
These categories are defined under India’s CPCB AQI framework and are used across Indian cities to estimate pollution severity and health risk.
Even when AQI is labelled “Moderate” (101–200), prolonged exposure may still carry health risks, especially for children, elderly people, and individuals with asthma or heart conditions.
AQI Levels in India: What Is Considered Dangerous?
AQI Level
CPCB Category
Practical Risk
101–200
Moderate
Sensitive groups may experience discomfort
201–300
Poor
Even healthy individuals may be affected during repeated exposure
India uses the CPCB Air Quality Index (AQI) system to estimate pollution severity based on pollutants such as PM2.5, PM10, nitrogen dioxide, sulfur dioxide, carbon monoxide, and ozone.
Higher AQI levels generally increase both exposure risk and potential health impact.
The following CPCB AQI categories are commonly used to estimate pollution severity and health risk in Indian cities.
0–50 (Good): Minimal health risk
51–100 (Satisfactory): Minor discomfort possible for sensitive groups
101–200 (Moderate): Breathing discomfort may begin for sensitive individuals
201–300 (Poor): Repeated exposure can start affecting even healthy individuals
301–400 (Very Poor): Significant health effects may occur during prolonged exposure
Although AQI categories provide a general framework, real-world risk also depends on exposure duration, weather conditions, and individual health sensitivity.
To understand how these categories are calculated and used in real-time monitoring, see our detailed guide on how AQI is calculated in India.
When Does the AQI Level Become Dangerous in India?
AQI becomes increasingly dangerous as pollution levels rise and exposure continues over time. In practical terms, health risk increases significantly once AQI enters the “Poor” category above 200, especially during repeated outdoor exposure and multi-day pollution episodes.
PM2.5 particles can enter deep into the lungs and contribute to irritation, breathing discomfort, and long-term exposure risk. During severe winter pollution conditions, pollutants may remain trapped near the surface for several consecutive days, increasing cumulative exposure over time.
Very poor and severe AQI conditions can affect even healthy individuals, particularly during prolonged outdoor activity or stagnant weather conditions with low wind speeds.
PM2.5 particles can enter deep into the lungs and cause inflammation, stress on the lungs, and respiratory problems.
Why Sustained AQI Exposure Can Be More Harmful Than Short Pollution Spikes
Public attention around air pollution in India often focuses on sudden AQI spikes above 400 during winter. However, several consecutive days of AQI above 200 can also create serious cumulative exposure because the lungs receive less recovery time between pollution episodes.
During stagnant winter conditions and low wind speeds, pollutants may remain trapped near the surface for longer periods, increasing repeated exposure and overall respiratory stress over time.
Who Is Most at Risk from High AQI Levels?
Although poor air quality can affect everyone, some groups are more vulnerable to pollution exposure than others.
Children, elderly individuals, and people with asthma, COPD, or heart conditions may experience health effects earlier because their lungs or cardiovascular systems are more sensitive to pollutants.
Outdoor workers such as traffic police, delivery workers, drivers, and construction workers may also face higher cumulative exposure because they spend long hours near roads and polluted environments.
People living in densely populated urban or industrial areas may experience repeated exposure to elevated AQI levels over long periods.
During prolonged AQI levels above 200, health risk can gradually increase for almost everyone, not only sensitive groups. This becomes especially common during winter pollution episodes in many Indian cities.
Real Example: AQI Levels in Indian Cities (Delhi Case)
Delhi frequently experiences very poor or severe AQI conditions during winter because pollutants remain trapped near the surface under low wind speeds and temperature inversion conditions.
Residents often notice warning signs before checking AQI apps, including visible haze, throat irritation, burning eyes, and reduced visibility during morning commutes.
During prolonged pollution episodes, AQI can remain above 300 or 400 for several consecutive days, increasing cumulative exposure and overall health risk over time. Similar winter pollution patterns are also observed across several cities in northern India.
Author Observation: One common mistake is focusing only on the highest AQI reading of the day. In practice, several consecutive days above AQI 200 may create greater cumulative exposure than a single short pollution spike.
AQI 301–400: Reduce outdoor activity as much as possible and consider using a well-fitted N95 mask
AQI 401+: Stay indoors when possible and improve indoor air quality using filtration or air purifiers
During winter pollution episodes, outdoor conditions are often worse in the early morning when pollutants remain trapped near the surface. Checking local AQI regularly can help reduce unnecessary exposure.
Check AQI Before Going Out
Use official tools such as the CPCB Sameer app or SAFAR air quality platforms to monitor local AQI before outdoor travel, walks, or exercise.
During winter in many Indian cities, pollution can be worse in the early morning when air is stagnant. Outdoor conditions may improve slightly later in the afternoon, though checking local AQI first is still recommended.
Why AQI Can Become Dangerous Quickly
AQI can rise rapidly when pollutants remain trapped near the surface due to low wind speeds, stagnant air, temperature inversion, humidity, and winter weather conditions.
In many Indian cities, daily emissions from traffic, industry, and construction continue even when the atmosphere cannot disperse pollutants efficiently. As pollution builds up over multiple days, AQI levels can shift from moderate to very poor or severe conditions within a short period.
These rapid pollution increases are especially common during winter, when fog, humidity, and stable atmospheric conditions reduce visibility and trap pollutants closer to breathing level.
Once AQI enters the “Poor” category above 200, reducing unnecessary outdoor exposure becomes increasingly important. Very poor and severe AQI conditions can affect even healthy individuals, especially during multi-day pollution episodes and stagnant winter conditions.
Checking AQI regularly, adjusting outdoor activity, and reducing repeated exposure can help lower real-world pollution risk over time.
Quick Answer
AQI
Risk Level
0–100
Generally safe
101–200
Moderate
201–300
Poor
301–400
Very Poor
401–500
Severe
Common Questions About Dangerous AQI Levels
Is AQI 150 safe for kids in India?
No. 150 is “Moderate,” but for children with developing lungs, it can trigger asthma symptoms. It is best to limit their outdoor playtime when levels are above 100.
Can I use a regular cloth mask for AQI 300?
No. Cloth masks do not filter PM2.5 particles effectively. For AQI above 200, an N95 or FFP2 certified respirator is necessary to protect your lungs.
At what AQI should I turn on my air purifier?
You should ideally run an air purifier if the indoor AQI exceeds 50. If the outdoor AQI is above 200, an indoor purifier with a HEPA filter becomes essential to maintain safe breathing zones.
Is AQI 200 dangerous for healthy adults?
AQI 200 sits at the upper end of the Moderate category. Healthy adults can usually continue normal activities, but prolonged outdoor exposure may still increase discomfort and exposure risk.
Is AQI 300 considered hazardous?
AQI 300 is classified as Poor in India. It can affect both sensitive groups and healthy individuals, especially during extended outdoor exposure.
At what AQI should outdoor exercise be avoided?
Outdoor exercise should be reduced when AQI exceeds 200 and avoided during prolonged periods when AQI reaches 300 or higher, particularly for sensitive individuals.
Conclusion
Once AQI enters the “Poor” category above 200, reducing unnecessary outdoor exposure becomes increasingly important. Very poor and severe AQI conditions can affect even healthy individuals, especially during prolonged winter pollution episodes.
Checking AQI regularly and adjusting outdoor activity can help reduce real-world pollution exposure over time.
References
This article is based on publicly available frameworks, air quality guidance, and institutional resources, including:
Winter air pollution in India can rise rapidly because pollutants become trapped near the ground under stagnant weather conditions. During severe winter episodes, AQI levels may increase sharply even when traffic and industrial activity appear unchanged.
Temperature inversion, weak winds, lower mixing height, and humidity reduce the atmosphere’s ability to disperse pollutants efficiently. As pollution builds up over multiple days, air quality can quickly shift from moderate to severe conditions in many Indian cities.
Quick Answer: Winter pollution increases because weak winds, temperature inversion, and lower mixing height trap pollutants closer to the ground.
Winter Pollution = Constant Emissions + Zero Dispersion.
Winter pollution becomes especially dangerous when pollutants remain trapped for several consecutive days. Even if emissions stay similar, reduced atmospheric movement allows PM2.5 and other pollutants to accumulate more quickly near breathing level.
The Atmospheric Trap: Why the Air Stops Moving
During winter nights, the ground cools quickly while warmer air remains above it. This creates a layer that traps pollutants near the surface instead of allowing them to rise and disperse.
Temperature Inversion: The “Lid” Effect
Normally, warm air near the ground rises and helps carry pollutants upward. During winter nights, however, the ground cools quickly while warmer air remains above it. This creates a layer that traps smoke, dust, and exhaust closer to the surface instead of allowing them to disperse.
The Shrinking Mixing Layer
The atmosphere can be imagined as a room with a ceiling.
In summer, the “ceiling” is higher, giving pollution more space to spread out.
In winter, the mixing layer becomes much lower, so the same amount of pollution becomes more concentrated near breathing level.
Geography: Why North India Faces More Severe Winter Pollution
North India often experiences stronger winter pollution because the Indo-Gangetic Plain frequently has weak winds, stagnant air, and poor atmospheric ventilation during colder months.
Pollutants from traffic, industry, dust, and seasonal burning can remain trapped across large areas instead of dispersing quickly. This allows pollution from multiple nearby regions to combine into one broader pollution episode.
Some coastal cities experience better air movement due to sea breezes, which can help disperse pollutants more efficiently.
Major Sources of Winter Pollution
Winter weather mainly traps pollution that is already being produced through daily human activities. Common contributors include traffic emissions, road dust, industrial activity, construction work, biomass burning, and seasonal crop-residue burning.
During stagnant winter conditions, these pollutants remain closer to the surface for longer periods instead of dispersing quickly, causing AQI levels to rise more rapidly.
Why Winter Pollution Spikes Become Worse
Winter pollution episodes in North India can intensify further during crop-residue burning periods, festival emissions, humid weather conditions, and stagnant air.
High humidity and low wind speeds may also increase fine-particle formation in the atmosphere, allowing pollution to remain trapped near the surface for longer periods.
In many Indian cities, winter pollution often worsens during early morning and late evening hours when colder temperatures and weaker air circulation reduce dispersion further.
How Authorities Respond During Severe Winter Pollution
During severe winter pollution episodes in Delhi-NCR, authorities may temporarily introduce emergency measures such as construction restrictions, traffic controls, school advisories, and dust-control actions to reduce exposure and limit additional emissions.
These actions are usually implemented when AQI reaches very poor or severe levels for extended periods.
Note: Winter pollution is often dangerous before it is visible. In late October 2025, several IGP cities hit “Very Poor” AQI while the sun was still shining brightly.
Decision Rule: Winter pollution is not always visible. Even on clear-looking days, AQI levels may still remain unhealthy.
How Winter Air Pollution Affects Health
Winter pollution can irritate the eyes, throat, and lungs, especially during prolonged exposure to fine particles such as PM2.5. High AQI levels may also reduce exercise tolerance and worsen breathing discomfort during outdoor activity.
Children, elderly individuals, and people with asthma, heart disease, or other respiratory conditions are usually more sensitive to these effects during severe winter pollution episodes.
How to Protect Yourself During Winter Pollution
Reducing overall exposure is one of the most effective ways to lower winter pollution risk.
Avoid prolonged outdoor exercise during severe AQI conditions, especially in the early morning when pollutants are often trapped closer to the surface.
Use a well-fitted N95 or FFP2 mask during high pollution episodes.
During severe AQI periods, indoor air may also become polluted, so using a HEPA air purifier can help improve indoor air quality.
Check local AQI regularly before outdoor travel, exercise, or long commutes.
Frequently Asked Questions
Why is winter air usually worse in the morning?
Winter pollution is usually worse during early morning hours because colder temperatures and stagnant air trap pollutants closer to the ground. Conditions may improve slightly later in the afternoon as the atmosphere becomes more active.
Can I use a cloth mask during severe AQI conditions?
Cloth masks do not filter PM2.5 particles effectively. During severe pollution episodes, a well-fitted N95 or FFP2 mask provides better protection.
Does an air purifier help during winter pollution?
Yes. During severe AQI conditions, indoor air can also become polluted over time. A HEPA air purifier can help reduce indoor PM2.5 exposure.
Why is winter pollution often worse in North India?
North India frequently experiences weak winds, stagnant weather, and poor atmospheric ventilation during winter. These conditions allow pollutants to remain trapped near the surface for longer periods.
Conclusion
Winter air pollution in India becomes worse because weather conditions trap pollutants closer to the ground and reduce atmospheric dispersion. Weak winds, temperature inversion, and stagnant air can quickly increase AQI levels during colder months.
Understanding how winter weather affects pollution can help people reduce exposure and make safer outdoor decisions during severe AQI periods.
Cities like Delhi, Ghaziabad, Noida, Kanpur, and Patna frequently record some of the highest AQI and PM2.5 levels in India, especially during winter. However, pollution rankings are not permanent because weather conditions, seasonal changes, and regional pollution transport can rapidly change air quality.
This guide explains why some Indian cities experience severe pollution, how AQI levels are measured, and why pollution patterns change throughout the year.
Quick Answer: Delhi, Ghaziabad, Noida, Kanpur, and Patna are among the most polluted cities in India, especially during winter when PM2.5 levels and AQI can rise sharply. These cities experience severe pollution not only because of traffic and industry, but also due to weather conditions such as low wind speed and winter temperature inversion that trap pollutants near the ground.
Most Polluted Cities in India
Cities in the Indo-Gangetic Plain—such as Delhi, Ghaziabad, Noida, Kanpur, and Patna—frequently record the highest PM2.5 and AQI levels in India. These cities experience severe pollution because high population density, traffic congestion, industrial activity, construction dust, and winter weather conditions combine to trap pollutants close to the ground.
Northern Indian cities often report worse winter pollution than many coastal cities because calm winds and temperature inversion reduce the natural dispersion of polluted air.
Air quality monitoring station used to measure pollutants like PM2.5 and PM10 in Indian cities.
Air pollution in Indian cities is measured using monitoring stations that track pollutants such as PM2.5, PM10, NO₂, SO₂, ozone, and carbon monoxide. Among these pollutants, PM2.5 is considered one of the most important because these tiny particles can enter deep into the lungs and affect human health over time.
Pollutant concentrations are converted into an Air Quality Index (AQI) so people can quickly understand whether air quality is safe, poor, or severe. Monitoring is mainly carried out through CPCB and State Pollution Control Board stations located across different cities.
However, AQI values can vary within the same city. A monitoring station near heavy traffic or industrial areas may record much higher pollution levels than one located in residential or green zones.
Air Pollution Across Major Indian Cities
Air pollution patterns vary significantly across Indian cities because emission sources, geography, and weather conditions are different in each region. Cities such as Delhi and Noida are strongly affected by traffic congestion, road dust, and winter inversion, while industrial areas like Ghaziabad and Kanpur experience additional emissions from factories and manufacturing activity.
Patna and several eastern Indo-Gangetic Plain cities also experience high PM2.5 levels during winter due to biomass burning, stagnant weather, and regional pollution transport. In contrast, many coastal cities in southern India often maintain comparatively lower AQI levels because stronger winds and sea-breeze circulation help disperse pollutants more effectively.
Severe winter smog in Delhi, one of the most polluted cities in India.
Commonly Reported Highly Polluted Cities
City
Key Sources
Dominant Pollutant
Seasonal Peak
Delhi
Traffic, construction
PM2.5
Winter
Ghaziabad
Industry
PM2.5
Winter
Noida
Dust, traffic
PM10/PM2.5
Winter
Kanpur
Industry
Mixed
Winter
Patna
Biomass burning
PM2.5
Winter
Regional Pollution Patterns in India
Several North Indian cities continue to record very high PM2.5 levels, especially during winter months when calm winds and temperature inversion trap pollutants near the ground. Delhi frequently reaches “Very Poor” to “Severe” AQI levels during this period, while nearby cities such as Ghaziabad, Noida, Kanpur, and Patna also experience major pollution spikes.
In contrast, many coastal cities in southern India often maintain comparatively lower AQI levels because stronger winds, sea-breeze circulation, and better atmospheric ventilation help disperse pollutants more effectively.
Pollution patterns in India are strongly seasonal. Winter usually records the highest AQI levels, while monsoon rainfall often improves air quality by washing pollutants out of the atmosphere.
Why Some Indian Cities Experience Severe Pollution
Air pollution in Indian cities is caused by a combination of emissions, weather conditions, geography, and urban growth. Cities located in the Indo-Gangetic Plain often experience the worst pollution because calm winter winds and temperature inversion prevent pollutants from dispersing normally.
Vehicle emissions, construction dust, industrial activity, and biomass burning continuously release particulate matter into the atmosphere. During winter, these pollutants remain trapped close to the ground for longer periods, causing PM2.5 and AQI levels to rise rapidly.
Regional pollution transport also affects air quality. Smoke and pollutants from nearby industrial zones or agricultural residue burning can travel across states and worsen pollution in large urban areas such as Delhi and surrounding NCR cities.
Rapid urbanization further increases pollution pressure through traffic congestion, construction activity, and higher energy demand across expanding cities.
Why Pollution Levels Change Throughout the Year
Air pollution levels in Indian cities change significantly across different seasons because weather conditions directly affect how pollutants move and disperse in the atmosphere.
Winter usually records the highest pollution levels, especially in northern India. During this period, temperature inversion, low wind speed, and stagnant air trap pollutants close to the ground, causing PM2.5 and AQI levels to rise rapidly. Additional emissions from biomass burning and heating activities can further worsen air quality.
During summer, stronger sunlight and faster air movement help disperse pollutants more effectively, although pollution levels may still remain above safe limits in densely populated cities.
Monsoon season often brings the cleanest air because rainfall helps remove dust and particulate matter from the atmosphere. This is why many cities experience noticeable AQI improvement during rainy months.
Temperature inversion during winter traps pollutants near the ground, increasing air pollution levels in cities.
Are These Cities Always the Most Polluted?
No city remains permanently at the top of India’s pollution rankings. AQI and PM2.5 levels change throughout the year depending on weather conditions, seasonal emissions, rainfall, and wind patterns.
Northern cities often experience the worst pollution during winter because stagnant air and temperature inversion trap pollutants near the ground. However, air quality may improve significantly during monsoon months when rainfall helps clear particulate matter from the atmosphere.
Pollution rankings can also vary depending on monitoring coverage and pollutant type. A city with higher PM2.5 levels may not always record the highest overall AQI on a particular day.
Residents using masks to protect themselves from high air pollution exposure in urban areas.
Managing Exposure to PM2.5 Pollution
PM2.5 particles are extremely small and can enter deep into the lungs during breathing. Long-term exposure to high PM2.5 levels is associated with respiratory and cardiovascular health risks, especially in densely populated urban areas.
During severe pollution episodes, outdoor air quality may remain “Very Poor” or “Severe” for several days. In such conditions, reducing outdoor exposure, avoiding heavy exercise near traffic, and using properly fitted N95 masks can help reduce health risks.
Indoor air quality can also be affected during high pollution periods because outdoor pollutants often enter homes, schools, and workplaces through ventilation and open windows.
How to Use AQI Data for Your Health
AQI is most useful as a short-term air quality indicator that helps people understand when pollution levels may affect outdoor activities and breathing comfort. Even within the same city, AQI can change quickly depending on traffic, weather, and local emissions.
AQI Level
Health Impact
Immediate Action Required
0–100
Good to Moderate
Safe for all outdoor activities.
101–200
Poor
Sensitive groups should limit outdoor exertion.
201–300
Very Poor
Avoid morning/evening outdoor exercise.
301+
Severe
Stay indoors; use N95 masks if you must go out.
AQI should be used as a general environmental guide rather than an exact personal exposure measurement. Sensitive groups such as children, older adults, and people with respiratory conditions are usually more affected during “Very Poor” and “Severe” pollution episodes.
When City Rankings Can Be Misleading
Pollution rankings are useful for understanding long-term air quality patterns, but they are not always reliable for daily decisions. A city with moderate annual pollution may still experience dangerous AQI spikes during winter, traffic congestion, or stagnant weather conditions.
For short-term health decisions, real-time AQI data is usually more useful than overall city rankings.
Conclusion
Air pollution in India is shaped by a combination of emissions, geography, weather conditions, and seasonal changes. Cities in the Indo-Gangetic Plain often experience the most severe winter pollution because pollutants remain trapped near the ground for longer periods.
Understanding seasonal AQI trends and PM2.5 exposure helps explain why air quality changes so dramatically across Indian cities.
Frequently Asked Questions (FAQs)
Which Indian cities usually record the highest AQI levels?
Delhi, Ghaziabad, Noida, Kanpur, and Patna frequently report high PM2.5 and AQI levels, especially during winter months.
Why does pollution become severe during winter?
Cold stagnant air, low wind speed, and temperature inversion trap pollutants close to the ground, causing AQI levels to rise rapidly.
Why do coastal cities often have better air quality?
Sea-breeze circulation, stronger winds, and better atmospheric ventilation help disperse pollutants more effectively in many coastal regions.
Is AQI the same throughout an entire city?
No. AQI can vary depending on traffic density, industrial activity, weather conditions, and monitoring station location.
Is PM2.5 more dangerous than visible dust?
PM2.5 particles are much smaller than visible dust and can enter deep into the lungs during breathing, making them a major health concern in urban pollution.
In many Indian cities, AQI levels can rise sharply within just a few hours—even under similar traffic and industrial conditions. This happens because air pollution depends not only on emissions, but also on weather conditions such as wind, temperature, humidity, and atmospheric mixing.
A windy afternoon may temporarily improve air quality, while a calm winter night can trap pollutants near the ground and rapidly increase pollution levels. Understanding how these atmospheric conditions affect AQI helps explain why air pollution changes so frequently from day to day.
As atmospheric conditions change throughout the day, AQI levels may improve temporarily or worsen rapidly within just a few hours.
Real Example: How AQI Changes Overnight in Delhi
In cities like Delhi, AQI can change dramatically within a single day despite comparable pollution sources across the city. During winter, afternoon AQI levels may stay around the “Moderate” category before rising to “Very Poor” or “Severe” conditions by the next morning.
This shift often happens because atmospheric conditions change rapidly after sunset. As temperatures drop, vertical air mixing weakens and wind speeds become lower, allowing pollutants to remain trapped close to the ground.
As a result, pollution gradually accumulates overnight, especially during calm winter conditions in North India. Similar overnight AQI spikes are commonly observed across Delhi NCR during severe winter pollution episodes.
How Pollution Builds Up or Clears
Air pollution is not fixed. It changes continuously depending on how emissions interact with weather and atmospheric conditions.
As a result two days with nearly identical urban activity can still have very different AQI levels. On some days, pollutants disperse quickly and air quality improves. On others, pollutants remain trapped near the ground and gradually accumulate.
In many cases, the difference is not simply how much pollution is produced, but how effectively the atmosphere can disperse it after release.
Weather conditions such as wind speed, temperature, humidity, and vertical air movement constantly affect how pollutants behave in the atmosphere. Even small changes in these conditions can significantly alter pollution levels within a short period.
A useful way to understand this is to imagine smoke inside a closed room. Without proper airflow, the smoke gradually accumulates instead of clearing away. Air pollution behaves in a similar way when atmospheric dispersion becomes weak.
Air pollution in cities behaves in a similar way. Severe pollution episodes are often caused not only by emissions, but also by atmospheric conditions that prevent pollutants from dispersing efficiently.
How weather conditions determine whether pollution disperses or accumulates, causing daily AQI changes.
Why This Matters for Daily AQI Changes
Air pollution is not controlled by emissions alone. In the short term, weather and atmospheric conditions often have a stronger influence on how polluted the air becomes.
As a result AQI may improve quickly on windy days but worsen rapidly during calm or cold conditions. Even without major changes in emissions, weak atmospheric dispersion can allow pollutants to accumulate near the ground and sharply increase pollution levels.
Many severe pollution episodes are caused not only by emissions, but also by the atmosphere failing to disperse pollutants efficiently.
Why AQI Changes Daily: Main Factors
Several atmospheric conditions influence how pollution behaves throughout the day. These factors determine whether pollutants disperse into the atmosphere or remain concentrated near the ground.
Strong winds usually improve air quality by dispersing pollutants over a wider area, while calm conditions allow pollution to accumulate near the surface. Wind direction can also transport pollution from nearby regions.
Temperature and vertical air movement also affect AQI levels. Warm daytime conditions improve atmospheric mixing and help pollutants disperse upward. During cold mornings and winter nights, weaker air movement allows pollution to remain trapped near breathing level.
Humidity affects fine particles such as PM2.5 by making haze and smog more visible. At the same time, the boundary layer — the lower part of the atmosphere where pollutants mix — can become shallow during winter, compressing pollutants into a smaller volume of air and rapidly increasing AQI levels.
In simple terms, pollution becomes more concentrated when the atmosphere has less space available for dispersion.
Human Activity Patterns
Daily human activities also influence short-term pollution levels.
Morning traffic increases emissions during a time when atmospheric mixing is still weak, allowing pollutants to accumulate near the ground more easily. Evening traffic often coincides with cooler and more stable atmospheric conditions, which can further increase AQI levels.
Certain seasonal or temporary events can also cause rapid pollution spikes. For example, firecracker emissions during festivals such as Diwali or local biomass burning can sharply increase PM2.5 concentrations within a short period.
Industrial operations, power generation, and construction activity also contribute to daily AQI fluctuations, especially in densely populated urban regions.
Seasonal Influences (India Context)
Seasonal conditions strongly affect how pollution behaves across India.
During winter, weaker winds, colder temperatures, and temperature inversions trap pollutants near the ground, causing AQI levels to rise sharply in many North Indian cities. In summer, stronger sunlight and better air circulation usually improve dispersion, although dust storms can still increase PM10 pollution.
Seasonal activities such as crop residue burning after the monsoon also contribute to severe pollution episodes, especially across Delhi NCR and nearby regions.
Why Pollution Is Worse in Winter (India Example)
Winter is the most polluted season in many Indian cities, especially across North India. During colder months, atmospheric conditions become less favorable for pollution dispersion, allowing pollutants to remain concentrated near the ground for longer periods.
One major reason is temperature inversion, where a layer of warm air traps cooler polluted air near the surface. Weak winds and a shallow mixing layer further reduce dispersion, causing AQI levels to rise rapidly even during periods of stable urban emissions.
Higher humidity and fog also worsen winter pollution by increasing haze and smog formation. Seasonal activities such as crop residue burning and biomass fuel use can intensify these conditions further, especially across Delhi NCR and nearby regions.
Why AQI Can Change Within Hours
AQI levels can rise or fall significantly within just a few hours due to changes in sunlight, temperature, traffic activity, and atmospheric mixing.
During mornings and late evenings, cooler and more stable atmospheric conditions allow pollutants to remain concentrated near the ground. Morning traffic can further increase pollution levels during this period.
By afternoon, stronger sunlight heats the surface and improves vertical air mixing, helping pollutants disperse more effectively. As a result, AQI levels often improve temporarily before rising again later in the evening.
In many North Indian cities, especially during winter, overnight AQI increases of 100–250+ points are commonly observed under stagnant atmospheric conditions.
Typical daily AQI pattern in Indian cities influenced by sunlight, temperature, and human activity.
How to Predict Daily AQI Changes (Simple Guide)
Daily AQI changes often follow visible weather patterns. Cold mornings, weak wind, fog, and calm evenings usually allow pollution to build up more quickly, especially during winter.
In contrast, sunny afternoons and stronger winds often improve air quality by increasing atmospheric mixing and pollutant dispersion.
In many Indian cities, observing basic weather conditions can provide a simple idea of whether AQI levels are likely to improve or worsen during the day.
The Three-Part Formula
Air pollution at any moment can be understood as:
Air Pollution = Emissions + Weather + Atmospheric Behavior
Emissions determine how much pollution is released from vehicles, industries, dust, and burning sources.
Weather affects how air moves through wind, temperature, and humidity.
Atmospheric behavior determines whether pollutants disperse or remain trapped near the ground.
This explains why cities with similar pollution sources can still experience very different AQI levels under changing atmospheric conditions.
Practical Note
During severe AQI conditions, reducing outdoor exposure, avoiding intense physical activity near traffic-heavy areas, and checking real-time AQI updates can help reduce short-term pollution exposure.
In India, AQI levels can change quickly depending on weather and atmospheric conditions, especially during winter and stagnant air conditions.
Conclusion
Air pollution changes daily because the atmosphere is constantly changing. Weather conditions such as wind, temperature, humidity, and atmospheric mixing determine whether pollutants disperse or remain concentrated near the ground.
As a result, pollution often becomes much worse during winter, calm weather, and low-dispersion conditions across many Indian cities.
Frequently Asked Questions (FAQs)
Why does AQI change every day?
AQI changes daily because weather conditions such as wind, temperature, humidity, and atmospheric mixing affect how pollutants disperse or accumulate near the ground.
Why is pollution worse in winter in India?
Winter conditions often include weak winds, temperature inversion, fog, and shallow atmospheric mixing, which trap pollutants close to the surface and increase AQI levels.
Can AQI change within a few hours?
Yes. Changes in sunlight, traffic activity, wind speed, and atmospheric stability can cause AQI levels to rise or fall significantly within a short period.
Does weather affect pollution more than emissions?
In the short term, weather conditions can strongly influence pollution levels by controlling how pollutants disperse. However, long-term air quality still depends heavily on reducing emissions.
Does rain reduce air pollution?
Rain can temporarily reduce pollution by removing particles from the air, although the effect often depends on rainfall intensity and duration.