

Introduction
Air pollution levels in India are commonly reported through PM2.5 measurements, AQI categories, and pollution monitoring dashboards. During severe pollution episodes in cities such as Delhi, PM2.5 levels can rise far above recommended limits, especially during winter months.
These pollution values are usually interpreted using two major reference systems:
- India’s National Ambient Air Quality Standards (NAAQS) developed by the Central Pollution Control Board (CPCB)
- Global Air Quality Guidelines (AQG) published by the World Health Organization (WHO)
Although both systems are widely used in pollution reporting, they serve different purposes. CPCB standards are used within India’s national monitoring and reporting system, while WHO guideline values function as global scientific reference levels based on international health research.
This article explains how CPCB standards and WHO guidelines differ, how they are used in air quality reporting, and why the same pollution measurement may be interpreted differently across monitoring platforms and AQI systems.
For a broader introduction, see what is air pollution in India.
What Are Pollution Standards in India? (Quick Answer)
Pollution standards in India define the maximum concentration limits for pollutants such as PM2.5, PM10, nitrogen dioxide (NO₂), and sulphur dioxide (SO₂) in outdoor air.
These standards are part of India’s National Ambient Air Quality Standards (NAAQS) system managed by the Central Pollution Control Board (CPCB).
For example:
- PM2.5 annual limit: 40 µg/m³
- PM10 annual limit: 60 µg/m³
These values are used in air quality monitoring systems and AQI reporting across Indian cities.
Why Indian Pollution Standards Exist

Air pollution cannot always be seen directly, so monitoring systems use standardized pollution limits to measure and compare pollutant levels across different locations.
In India, CPCB standards help monitoring stations report pollutants such as PM2.5, PM10, NO₂, and SO₂ using consistent measurement and averaging methods.
These standards also make it easier to compare pollution data between cities and across different time periods. For example, pollution readings from Delhi and Mumbai can be interpreted more consistently when the same monitoring standards are used nationwide.
WHO guideline values serve a different role by providing global scientific reference levels based on international health research.
CPCB Air Pollution Standards in India (NAAQS)
India’s air pollution standards are defined under the National Ambient Air Quality Standards (NAAQS) system managed by the Central Pollution Control Board (CPCB).
These standards are used to measure and compare major pollutants in outdoor air, including:
- PM2.5
- PM10
- Nitrogen dioxide (NO₂)
- Sulphur dioxide (SO₂)
- Ozone (O₃)
- Carbon monoxide (CO)
Monitoring stations across India use these standards to report pollution levels using common averaging periods such as annual averages and 24-hour averages.
For example, PM2.5 data collected from monitoring stations in Delhi, Mumbai, Kolkata, and other cities is interpreted using CPCB reference standards before being displayed through AQI systems and public reporting platforms.
This helps pollution data remain more consistent and comparable across different cities and monitoring networks.
For a detailed explanation of these pollutants, see PM2.5 explained in India and related pollutant guides.
National Air Quality Standards (India)
This difference does not mean the two systems are used in the same way.
| Pollutant | Annual Limit (µg/m³) | 24-Hour Limit | Used For |
|---|---|---|---|
| PM2.5 | 40 | 60 | Fine particle monitoring |
| PM10 | 60 | 100 | Dust and coarse particle monitoring |
| NO₂ | 40 | 80 | Traffic and combustion pollution monitoring |
| SO₂ | 50 | 80 | Industrial emission monitoring |
The table below compares selected annual pollutant limits from CPCB standards and WHO guideline values.
How CPCB Standards Are Used in Monitoring and Reporting

CPCB air pollution standards are applied within national monitoring systems to structure how air quality data is collected, processed, and presented. Measurements recorded at monitoring stations are aggregated using defined averaging rules before being published in datasets or summarised into commonly used reporting formats.
In public reporting contexts, raw concentration data is often converted into categories or index values. This process is shaped by CPCB reference frameworks, which provide consistency in how observed pollution conditions are described.
These systems are designed to support comparability across regions and time periods rather than to provide individual-level interpretation of exposure or risk.
CPCB standards are periodically reviewed in relation to evolving scientific assessment practices, monitoring infrastructure, and data availability. Revisions typically involve changes in reporting conventions, averaging structures, or pollutant inclusion, reflecting institutional monitoring priorities.
WHO Air Quality Guidelines (AQG)
The World Health Organization (WHO) publishes global air quality guideline values for pollutants such as PM2.5, PM10, ozone (O₃), nitrogen dioxide (NO₂), and sulphur dioxide (SO₂).
These guideline values are based on international health research and are often lower than India’s CPCB standards.
For example:
- WHO annual PM2.5 guideline: 5 µg/m³
- CPCB annual PM2.5 standard: 40 µg/m³
This difference does not mean the two systems are used in the same way.
WHO guideline values mainly serve as global scientific reference levels, while CPCB standards are used within India’s national monitoring and AQI reporting systems.
Because WHO values are much lower, pollution levels in many Indian cities may exceed WHO guideline levels even when they are being interpreted under India’s own reporting framework.
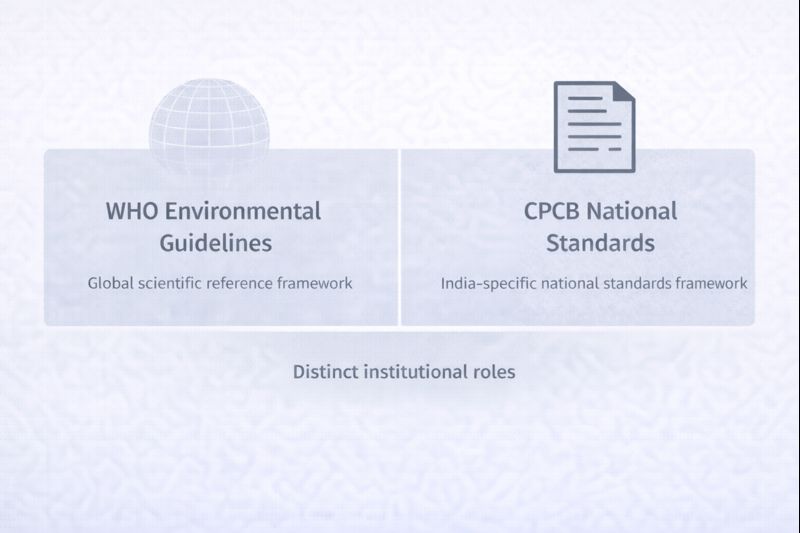
CPCB vs WHO: Understanding Differences Without Ranking
Comparisons between CPCB standards and WHO guideline values are common, but numerical differences are often interpreted without sufficient institutional context. CPCB standards and WHO guidelines are designed to serve different purposes.
CPCB standards are structured to operate within India’s domestic monitoring and reporting systems. They function as institutional reference benchmarks that support consistent description of observed pollution conditions across diverse geographic settings.
WHO guideline values, by contrast, are designed as global scientific reference points derived from international evidence synthesis. They are not embedded within national monitoring systems and do not carry institutional or legal authority within India.
Because these frameworks serve different functions, differences in numerical values do not automatically indicate that one system is more accurate, more protective, or more appropriate than the other. Differences reflect variations in institutional design, averaging conventions, monitoring context, and policy objectives.
Example: Delhi Pollution Levels vs Standards
During winter in Delhi:
- PM2.5 levels often exceed 200 µg/m³
- CPCB annual standard: 40 µg/m³
- WHO guideline: 5 µg/m³
This shows how real-world pollution levels can be significantly higher than both national standards and global guideline values.
What Do These Differences Mean in Practice?
The differences between CPCB standards and WHO guideline values become easier to understand when real pollution levels are compared with both systems.
For example, during severe winter pollution episodes in Delhi, PM2.5 levels at some monitoring stations may rise above 200–300 µg/m³.
In comparison:
- CPCB annual PM2.5 standard: 40 µg/m³
- WHO annual PM2.5 guideline: 5 µg/m³
This means pollution levels recorded during peak winter conditions can become several times higher than both India’s national standards and WHO guideline values.
Similar pollution patterns are also observed in cities such as Ghaziabad, Noida, Kanpur, and other parts of the Indo-Gangetic Plain during winter months.
These comparisons help explain why AQI values often remain in “Very Poor” or “Severe” categories during major pollution episodes in North India.ity. For instance, PM2.5 concentrations above 250 µg/m³ during severe winter pollution events can push AQI values into the “Severe” category at several monitoring stations in North India.
Comparison of CPCB NAAQS Standards and WHO Air Quality Guidelines
The conceptual differences between the two frameworks can be summarized as follows:
| Framework | Role | Scope |
|---|---|---|
| CPCB NAAQS | National regulatory standards | India monitoring systems |
| WHO AQG | Global scientific guideline values | International reference |
Why “Stricter” vs “Looser” Comparisons Can Be Misleading
WHO guideline values for pollutants such as PM2.5 are lower than India’s CPCB standards, but the two systems are designed for different purposes.
CPCB standards are used within India’s national air quality monitoring and AQI reporting system. WHO guideline values, by contrast, are global scientific reference levels based on international health research.
Because these systems serve different roles, numerical differences alone do not fully explain how pollution data is monitored or interpreted in practice.
For example, the same PM2.5 measurement may appear in AQI reporting under CPCB standards while also being compared with WHO guideline values in international pollution discussions.
This is why pollution standards should be understood within their own monitoring and reporting context rather than treated as simple “better” or “worse” systems.
How Standards Appear in AQI Reporting and Public Communication
Most people encounter pollution standards through AQI apps, CPCB dashboards, weather platforms, and news reports rather than through technical monitoring documents.
In India, pollution measurements collected from monitoring stations are converted into AQI categories such as:
- Good
- Moderate
- Poor
- Very Poor
- Severe
For example, during winter pollution episodes in Delhi, PM2.5 concentrations may rise high enough for AQI systems to classify air quality as “Very Poor” or “Severe.”
This process uses CPCB pollution standards, pollutant breakpoints, and averaging methods to convert raw monitoring data into public AQI values.
Different reporting platforms may also reference WHO guideline values for comparison. Because of this, the same pollution measurement may sometimes appear differently across AQI dashboards, reports, or international pollution trackers.
These differences usually reflect different reporting systems and averaging methods rather than contradictions in the monitoring data itself.
To understand how pollution measurements are converted into AQI categories, see AQI explained in India.

Key Takeaways for Readers
- CPCB standards are used in India’s air quality monitoring and AQI reporting systems.
- WHO guideline values are global scientific reference levels based on international health research.
- PM2.5 and PM10 pollution levels in many Indian cities often exceed both CPCB standards and WHO guideline values during severe pollution periods.
- AQI categories such as “Poor,” “Very Poor,” and “Severe” are based on pollution measurements collected from monitoring stations.
- Differences between CPCB and WHO values reflect different monitoring and reporting purposes rather than simple “better” or “worse” standards.
Understanding these standards makes it easier to interpret AQI values, pollution dashboards, and air quality reports published across India.
References
- Central Pollution Control Board (CPCB). National Ambient Air Quality Standards (NAAQS).
https://cpcb.nic.in/national-ambient-air-quality-standards/ - Ministry of Environment, Forest and Climate Change (MoEFCC).
https://moef.gov.in/ - World Health Organization (WHO). WHO Global Air Quality Guidelines (2021).
https://www.who.int/publications/i/item/9789240034228
Author Bio
Soumen Chakraborty is the founder of GreenGlobe25, an independent educational platform focused on air pollution systems and air quality research in India. His work centers on explaining pollution-related concepts, standards, and institutional frameworks using publicly available data and authoritative sources.
Content published on GreenGlobe25 is written as neutral, research-based educational explainers. It draws on materials from organizations such as the Central Pollution Control Board (CPCB), the World Health Organization (WHO), and other institutional bodies, and follows a documented fact-checking and source-attribution process. The material is descriptive in nature and does not provide professional, medical, or policy advice.
Educational Context Note: This article explains institutional and scientific frameworks for pollution measurement and reporting. It does not provide personal health, safety, or compliance advice.