

Introduction
The Air Quality Index (AQI) is a system used to convert air pollution measurements into a simple numerical scale that helps people understand current air quality conditions.
In India, AQI values are calculated using pollutants such as PM₂.₅, PM₁₀, nitrogen dioxide (NO₂), sulfur dioxide (SO₂), ozone (O₃), and carbon monoxide (CO) measured by air quality monitoring stations.
The final AQI value is determined using pollutant-specific breakpoints and sub-index calculations defined under the National Air Quality Index (NAQI) framework coordinated by the Central Pollution Control Board (CPCB).
This guide explains how AQI is calculated in India, how pollutant concentrations are converted into AQI values, and how AQI categories are used in public air quality reporting.
In simple terms, AQI is calculated by converting pollutant concentrations into pollutant-specific scores and selecting the pollutant with the highest health risk level.
What Is AQI?
AQI (Air Quality Index) is a standardized system used to represent air pollution levels using a single numerical value.
Instead of showing raw pollutant concentrations in technical units, AQI simplifies air quality data into categories such as:
- Good
- Satisfactory
- Moderate
- Poor
- Very Poor
- Severe
Higher AQI values indicate worse air quality and greater potential health risk.
AQI values are generated using pollution measurements collected from air quality monitoring stations across cities and industrial regions.
How AQI Is Calculated in India (Simple Explanation)
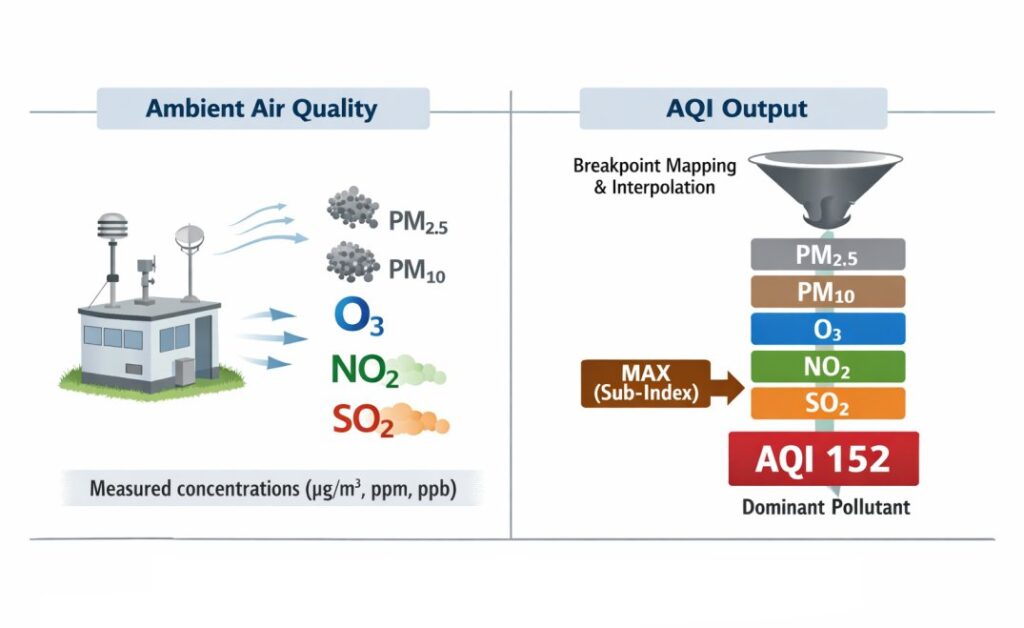
AQI is calculated by converting pollutant concentrations into AQI sub-index values using predefined breakpoint ranges.
The process works in four main steps:
- Monitoring stations measure pollutants such as PM₂.₅, PM₁₀, NO₂, SO₂, CO, and O₃
- Each pollutant concentration is converted into an AQI sub-index
- The highest pollutant sub-index is selected
- That highest value becomes the final AQI
In simple terms:
The pollutant with the worst pollution level determines the AQI category.
For example, even if most pollutants are low, a very high PM₂.₅ concentration can push the AQI into the Poor or Severe category.
Pollutants Used in AQI Calculation
India’s AQI system uses pollutants that are widely monitored in urban air quality networks.
These commonly include:
- PM₂.₅
- PM₁₀
- NO₂
- SO₂
- O₃
- CO
- NH₃
These pollutants are commonly known as criteria pollutants because they are widely used to assess air quality and pollution-related health risks.
What Is an AQI Sub-Index?
AQI is not calculated by simply adding pollutant concentrations together.
Instead, each pollutant concentration is first converted into a pollutant-specific AQI score called a sub-index.
Each pollutant receives its own sub-index value based on predefined concentration breakpoints.
For example:
- PM₂.₅ may produce a sub-index of 240
- NO₂ may produce a sub-index of 80
- O₃ may produce a sub-index of 60
In this case, PM₂.₅ becomes the dominant pollutant because it has the highest sub-index.
The final AQI would therefore be reported as 240.
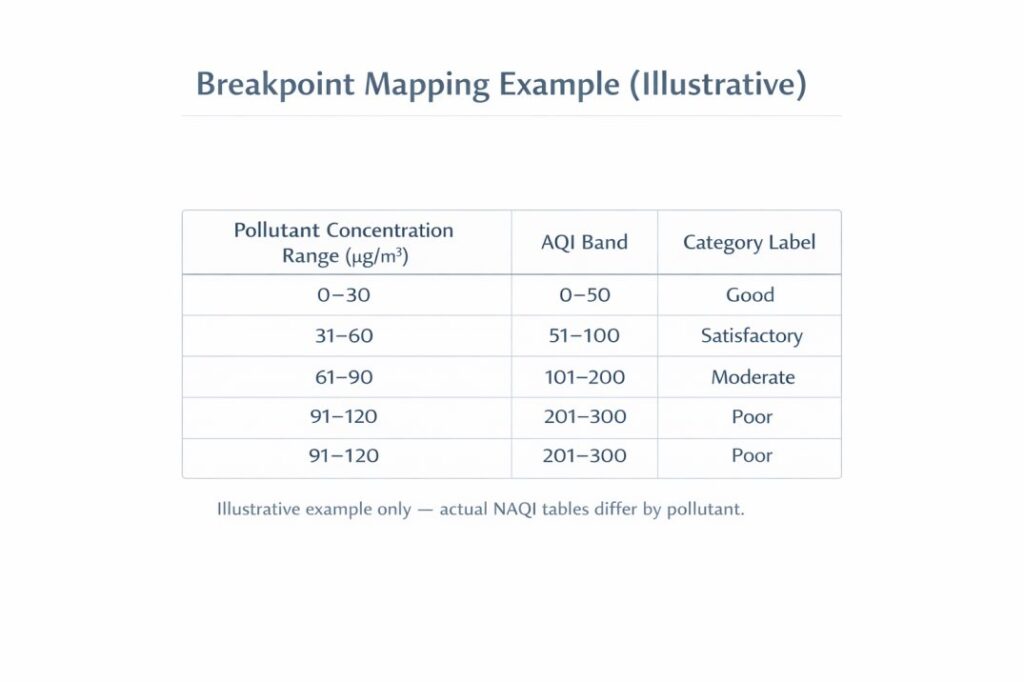
AQI Breakpoints Explained
AQI breakpoints are predefined pollutant concentration ranges used to convert pollution measurements into AQI values.
Each pollutant has its own breakpoint table.
For example:
| PM₂.₅ Concentration | AQI Category |
|---|---|
| 0–30 µg/m³ | Good |
| 31–60 µg/m³ | Satisfactory |
| 61–90 µg/m³ | Moderate |
Different pollutants use different breakpoint ranges because their health impacts and atmospheric behavior vary.
For example:
| Pollutant | Example Moderate Range |
|---|---|
| PM₂.₅ | 61–90 µg/m³ |
| PM₁₀ | 101–250 µg/m³ |
| NO₂ | 81–180 µg/m³ |
| O₃ | 101–168 µg/m³ |
Actual NAQI breakpoint ranges differ by pollutant and averaging period.
When pollutant concentrations increase, the corresponding AQI value also increases.
These breakpoint systems help standardize AQI reporting across monitoring stations and cities.
AQI Calculation Formula
AQI sub-index values are calculated using a standard interpolation formula.
[
I = \left( \frac{I_{HI} – I_{LO}}{C_{HI} – C_{LO}} \right)(C – C_{LO}) + I_{LO}
]
Where:
- I = AQI sub-index
- C = pollutant concentration
- Cₕᵢ and Cₗₒ = concentration breakpoint values
- Iₕᵢ and Iₗₒ = AQI breakpoint values
This formula converts pollutant concentrations into standardized AQI scores.
How the Final AQI Value Is Determined
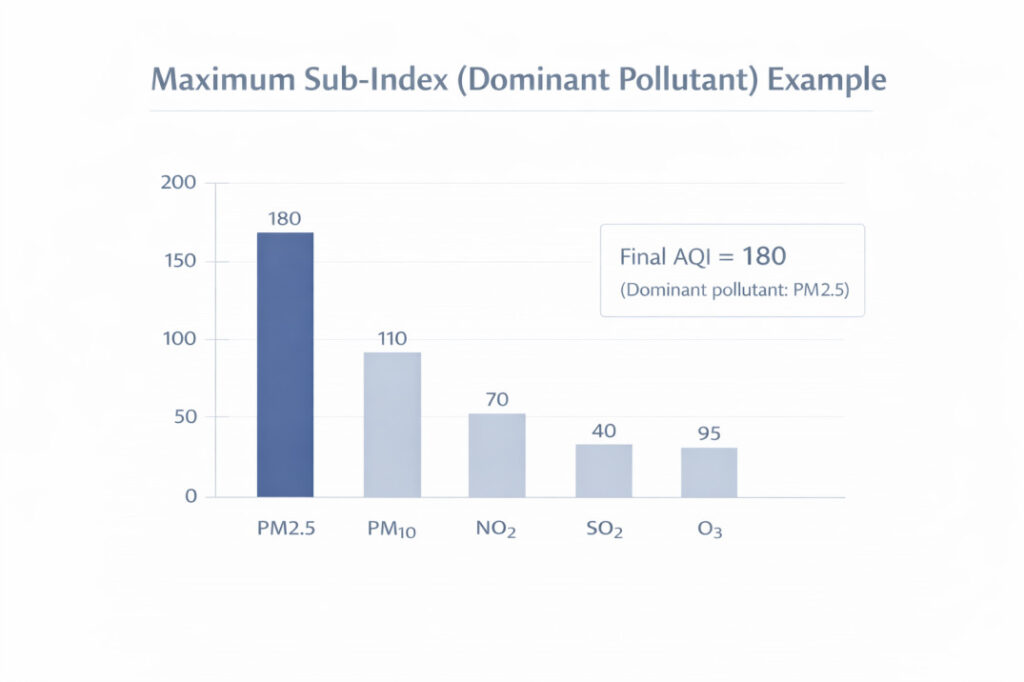
India’s AQI system uses the maximum sub-index method.
This means:
The pollutant with the highest sub-index determines the final AQI value.
For example:
| Pollutant | Sub-Index |
|---|---|
| PM₂.₅ | 280 |
| NO₂ | 110 |
| SO₂ | 45 |
| O₃ | 72 |
The final AQI would be:
AQI = 280 (Poor)
because PM₂.₅ has the highest sub-index.
This pollutant is called the dominant pollutant.
For example, winter PM₂.₅ spikes in Delhi can rapidly increase AQI values even when other pollutants remain comparatively lower.
AQI Categories in India
India’s National Air Quality Index (NAQI) uses six standard AQI categories.
| AQI Range | Category | Color |
|---|---|---|
| 0–50 | Good | Green |
| 51–100 | Satisfactory | Light Green |
| 101–200 | Moderate | Yellow |
| 201–300 | Poor | Orange |
| 301–400 | Very Poor | Red |
| 401–500 | Severe | Dark Red |
Higher AQI categories indicate increasing pollution levels and greater health risk.
For example, Delhi and several North Indian cities often reach the “Very Poor” or “Severe” AQI category during winter because stagnant atmospheric conditions trap pollutants near the ground.
Quick AQI Interpretation
- AQI below 100 generally indicates relatively lower pollution exposure.
- AQI above 200 indicates unhealthy air quality for many people.
- AQI above 300 may create serious health risks, especially for children, elderly individuals, and people with respiratory conditions.
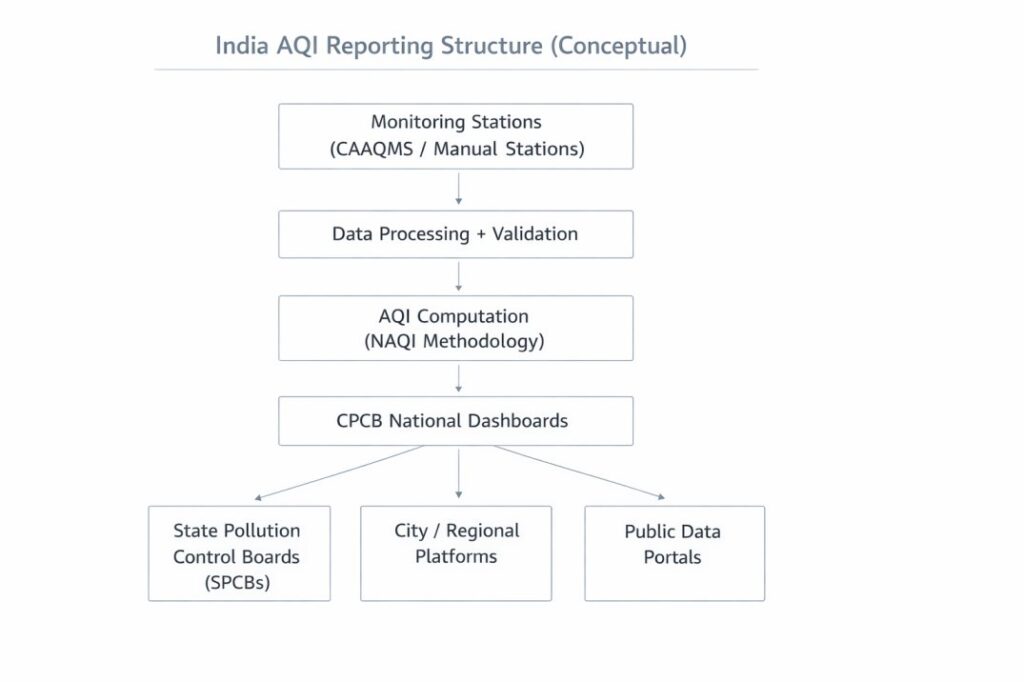
Role of Monitoring Stations in AQI Reporting
AQI values are generated using pollutant data collected from air quality monitoring stations.
Most real-time AQI reporting in India depends on Continuous Ambient Air Quality Monitoring Stations (CAAQMS), which continuously measure pollutant concentrations and transmit data to central reporting platforms.
Why AQI Values Vary Between Cities
AQI values can differ significantly between cities because pollution levels depend on:
- traffic emissions
- industrial activity
- weather conditions
- seasonal pollution
- monitoring station location
North Indian cities often experience severe winter AQI because temperature inversions trap pollutants near the ground and reduce atmospheric dispersion.
Limitations of AQI
Although AQI simplifies air pollution reporting, it also has limitations.
AQI Does Not Show Full Pollution Complexity
AQI summarizes multiple pollutants into a single number, which means some detailed pollution information may be lost.
AQI Depends on Monitoring Availability
AQI can only be calculated for pollutants measured by monitoring stations.
Areas with fewer monitoring stations may have limited AQI coverage.
AQI Values Can Change Rapidly
Air pollution levels can change within hours due to traffic, weather, and industrial activity.
This is why AQI values often fluctuate throughout the day.
Conclusion
AQI is calculated by converting pollutant concentrations into pollutant-specific sub-indices using predefined breakpoint ranges. The pollutant with the highest sub-index determines the final AQI value reported for a location.
In India, AQI reporting is coordinated through CPCB’s National Air Quality Index (NAQI) framework and supported by monitoring networks such as CAAQMS.
Understanding how AQI is calculated helps people interpret air quality reports more accurately and identify which pollutants are contributing most to urban air pollution.
Frequently Asked Questions
What pollutants are used in AQI calculation in India?
India’s AQI system commonly uses PM₂.₅, PM₁₀, NO₂, SO₂, ozone, carbon monoxide, and ammonia.
What is an AQI sub-index?
A sub-index is the AQI score calculated separately for each pollutant using pollutant concentration breakpoints.
Which pollutant determines the final AQI?
The pollutant with the highest sub-index determines the final AQI value. This pollutant is called the dominant pollutant.
What does a Severe AQI mean?
A Severe AQI (401–500) indicates extremely poor air quality and a high level of health risk.
Why does AQI change throughout the day?
AQI changes because pollution levels vary due to traffic emissions, weather conditions, industrial activity, and atmospheric changes.
Why is PM₂.₅ often the dominant pollutant in AQI?
PM₂.₅ frequently becomes the dominant pollutant because fine particles remain suspended in the atmosphere for long periods and are strongly affected by traffic emissions, combustion sources, and winter atmospheric conditions.