
Introduction
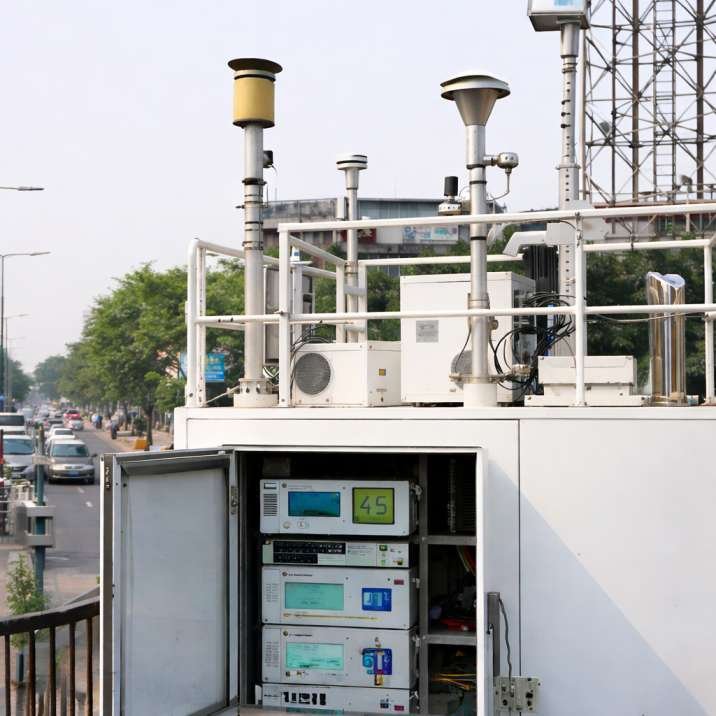
Air pollution monitoring stations are facilities equipped with scientific instruments that measure pollutants present in ambient air. These stations help environmental agencies track pollution levels, calculate the Air Quality Index (AQI), identify pollution hotspots, and evaluate air quality trends across cities.
Modern monitoring stations measure pollutants such as PM₂.₅, PM₁₀, nitrogen dioxide (NO₂), sulfur dioxide (SO₂), ozone (O₃), and carbon monoxide (CO). In India, monitoring networks are operated by the Central Pollution Control Board (CPCB) and State Pollution Control Boards (SPCBs).
Monitoring stations are an essential part of India’s air quality management system because they provide the real-time and long-term pollution data used for AQI reporting, pollution research, and environmental policy decisions. Without reliable monitoring data, governments cannot accurately identify pollution hotspots, evaluate emission-control policies, or issue timely public health advisories.
In this guide, you’ll learn how air pollution monitoring stations measure pollutants such as PM₂.₅, NO₂, ozone, and carbon monoxide, how AQI data is generated, and how India’s monitoring network tracks urban air pollution.
India operates hundreds of continuous and manual monitoring stations through CPCB and State Pollution Control Boards to monitor urban and industrial air quality.
What Is an Air Pollution Monitoring Station?
An air pollution monitoring station is a scientific monitoring facility that continuously or periodically measures pollutant concentrations in the atmosphere.
These stations collect environmental data that helps scientists and environmental agencies understand:
- current air quality conditions
- pollution trends over time
- pollution hotspots within cities
- the effectiveness of pollution control policies
The collected data is also used to calculate the Air Quality Index (AQI), which converts pollution measurements into categories such as Good, Moderate, Poor, and Severe.
Main Components of an Air Pollution Monitoring Station
Air pollution monitoring stations contain several instruments that work together to measure pollutants accurately.
Air Sampling Inlet
The sampling inlet draws ambient air into the monitoring instruments. It is positioned carefully so the measurements represent surrounding atmospheric conditions.
Pollutant Analyzers
Specialized analyzers measure pollutants such as:
- PM₂.₅
- PM₁₀
- NO₂
- SO₂
- O₃
- CO
Each pollutant requires a different measurement method.
Pumps and Flow Control Systems
Pumps move air through the monitoring instruments at controlled flow rates to ensure accurate sampling.
Meteorological Sensors
Most stations also measure:
- wind speed
- wind direction
- temperature
- humidity
Weather conditions strongly influence how pollutants disperse and accumulate.
Data Acquisition System (DAS)
The DAS records monitoring data and transmits it to centralized monitoring databases used for AQI reporting and environmental analysis.
Common Sensors and Analyzers Used in Air Pollution Monitoring Stations
Different pollutants require different measurement technologies. No single sensor can accurately measure every pollutant, so air pollution monitoring stations combine several specialized analyzers.
| Sensor / Analyzer | Measures | Typical Use |
|---|---|---|
| Optical Particle Sensor | PM₂.₅, PM₁₀ | Real-time particle monitoring |
| Beta Attenuation Monitor (BAM) | PM₂.₅, PM₁₀ | Regulatory-grade continuous monitoring |
| Chemiluminescence Analyzer | NO₂ | Nitrogen dioxide measurement |
| UV Fluorescence Analyzer | SO₂ | Sulfur dioxide monitoring |
| Non-Dispersive Infrared (NDIR) Analyzer | CO | Carbon monoxide monitoring |
| UV Photometric Analyzer | O₃ | Ground-level ozone measurement |
Modern CAAQMS stations combine several of these analyzers to monitor multiple pollutants simultaneously and generate reliable air quality data for AQI calculation.
Why Air Pollution Monitoring Stations Are Important
Reliable monitoring data is the foundation of air quality management because it enables pollution assessment, AQI reporting, trend analysis, and policy evaluation.
Monitoring stations help environmental agencies:
- detect pollution hotspots
- identify pollution trends
- issue AQI alerts
- evaluate environmental regulations
- monitor severe pollution episodes
The data collected from these stations forms the foundation of air quality management systems in India.
Monitoring stations are strategically installed in traffic corridors, residential neighborhoods, industrial areas, and urban background locations to capture representative pollution patterns across a city.
This helps monitoring networks capture pollution variation across different parts of a city.
Types of Air Pollution Monitoring Stations
Air quality monitoring networks mainly use two types of monitoring systems.
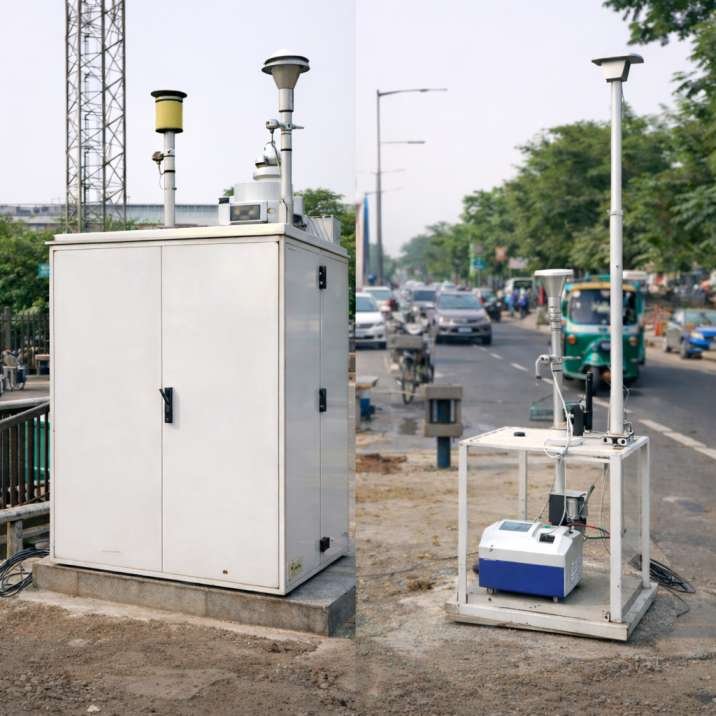
Continuous Ambient Air Quality Monitoring Stations (CAAQMS)
CAAQMS stations are automated systems that measure pollutants continuously throughout the day.
These stations provide:
- real-time pollution data
- hourly AQI updates
- pollution alerts
- continuous environmental monitoring
Many major Indian cities such as Delhi, Mumbai, Bengaluru, and Kolkata operate CAAQMS networks.
Manual Monitoring Stations
Manual monitoring stations collect air samples periodically rather than continuously.
The samples are analyzed in laboratories to determine pollutant concentrations.
Although manual stations do not provide real-time data, they are still important for:
- long-term pollution assessment
- research studies
- validation of automated monitoring systems
India uses both manual and continuous monitoring systems as part of its national monitoring framework.
Air Pollution Monitoring Station vs Air Quality Sensor
Although these terms are often used interchangeably, they are not the same.
An air quality sensor is a single device designed to measure one or more pollutants, such as PM₂.₅ or carbon monoxide.
An air pollution monitoring station is a complete monitoring facility that combines multiple sensors, pollutant analyzers, meteorological instruments, and a data acquisition system. The collected data is processed to calculate the Air Quality Index (AQI) and monitor pollution trends.
| Air Quality Sensor | Monitoring Station |
|---|---|
| Individual measuring device | Complete monitoring facility |
| Measures one or a few pollutants | Measures multiple pollutants simultaneously |
| Portable or fixed | Permanently installed |
| Used in homes, schools, or research | Used by CPCB and SPCBs for official monitoring |
| Does not calculate AQI independently | Provides data used for AQI calculation |
Understanding this difference helps explain why official AQI values are based on data from certified monitoring stations rather than a single low-cost air quality sensor.
Both continuous and manual air pollution monitoring stations are designed to measure pollutant concentrations accurately. The main difference lies in how frequently they collect and report data. Continuous stations provide near real-time measurements throughout the day, while manual stations collect samples at scheduled intervals for laboratory analysis. Understanding this monitoring workflow helps explain how pollutant measurements are transformed into reliable air quality information and Air Quality Index (AQI) reports.
Key Takeaway: A sensor measures pollutants, while a monitoring station combines multiple sensors, meteorological instruments, and data systems to generate official AQI information.
How Air Pollution Monitoring Stations Work
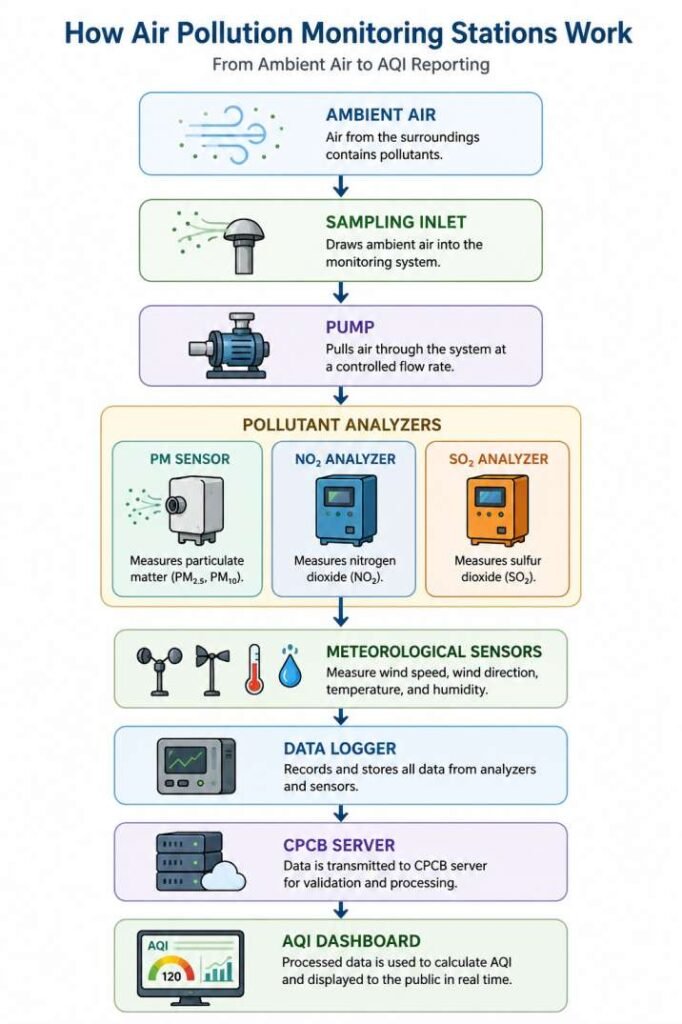
The following sections explain each stage of the monitoring process in more detail, from ambient air sampling to AQI reporting.
Air enters the monitoring system through a sampling inlet and passes through specialized analyzers that detect pollutants using optical, chemical, or infrared methods.
The collected data is then processed and transmitted to environmental monitoring networks for AQI reporting and pollution analysis.
How PM₂.₅ and PM₁₀ Are Measured
Particulate matter is one of the most important pollutants monitored in air quality systems because it is strongly associated with respiratory and cardiovascular health risks.
Monitoring stations commonly measure:
- PM₂.₅ — particles smaller than 2.5 micrometers
- PM₁₀ — particles smaller than 10 micrometers
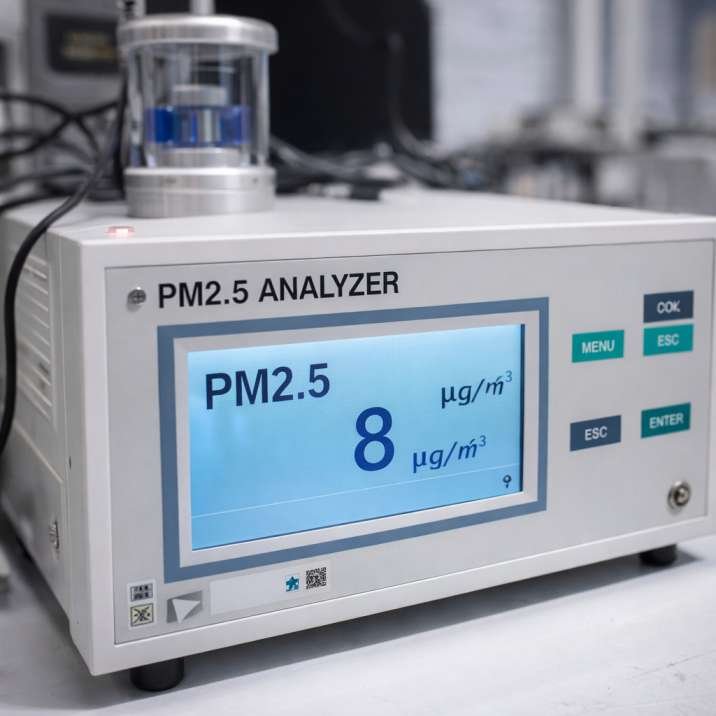
Common PM Measurement Methods
Optical Sensors
Optical sensors estimate particle concentrations using light scattering techniques.
As particles pass through a laser beam inside the instrument, they scatter light. The sensor analyzes this scattering pattern to estimate particulate matter concentrations.
These sensors are widely used because they provide continuous real-time measurements.
Beta Attenuation Monitors (BAM)
BAM instruments collect particles on a filter tape and measure how much beta radiation is absorbed by the collected particles.
The amount of absorbed radiation is used to calculate particulate matter concentration.
Many regulatory monitoring stations in India use BAM technology because it provides reliable long-term measurements.
How Gas Pollutants Are Measured
Monitoring stations also measure gaseous pollutants such as NO₂, SO₂, O₃, and CO using specialized analyzers.
Nitrogen Dioxide (NO₂)
NO₂ is commonly measured using chemiluminescence analyzers.
The instrument detects light produced during chemical reactions involving nitrogen oxides.
Sulfur Dioxide (SO₂)
SO₂ is typically measured using ultraviolet fluorescence analyzers.
The analyzer measures fluorescent light emitted by sulfur dioxide molecules exposed to ultraviolet radiation.
Carbon Monoxide (CO)
CO is measured using non-dispersive infrared (NDIR) analyzers.
These instruments detect how carbon monoxide absorbs infrared radiation.
Meteorological Measurements in Monitoring Stations
Weather conditions strongly affect how pollutants move through the atmosphere.
Most monitoring stations therefore also measure:
- wind speed
- wind direction
- temperature
- humidity
These measurements help scientists understand pollution dispersion, atmospheric stability, and pollution transport patterns.
Temperature inversions, for example, can trap pollutants near the ground and worsen winter smog conditions.
Temperature inversions can trap pollutants near the ground and worsen winter smog conditions in North Indian cities.
Air Pollution Monitoring Network in India
India operates a large national air quality monitoring network coordinated by the Central Pollution Control Board (CPCB).
Monitoring stations are operated by:
- CPCB
- State Pollution Control Boards (SPCBs)
- Pollution Control Committees
- research institutions
Monitoring networks are distributed across:
- metropolitan cities
- industrial regions
- residential areas
- traffic corridors
This helps environmental agencies track pollution variation across different urban environments.
For example, Delhi operates multiple monitoring stations across traffic corridors, residential areas, and industrial zones to track pollution variation during severe winter smog episodes.
How Monitoring Data Is Used for AQI Calculation
Monitoring stations continuously measure pollutant concentrations and transmit the collected data to centralized monitoring databases used for AQI reporting and environmental analysis.
The Air Quality Index (AQI) then converts these measurements into easy-to-understand air quality categories, helping people understand whether the air is clean, moderately polluted, or hazardous to health.
Pollutants used in AQI calculation include:
- PM₂.₅
- PM₁₀
- NO₂
- SO₂
- CO
- O₃
- NH₃
These pollutants are commonly known as criteria pollutants because they are widely used to assess air quality and pollution-related health risks.
Each pollutant receives a sub-index value based on its concentration.
The pollutant with the highest sub-index determines the final AQI value reported for a location.
For a detailed explanation, see: How AQI is Calculated in India (Formula, Breakpoints & Categories Explained)
Limitations of Air Pollution Monitoring Stations
Although monitoring stations provide valuable environmental data, they also have limitations.
Limited Spatial Coverage
A single monitoring station cannot represent pollution conditions across an entire city because pollution levels vary significantly between locations.
High Installation and Maintenance Costs
Continuous monitoring stations require advanced analyzers, calibration systems, and technical maintenance.
These costs limit the number of stations that can be installed.
Calibration and Data Quality Challenges
Monitoring instruments require regular calibration and maintenance to ensure reliable measurements.
Poor calibration can reduce measurement accuracy.
Conclusion
Air pollution monitoring stations are the scientific foundation of modern air quality management. By combining specialized pollutant analyzers, meteorological sensors, and data acquisition systems, these stations continuously measure air quality and provide the information needed for AQI reporting, pollution research, and environmental decision-making.
In India, monitoring networks operated by the Central Pollution Control Board (CPCB) and State Pollution Control Boards (SPCBs) help identify pollution hotspots, track long-term trends, and support public health measures. Understanding how these monitoring stations work also helps readers interpret AQI values more accurately and appreciate the science behind air quality reporting.
Frequently Asked Questions
What does an air pollution monitoring station measure?
Monitoring stations measure pollutants such as PM₂.₅, PM₁₀, nitrogen dioxide, sulfur dioxide, ozone, and carbon monoxide.
What is the difference between CAAQMS and manual monitoring?
CAAQMS stations provide continuous real-time monitoring, while manual stations collect air samples periodically for laboratory analysis.
Why is air pollution monitoring important?
Monitoring helps governments track pollution levels, calculate AQI, identify pollution hotspots, and evaluate environmental regulations.
Which agency operates air quality monitoring stations in India?
Most monitoring stations in India are operated by the Central Pollution Control Board (CPCB) and State Pollution Control Boards (SPCBs).
Can air pollution monitoring stations detect sudden pollution spikes?
Yes. Continuous monitoring stations can detect rapid increases in pollution levels caused by traffic congestion, industrial emissions, dust storms, or seasonal smog episodes.
How accurate are air pollution monitoring stations?
Regulatory monitoring stations are designed to provide highly accurate measurements using calibrated scientific instruments. Regular maintenance and calibration help ensure reliable air quality data for AQI reporting.
Why do monitoring stations need regular calibration?
Over time, environmental conditions and instrument wear can affect measurement accuracy. Routine calibration ensures that pollutant readings remain consistent and meet regulatory quality standards.
Can one monitoring station represent an entire city?
No. Air pollution varies significantly between traffic corridors, industrial areas, and residential neighborhoods. Large cities therefore operate multiple monitoring stations to capture local pollution patterns more accurately.
Why do official AQI values differ from portable air quality sensors?
Portable sensors are useful for personal awareness but often use lower-cost sensing technologies. Official AQI values are calculated from data collected by certified monitoring stations that follow standardized monitoring and quality-control procedures.
References
- CPCB – National Air Monitoring Programme (NAMP)
https://cpcb.nic.in/about-namp/ - CPCB – National Air Quality Monitoring Programme Data
https://cpcb.nic.in/namp-data/ - Ministry of Environment, Forest and Climate Change (MoEFCC) – National Clean Air Programme
https://moef.gov.in/en/major-initiatives/national-clean-air-programme-ncap/ - WHO Global Air Quality Guidelines
https://www.who.int/publications/i/item/9789240034228 - United States EPA – Air Sensor Toolbox
https://www.epa.gov/air-sensor-toolbox - European Environment Agency – Air Quality Monitoring and Assessment
https://www.eea.europa.eu/en/topics/in-depth/air-pollution