
Introduction
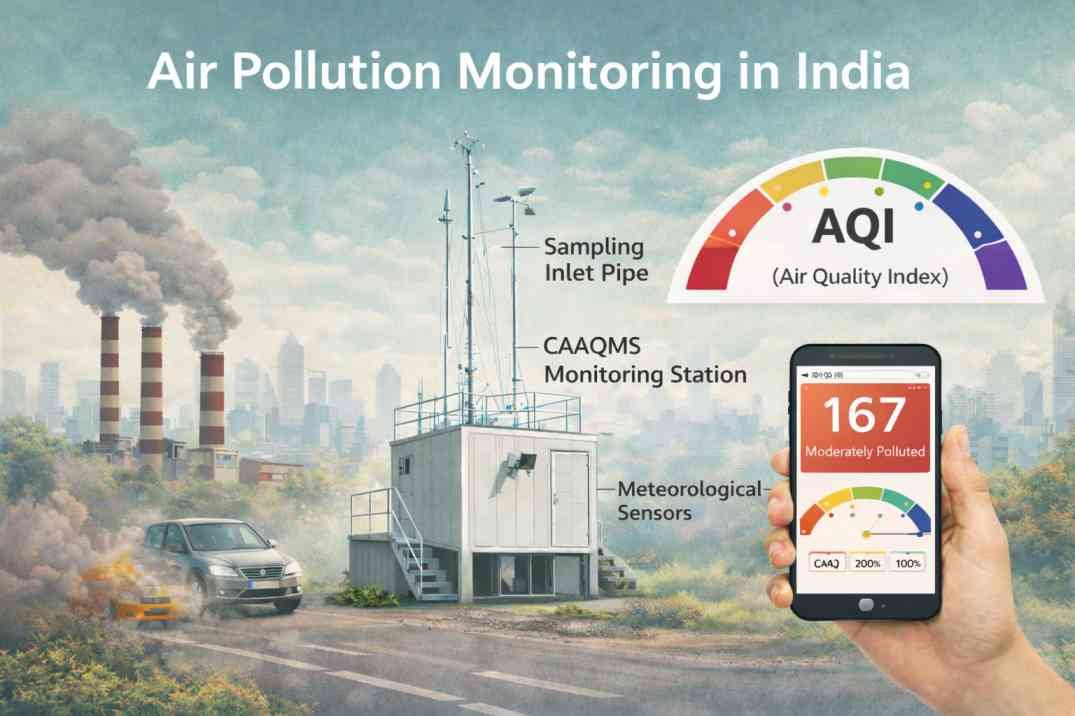
Continuous Ambient Air Quality Monitoring Systems (CAAQMS) are automated stations that measure air pollutants such as PM₂.₅, PM₁₀, NO₂, SO₂, O₃, and CO in real time.
In India, these monitoring systems are operated by CPCB and State Pollution Control Boards to track pollution levels, calculate the Air Quality Index (AQI), and support environmental monitoring across cities and industrial regions.
This guide explains how CAAQMS stations work, how pollutants are measured, and how monitoring data is used for AQI reporting in India.
CAAQMS Full Form
CAAQMS stands for Continuous Ambient Air Quality Monitoring System. It is an automated air quality monitoring station that continuously measures pollutants such as PM2.5, PM10, NO₂, SO₂, O₃, and CO and sends real-time data for AQI reporting and environmental monitoring.
What is a Continuous Ambient Air Quality Monitoring System (CAAQMS)?
A Continuous Ambient Air Quality Monitoring System (CAAQMS) is an automated monitoring station that continuously measures air pollutants in the surrounding atmosphere and transmits the data to centralized monitoring networks.
Unlike manual air monitoring methods that rely on periodic sample collection and laboratory analysis, CAAQMS stations use specialized analyzers to measure pollutants in near real time. These systems continuously measure pollutant concentrations and help environmental agencies track changing air quality conditions in real time.
In India, CAAQMS networks are operated mainly by the Central Pollution Control Board (CPCB) and State Pollution Control Boards (SPCBs) across major cities and industrial regions.
Most stations monitor pollutants such as:
- PM₂.₅
- PM₁₀
- nitrogen dioxide (NO₂)
- sulfur dioxide (SO₂)
- ozone (O₃)
- carbon monoxide (CO)
- ammonia (NH₃)
The monitoring data collected from these stations is used for Air Quality Index (AQI) reporting, pollution analysis, environmental research, and public health advisories.
Continuous vs Manual Air Quality Monitoring
Air quality monitoring is generally divided into two main approaches: manual monitoring and continuous monitoring.
Manual Monitoring
Manual monitoring involves collecting air samples over a fixed period and analyzing them later in laboratories using standardized methods. Although this approach can provide accurate results, the data is usually not available immediately.
Continuous Monitoring
Continuous monitoring uses automated monitoring stations equipped with electronic analyzers that measure pollutant concentrations continuously and transmit data to monitoring networks in near real time.
Because the measurements are updated regularly, continuous monitoring systems are more useful for:
- AQI reporting
- pollution alerts
- tracking daily pollution changes
- studying short-term pollution spikes
This is why CAAQMS networks have become an important part of modern air quality management systems in India.
Pollutants Measured by CAAQMS Stations
Most Continuous Ambient Air Quality Monitoring Systems (CAAQMS) measure several major air pollutants that are commonly used for air quality assessment and AQI calculation.
These pollutants include:
- PM₂.₅ — fine particulate matter that can penetrate deep into the lungs
- PM₁₀ — larger inhalable particles such as dust and smoke
- Nitrogen Dioxide (NO₂) — mainly released from vehicles and combustion processes
- Sulfur Dioxide (SO₂) — commonly associated with industrial emissions and fuel burning
- Ozone (O₃) — a secondary pollutant formed through atmospheric chemical reactions
- Carbon Monoxide (CO) — produced by incomplete combustion of fuels
- Ammonia (NH₃) — released from agricultural and waste-related activities
These pollutants are often called criteria pollutants because they are regulated under national air quality standards and are widely used to evaluate pollution exposure and health risks.
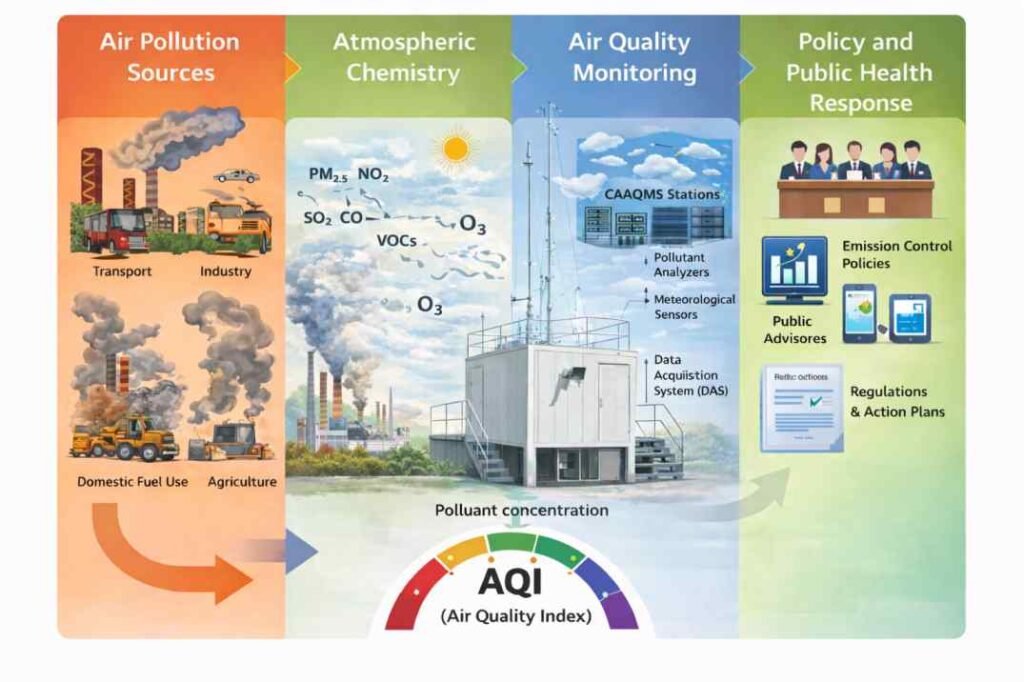
Common Pollution Sources Associated with Major Pollutants
| Pollutant | Common Sources |
|---|---|
| PM₂.₅ | vehicles, biomass burning, construction dust |
| PM₁₀ | road dust, construction activities, industrial emissions |
| NO₂ | vehicle exhaust and fuel combustion |
| SO₂ | industrial fuel burning and power plants |
| O₃ | atmospheric chemical reactions involving sunlight |
| CO | incomplete fuel combustion |
| NH₃ | agricultural and waste-related emissions |
How CAAQMS Stations Measure Air Pollutants
CAAQMS stations use specialized scientific instruments called pollutant analyzers to measure the concentration of air pollutants continuously.
How CAAQMS Data Becomes AQI
Ambient Air
↓
Sampling Inlet
↓
Pollutant Analyzers
↓
Data Acquisition System (DAS)
↓
AQI Calculation
↓
CPCB Monitoring Platform
↓
Public AQI Reporting
Ambient air enters the monitoring station through a sampling inlet system and passes through different analyzers designed for specific pollutants. The collected measurements are processed by a Data Acquisition System (DAS) and transmitted to central monitoring networks for AQI calculation and public reporting.
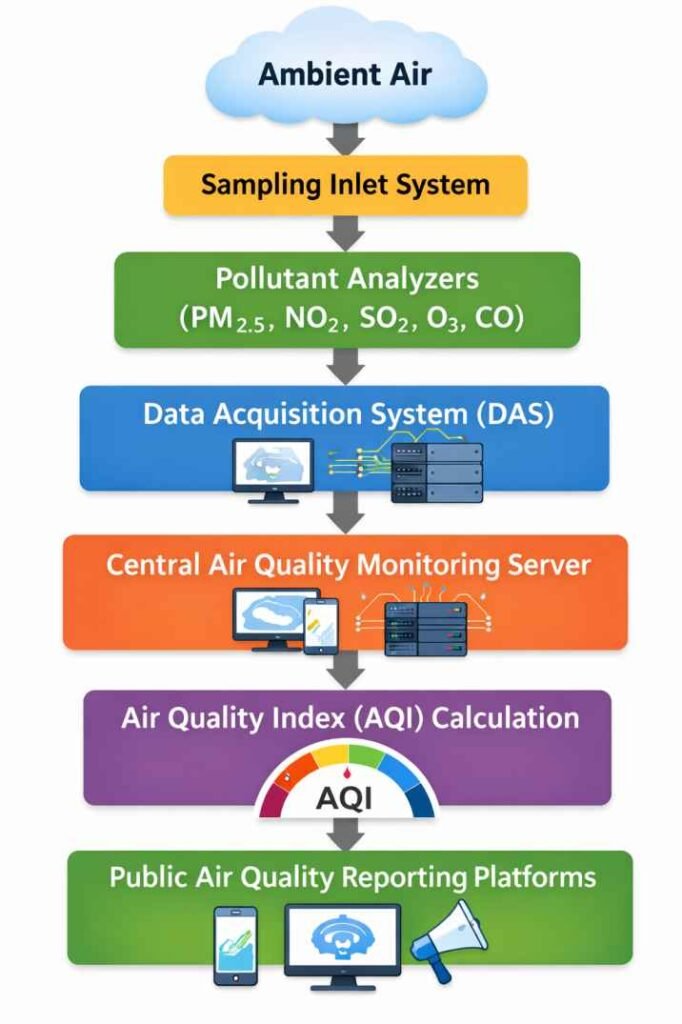
A simplified CAAQMS workflow:
- ambient air enters the monitoring station through a sampling inlet
- pollutant analyzers measure pollutant concentrations
- the Data Acquisition System (DAS) processes the measurements
- monitoring data is transmitted to central servers
- AQI values are calculated and published for public reporting
What Does CAAQMS Data Mean?
CAAQMS data refers to the real-time measurements collected by monitoring stations for pollutants such as PM2.5, PM10, NO₂, SO₂, O₃, CO, and NH₃. This data is processed by CPCB systems to calculate the Air Quality Index (AQI) and monitor pollution trends.
Measurement of Particulate Matter (PM₂.₅ and PM₁₀)
Particulate matter consists of tiny solid and liquid particles suspended in the air.
- PM₂.₅ refers to particles smaller than 2.5 micrometers
- PM₁₀ refers to particles smaller than 10 micrometers
CAAQMS stations commonly measure particulate matter using instruments such as Beta Attenuation Monitors (BAM) and Tapered Element Oscillating Microbalance (TEOM) analyzers.
These instruments collect airborne particles on filters and continuously calculate particle concentration in the surrounding air.
PM₂.₅ monitoring is especially important because fine particles can penetrate deep into the lungs and enter the bloodstream, increasing the risk of respiratory and cardiovascular diseases.
Measurement of Gaseous Pollutants
CAAQMS stations use different analytical techniques to measure gaseous pollutants such as NO₂, SO₂, O₃, CO, and NH₃. Common methods include chemiluminescence analyzers, ultraviolet fluorescence analyzers, UV photometric analyzers, and infrared absorption analyzers.
| Pollutant | Measurement Technique Used in CAAQMS |
|---|---|
| PM₂.₅ / PM₁₀ | Beta Attenuation Monitor (BAM) or TEOM |
| Nitrogen Dioxide (NO₂) | Chemiluminescence analyzer |
| Sulfur Dioxide (SO₂) | UV fluorescence analyzer |
| Ozone (O₃) | UV photometric analyzer |
| Carbon Monoxide (CO) | Infrared absorption analyzer |
| Ammonia (NH₃) | Chemiluminescence or optical detection |
Continuous Data Collection and Quality Control
CAAQMS stations operate continuously and generate large amounts of air quality data throughout the day. This information is processed by a Data Acquisition System (DAS), which stores, organizes, and transmits the measurements to central monitoring networks.
Before public reporting, monitoring data undergoes quality control checks to ensure accuracy and reliability. Environmental agencies regularly calibrate monitoring instruments, inspect analyzers, and review station performance to reduce measurement errors.
Proper calibration and maintenance are essential because inaccurate measurements can affect AQI reporting and pollution analysis.
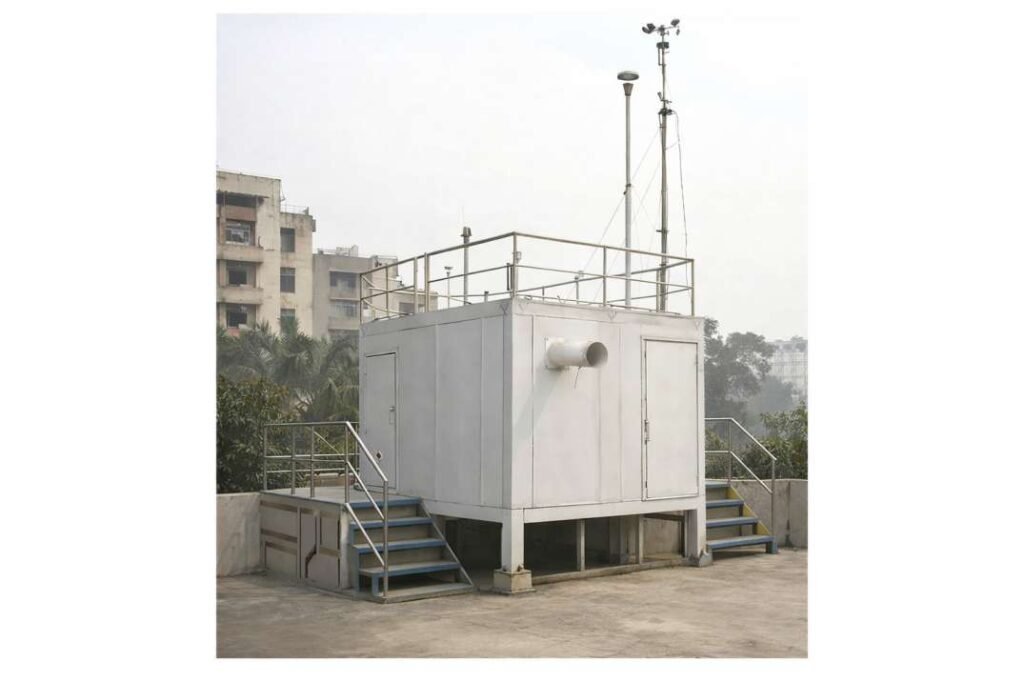
Main Components of a CAAQMS Station
A typical CAAQMS station includes several systems that work together to measure and report air quality data continuously.
Main components include:
- pollutant analyzers used to measure pollutants such as PM₂.₅, NO₂, SO₂, and O₃
- air sampling systems that collect ambient air for analysis
- meteorological sensors that record weather conditions such as wind speed, temperature, and humidity
- Data Acquisition Systems (DAS) that process and transmit monitoring data
- communication systems that send measurements to central monitoring networks
These components allow monitoring stations to collect continuous air quality data for AQI reporting and environmental analysis.
CAAQMS Monitoring Network in India
India has expanded its network of Continuous Ambient Air Quality Monitoring Systems (CAAQMS) across major cities and industrial regions over the past decade.
Role of CPCB in CAAQMS
The Central Pollution Control Board (CPCB) develops monitoring guidelines, manages national air quality data, supervises monitoring networks, and publishes AQI information collected from Continuous Ambient Air Quality Monitoring Systems across India.
These monitoring networks are operated mainly by the Central Pollution Control Board (CPCB), State Pollution Control Boards (SPCBs), and Pollution Control Committees.
CAAQMS stations are commonly installed in:
- traffic corridors
- residential areas
- industrial zones
- urban background locations
Large metropolitan cities such as Delhi, Mumbai, Bengaluru, and Kolkata operate multiple monitoring stations to track spatial variations in air pollution.
For example, Delhi operates multiple CAAQMS stations across traffic corridors, residential areas, and industrial zones to monitor how pollution levels vary across different parts of the city during severe winter pollution episodes.
The expansion of monitoring infrastructure is also supported by national programs such as the National Clean Air Programme (NCAP), which aims to strengthen air quality management across Indian cities.
How CAAQMS Data Is Used to Calculate AQI
Continuous monitoring stations measure pollutant concentrations throughout the day, but these measurements must be converted into a simplified indicator that the public can understand. This is done through the Air Quality Index (AQI) system used for air quality reporting in India.
Monitoring stations record hourly concentrations of major pollutants such as PM₂.₅, PM₁₀, nitrogen dioxide, sulfur dioxide, ozone, carbon monoxide, and ammonia. These measurements are processed using formulas defined by the Central Pollution Control Board to convert pollutant concentrations into AQI sub-indices.
Each pollutant receives its own sub-index value based on its concentration.
The pollutant with the highest sub-index determines the final AQI value reported for a location.
This method ensures that the pollutant posing the greatest health risk is reflected in the final air quality category.
The AQI scale in India ranges from Good to Severe, helping citizens quickly understand pollution levels and potential health risks. Continuous monitoring stations provide the real-time data required to update AQI values regularly.
Limitations of Continuous Air Quality Monitoring Systems
Although CAAQMS stations provide valuable real-time pollution data, they also have several limitations.
These monitoring systems are expensive to install and maintain because they require specialized analyzers, calibration equipment, communication infrastructure, and trained technical staff.
Monitoring coverage is also limited in many regions. Even large cities may have only a small number of monitoring stations, which means pollution levels can vary across areas that are not directly monitored.
Accurate measurements also depend on regular calibration and maintenance. Technical issues such as instrument malfunction, power failures, or communication errors can sometimes affect data quality.
In many rural and remote regions, continuous monitoring networks remain limited because of infrastructure and cost constraints.
Conclusion
Continuous Ambient Air Quality Monitoring Systems (CAAQMS) help environmental agencies track pollution levels, calculate AQI, and monitor air quality trends across Indian cities.
These monitoring systems play an important role in pollution research, environmental policy, and public health monitoring by providing continuous real-time air quality data.
Frequently Asked Questions
What is the full form of CAAQMS?
CAAQMS stands for Continuous Ambient Air Quality Monitoring System. It is an automated monitoring station that continuously measures air pollutants and provides real-time data for AQI reporting.
How often is AQI data updated in CAAQMS systems?
CAAQMS stations measure pollutants continuously, and AQI values are typically updated hourly using averaged monitoring data.
Are CAAQMS stations installed in every Indian city?
No. Continuous monitoring stations are mainly installed in major cities and industrial regions because they are expensive to operate and maintain.
Why do pollution levels vary across different monitoring stations?
Pollution levels can vary because traffic density, industrial activity, weather conditions, and local emission sources differ across locations.
How accurate are CAAQMS measurements?
CAAQMS stations use highly sensitive scientific instruments, but accurate measurements depend on regular calibration, maintenance, and quality control procedures.
What is the difference between PM₂.₅ and PM₁₀?
PM₂.₅ particles are smaller and can penetrate deeper into the lungs, while PM₁₀ particles are larger and are commonly associated with dust, smoke, and construction activities.
Can CAAQMS stations detect sudden pollution spikes?
Yes. Because CAAQMS stations measure pollutants continuously, they can detect rapid increases in pollution levels caused by traffic congestion, industrial emissions, dust events, or seasonal pollution episodes.
What is CAAQMS data?
CAAQMS data is the real-time pollution data collected from automated monitoring stations.
What is CPCB CAAQMS?
CPCB CAAQMS refers to the network of Continuous Ambient Air Quality Monitoring Systems operated or supervised by the Central Pollution Control Board for monitoring air quality across India.
References
National Clean Air Programme (NCAP), Ministry of Environment, Forest and Climate Change (MoEFCC)
https://moef.gov.in/en/division/air-quality-management/national-clean-air-programme/
Central Pollution Control Board (CPCB) – National Ambient Air Quality Monitoring Programme (NAMP)
https://cpcb.nic.in/air-quality-monitoring/
CPCB Guidelines for Continuous Ambient Air Quality Monitoring Stations (CAAQMS)
https://cpcb.nic.in/uploads/Projects/Air%20Quality/CAAQMS-Guidelines.pdf
Central Pollution Control Board (CPCB) – National Air Quality Index (AQI)
https://app.cpcbccr.com/AQI_India/
CPCB Protocol for Data Communication from Continuous Ambient Air Quality Monitoring Systems
https://cpcb.nic.in/uploads/Projects/Air%20Quality/Protocol_for_Data_Transmission.pdf
Centre for Science and Environment (CSE) – Principles of Continuous Ambient Air Quality Monitoring Systems
https://www.cseindia.org
Thermo Fisher Scientific – Ambient Air Monitoring Technologies
https://www.thermofisher.com/in/en/home/industrial/environmental/air-quality-analysis/ambient-gas-monitoring/technologies.html
PubMed – Chemiluminescent Measurement of Nitrogen Oxides in Air Monitoring Systems
https://pubmed.ncbi.nlm.nih.gov/2256545/