
Introduction
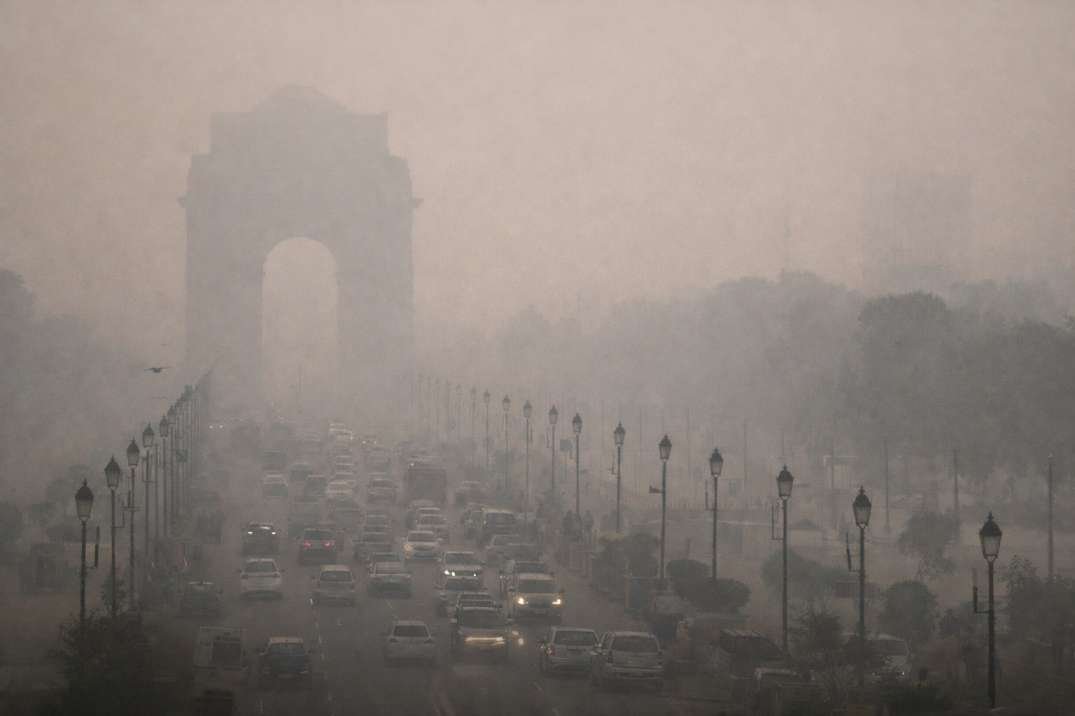
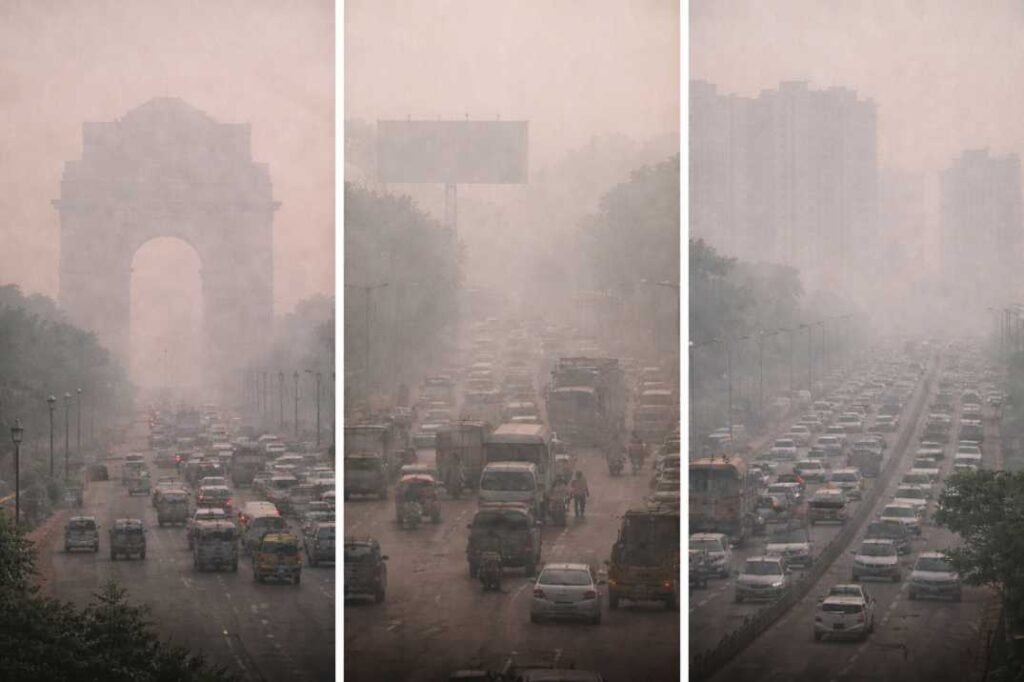
Cities like Delhi, Ghaziabad, Noida, Kanpur, and Patna frequently record some of the highest AQI and PM2.5 levels in India, especially during winter. However, pollution rankings are not permanent because weather conditions, seasonal changes, and regional pollution transport can rapidly change air quality.
This guide explains why some Indian cities experience severe pollution, how AQI levels are measured, and why pollution patterns change throughout the year.
The air quality classifications used here follow the Official National AQI Framework by CPCB.
Quick Answer: Delhi, Ghaziabad, Noida, Kanpur, and Patna are among the most polluted cities in India, especially during winter when PM2.5 levels and AQI can rise sharply. These cities experience severe pollution not only because of traffic and industry, but also due to weather conditions such as low wind speed and winter temperature inversion that trap pollutants near the ground.
Most Polluted Cities in India
Cities in the Indo-Gangetic Plain—such as Delhi, Ghaziabad, Noida, Kanpur, and Patna—frequently record the highest PM2.5 and AQI levels in India. These cities experience severe pollution because high population density, traffic congestion, industrial activity, construction dust, and winter weather conditions combine to trap pollutants close to the ground.
Northern Indian cities often report worse winter pollution than many coastal cities because calm winds and temperature inversion reduce the natural dispersion of polluted air.
To understand how pollution levels are classified, see AQI explained in India.
How Air Pollution in Cities Is Measured
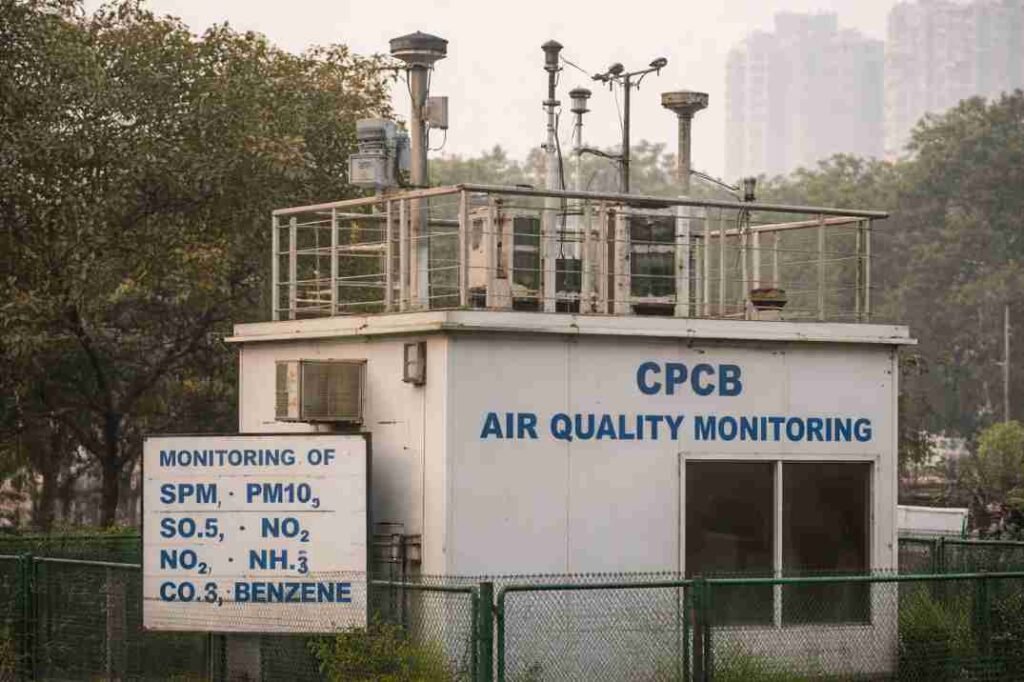
Air pollution in Indian cities is measured using monitoring stations that track pollutants such as PM2.5, PM10, NO₂, SO₂, ozone, and carbon monoxide. Among these pollutants, PM2.5 is considered one of the most important because these tiny particles can enter deep into the lungs and affect human health over time.
Pollutant concentrations are converted into an Air Quality Index (AQI) so people can quickly understand whether air quality is safe, poor, or severe. Monitoring is mainly carried out through CPCB and State Pollution Control Board stations located across different cities.
However, AQI values can vary within the same city. A monitoring station near heavy traffic or industrial areas may record much higher pollution levels than one located in residential or green zones.
Air Pollution Across Major Indian Cities
Air pollution patterns vary significantly across Indian cities because emission sources, geography, and weather conditions are different in each region. Cities such as Delhi and Noida are strongly affected by traffic congestion, road dust, and winter inversion, while industrial areas like Ghaziabad and Kanpur experience additional emissions from factories and manufacturing activity.
Patna and several eastern Indo-Gangetic Plain cities also experience high PM2.5 levels during winter due to biomass burning, stagnant weather, and regional pollution transport. In contrast, many coastal cities in southern India often maintain comparatively lower AQI levels because stronger winds and sea-breeze circulation help disperse pollutants more effectively.
Commonly Reported Highly Polluted Cities
| City | Key Sources | Dominant Pollutant | Seasonal Peak |
|---|---|---|---|
| Delhi | Traffic, construction | PM2.5 | Winter |
| Ghaziabad | Industry | PM2.5 | Winter |
| Noida | Dust, traffic | PM10/PM2.5 | Winter |
| Kanpur | Industry | Mixed | Winter |
| Patna | Biomass burning | PM2.5 | Winter |
Regional Pollution Patterns in India
Several North Indian cities continue to record very high PM2.5 levels, especially during winter months when calm winds and temperature inversion trap pollutants near the ground. Delhi frequently reaches “Very Poor” to “Severe” AQI levels during this period, while nearby cities such as Ghaziabad, Noida, Kanpur, and Patna also experience major pollution spikes.
In contrast, many coastal cities in southern India often maintain comparatively lower AQI levels because stronger winds, sea-breeze circulation, and better atmospheric ventilation help disperse pollutants more effectively.
Pollution patterns in India are strongly seasonal. Winter usually records the highest AQI levels, while monsoon rainfall often improves air quality by washing pollutants out of the atmosphere.
Why Some Indian Cities Experience Severe Pollution
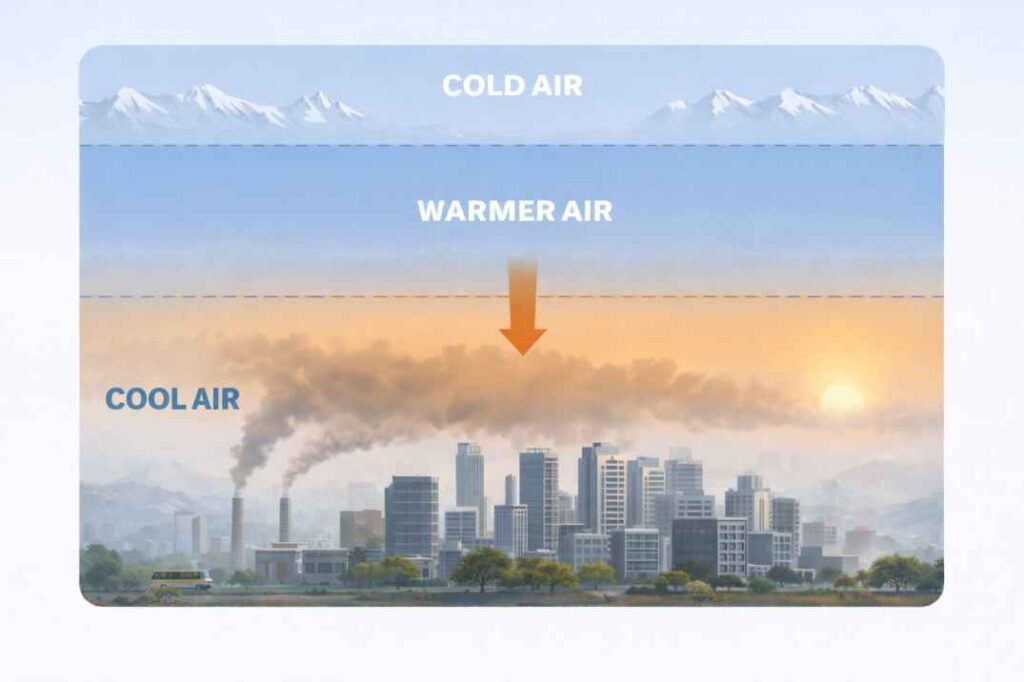
Air pollution in Indian cities is caused by a combination of emissions, weather conditions, geography, and urban growth. Cities located in the Indo-Gangetic Plain often experience the worst pollution because calm winter winds and temperature inversion prevent pollutants from dispersing normally.
Vehicle emissions, construction dust, industrial activity, and biomass burning continuously release particulate matter into the atmosphere. During winter, these pollutants remain trapped close to the ground for longer periods, causing PM2.5 and AQI levels to rise rapidly.
Regional pollution transport also affects air quality. Smoke and pollutants from nearby industrial zones or agricultural residue burning can travel across states and worsen pollution in large urban areas such as Delhi and surrounding NCR cities.
Rapid urbanization further increases pollution pressure through traffic congestion, construction activity, and higher energy demand across expanding cities.
Why Pollution Levels Change Throughout the Year
Air pollution levels in Indian cities change significantly across different seasons because weather conditions directly affect how pollutants move and disperse in the atmosphere.
Winter usually records the highest pollution levels, especially in northern India. During this period, temperature inversion, low wind speed, and stagnant air trap pollutants close to the ground, causing PM2.5 and AQI levels to rise rapidly. Additional emissions from biomass burning and heating activities can further worsen air quality.
During summer, stronger sunlight and faster air movement help disperse pollutants more effectively, although pollution levels may still remain above safe limits in densely populated cities.
Monsoon season often brings the cleanest air because rainfall helps remove dust and particulate matter from the atmosphere. This is why many cities experience noticeable AQI improvement during rainy months.
Are These Cities Always the Most Polluted?
No city remains permanently at the top of India’s pollution rankings. AQI and PM2.5 levels change throughout the year depending on weather conditions, seasonal emissions, rainfall, and wind patterns.
Northern cities often experience the worst pollution during winter because stagnant air and temperature inversion trap pollutants near the ground. However, air quality may improve significantly during monsoon months when rainfall helps clear particulate matter from the atmosphere.
Pollution rankings can also vary depending on monitoring coverage and pollutant type. A city with higher PM2.5 levels may not always record the highest overall AQI on a particular day.
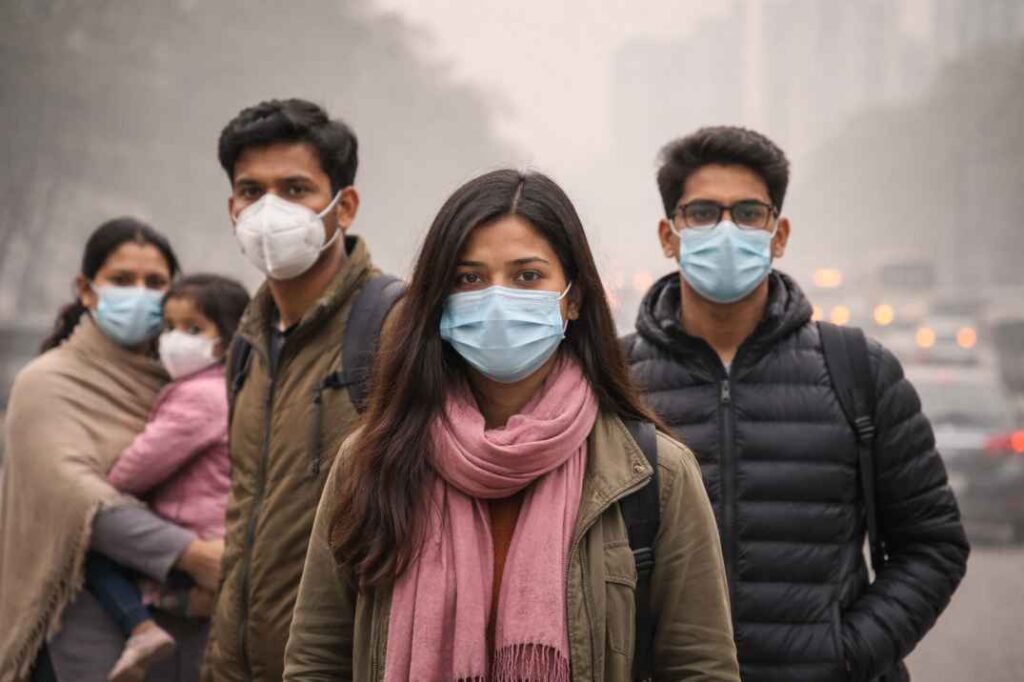
Managing Exposure to PM2.5 Pollution
PM2.5 particles are extremely small and can enter deep into the lungs during breathing. Long-term exposure to high PM2.5 levels is associated with respiratory and cardiovascular health risks, especially in densely populated urban areas.
During severe pollution episodes, outdoor air quality may remain “Very Poor” or “Severe” for several days. In such conditions, reducing outdoor exposure, avoiding heavy exercise near traffic, and using properly fitted N95 masks can help reduce health risks.
Indoor air quality can also be affected during high pollution periods because outdoor pollutants often enter homes, schools, and workplaces through ventilation and open windows.
How to Use AQI Data for Your Health
AQI is most useful as a short-term air quality indicator that helps people understand when pollution levels may affect outdoor activities and breathing comfort. Even within the same city, AQI can change quickly depending on traffic, weather, and local emissions.
| AQI Level | Health Impact | Immediate Action Required |
| 0–100 | Good to Moderate | Safe for all outdoor activities. |
| 101–200 | Poor | Sensitive groups should limit outdoor exertion. |
| 201–300 | Very Poor | Avoid morning/evening outdoor exercise. |
| 301+ | Severe | Stay indoors; use N95 masks if you must go out. |
AQI should be used as a general environmental guide rather than an exact personal exposure measurement. Sensitive groups such as children, older adults, and people with respiratory conditions are usually more affected during “Very Poor” and “Severe” pollution episodes.
When City Rankings Can Be Misleading
Pollution rankings are useful for understanding long-term air quality patterns, but they are not always reliable for daily decisions. A city with moderate annual pollution may still experience dangerous AQI spikes during winter, traffic congestion, or stagnant weather conditions.
For short-term health decisions, real-time AQI data is usually more useful than overall city rankings.
Conclusion
Air pollution in India is shaped by a combination of emissions, geography, weather conditions, and seasonal changes. Cities in the Indo-Gangetic Plain often experience the most severe winter pollution because pollutants remain trapped near the ground for longer periods.
Understanding seasonal AQI trends and PM2.5 exposure helps explain why air quality changes so dramatically across Indian cities.
Frequently Asked Questions (FAQs)
Which Indian cities usually record the highest AQI levels?
Delhi, Ghaziabad, Noida, Kanpur, and Patna frequently report high PM2.5 and AQI levels, especially during winter months.
Why does pollution become severe during winter?
Cold stagnant air, low wind speed, and temperature inversion trap pollutants close to the ground, causing AQI levels to rise rapidly.
Why do coastal cities often have better air quality?
Sea-breeze circulation, stronger winds, and better atmospheric ventilation help disperse pollutants more effectively in many coastal regions.
Is AQI the same throughout an entire city?
No. AQI can vary depending on traffic density, industrial activity, weather conditions, and monitoring station location.
Is PM2.5 more dangerous than visible dust?
PM2.5 particles are much smaller than visible dust and can enter deep into the lungs during breathing, making them a major health concern in urban pollution.
References
- Central Pollution Control Board (CPCB) – AQI Dashboard
https://airquality.cpcb.gov.in/AQI_India/ - World Health Organization (WHO) – Air Quality Guidelines
https://www.who.int/publications/i/item/9789240034228 - IQAir – World Air Quality Report
https://www.iqair.com/india - Ministry of Environment, Forest and Climate Change (MoEFCC)
https://moef.gov.in/en/air-pollution/ - National Clean Air Programme (NCAP) – https://prana.cpcb.gov.in/#/about-ncap