
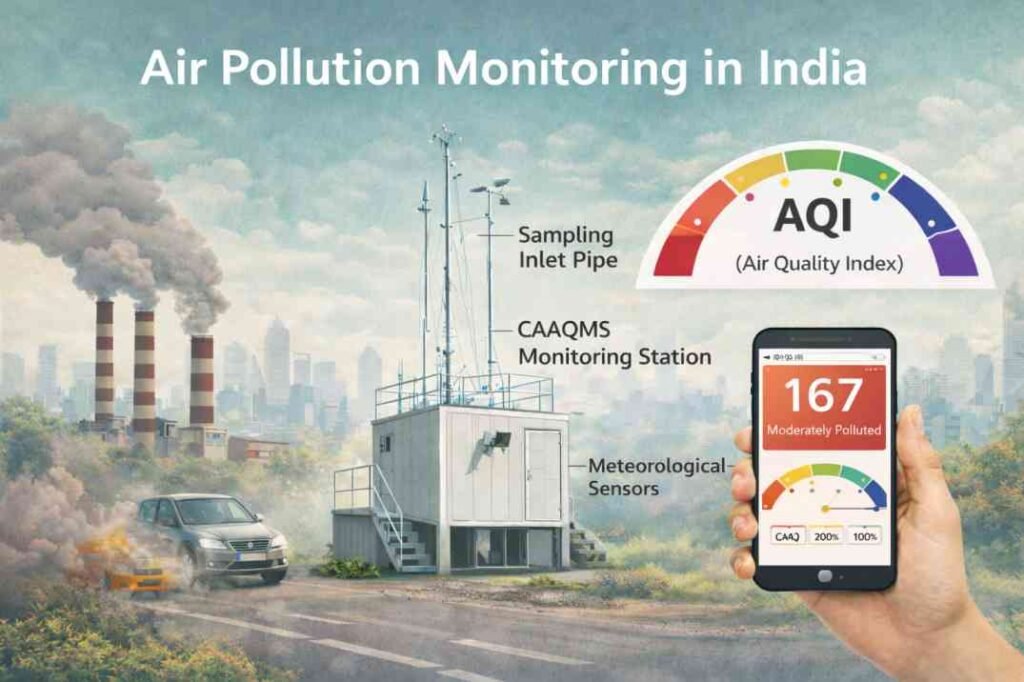
A Continuous Ambient Air Quality Monitoring System (CAAQMS) is an automated station that measures air pollutants in real time and transmits data to central servers for Air Quality Index (AQI) calculation and public reporting. These systems are operated by CPCB and SPCBs across Indian cities to track pollution levels continuously.
Introduction
Air pollution levels in Indian cities can change rapidly within hours due to traffic, industrial activity, weather conditions, and seasonal sources such as crop residue burning. To track these fluctuations accurately, India relies on Continuous Ambient Air Quality Monitoring Systems (CAAQMS), which provide real-time air quality data.
These automated monitoring systems measure air pollutants continuously and transmit data in near real time. The information collected by CAAQMS stations helps scientists, policymakers, and the public understand how pollution levels change throughout the day.
Organizations such as the Central Pollution Control Board and various State Pollution Control Boards operate networks of monitoring stations across major Indian cities. Data from these stations is used to calculate the Air Quality Index, issue pollution alerts, and evaluate the effectiveness of environmental regulations.
Unlike traditional monitoring methods that rely on periodic sampling, CAAQMS stations provide continuous measurements of multiple pollutants, allowing authorities to observe pollution trends as they happen. This capability is particularly important in cities where pollution levels can rise rapidly due to traffic congestion, weather changes, or seasonal emission sources.
Understanding how these monitoring systems work is essential for interpreting air quality reports and assessing the reliability of pollution data. This article explains what CAAQMS systems are, how they measure pollutants, and why real-time monitoring plays a central role in air quality management in India. Our article How Air Quality Is Measured in India explains the broader monitoring framework used across the country.
Continuous Ambient Air Quality Monitoring Systems (CAAQMS) are automated monitoring stations that measure air pollutants and transmit real-time data to environmental monitoring networks.
This article serves as a central guide to understanding how CAAQMS systems work in India, including how pollutants are measured, how monitoring stations operate, and how real-time data is used to calculate the Air Quality Index (AQI).
Key Topics Covered in This Article
This guide explains how Continuous Ambient Air Quality Monitoring Systems (CAAQMS) work and how real-time air quality monitoring supports air pollution management in India.
Main topics covered include:
- What Continuous Ambient Air Quality Monitoring Systems (CAAQMS) are
- Differences between continuous monitoring and manual air quality monitoring
- Major air pollutants measured by CAAQMS stations
- Measurement technologies used in air quality monitoring instruments
- Key components of a CAAQMS monitoring station
- How monitoring data is used to calculate the Air Quality Index (AQI)
- The role of monitoring networks in managing air pollution in India
This overview helps readers understand how air pollution monitoring systems collect,
process, and report real-time environmental data.
What is a Continuous Ambient Air Quality Monitoring System (CAAQMS)?
A Continuous Ambient Air Quality Monitoring System (CAAQMS) is an automated monitoring station that continuously measures air pollutants in the surrounding atmosphere. These systems operate around the clock and transmit pollution data to centralized monitoring networks.
Unlike traditional air monitoring methods that require periodic sampling and laboratory analysis, CAAQMS stations use specialized analyzers to measure pollutant concentrations in near real time. This allows environmental agencies to observe how pollution levels change throughout the day.
In India, national monitoring networks are coordinated by the Central Pollution Control Board along with State Pollution Control Boards, which operate monitoring stations across major cities.
Continuous monitoring stations operate as part of a larger air pollution monitoring network that includes ground monitoring stations, satellite observations, and air quality reporting systems, as explained in our guide on air pollution monitoring systems in India.
Continuous vs Manual Air Quality Monitoring
Air quality monitoring can generally be divided into two approaches:
Manual monitoring
Manual monitoring involves collecting air samples over a specific period and analyzing them in laboratories using standardized analytical methods. While this method provides accurate measurements, the results are often available only after several hours or days.
Continuous monitoring
Automated air quality monitoring stations measure pollutants using electronic analyzers that record concentrations at regular intervals and transmit the data directly to monitoring networks.
Because of this automation, continuous monitoring provides timely pollution data, which is essential for public health alerts and environmental management.
Pollutants Measured by CAAQMS Stations
Most CAAQMS stations monitor several key pollutants that are commonly used to assess air quality. These include:
- PM₂.₅ (fine particulate matter)
- PM₁₀ (coarse particulate matter)
- Nitrogen dioxide (NO₂)
- Sulfur dioxide (SO₂)
- Ozone (O₃)
- Carbon monoxide (CO)
- Ammonia (NH₃)
These pollutants are often referred to as criteria pollutants because they are regulated under national air quality standards and are widely used to assess air pollution exposure.
Role of CAAQMS Data in Air Quality Reporting
Data collected from monitoring stations plays an important role in public air quality reporting. Pollution measurements from CAAQMS networks are used to calculate the Air Quality Index (AQI), which simplifies pollution levels for public reporting.
Many cities publish AQI values hourly through government portals and environmental monitoring platforms. These updates allow residents to track air quality conditions and take precautions when pollution levels become hazardous.
Why Real-Time Monitoring Matters
Air pollution levels in cities can change rapidly due to traffic emissions, industrial activity, weather conditions, and seasonal sources such as crop residue burning. Continuous monitoring systems allow authorities to detect these changes quickly.
By providing near real-time data, CAAQMS networks support:
- early pollution warnings
- environmental research
- regulatory enforcement
- public health advisories
For this reason, continuous monitoring has become a central component of modern air quality management systems.
Example: Real-Time Monitoring During Delhi Smog
During winter months, cities such as Delhi often experience severe air pollution episodes caused by a combination of vehicle emissions, industrial activity, and crop residue burning.
CAAQMS stations detect rapid increases in PM2.5 levels in real time, often showing sharp hourly spikes in pollution concentrations. This data allows authorities to issue health advisories, implement emergency response measures, and monitor how pollution levels change throughout the day.
Without continuous monitoring systems, such rapid pollution events would be difficult to detect and manage effectively.
Why Continuous Air Quality Monitoring Is Important
Continuous air quality monitoring plays a crucial role in understanding how pollution levels change over time. In large urban areas, pollutant concentrations can vary significantly within a single day due to traffic patterns, industrial emissions, and weather conditions. Continuous monitoring systems help capture these rapid changes by measuring pollutants throughout the day.
Compared with periodic sampling methods, real-time monitoring provides a more detailed picture of how air pollution behaves in the atmosphere. This information is essential for environmental research, pollution control policies, and public health protection.
The measurements collected by monitoring stations are used to calculate the Air Quality Index (AQI), which converts pollutant concentrations into a simple scale for public reporting. A detailed explanation is available in Air Quality Index (AQI) Explained: Measurement Structure and Reporting Framework.
Detecting Rapid Changes in Pollution Levels
Air pollution in cities often changes quickly depending on human activities and meteorological conditions. Morning and evening traffic peaks, for example, can cause sharp increases in particulate matter and nitrogen dioxide levels.
Continuous monitoring systems record pollutant concentrations at regular intervals, often every few minutes. This allows environmental agencies to observe short-term pollution spikes that might be missed by manual monitoring programs.
Such detailed measurements help scientists understand how emissions from vehicles, industries, and other sources affect urban air quality.
Supporting Air Quality Index (AQI) Reporting
Real-time monitoring data is used to calculate the Air Quality Index (AQI), which communicates pollution levels to the public in a simplified format. The AQI converts pollutant concentrations into categories such as Good, Moderate, Poor, or Severe.
Environmental authorities use continuous monitoring data to update AQI values regularly. This helps citizens track local air quality conditions and make informed decisions about outdoor activities.
In India, AQI calculations and reporting are coordinated by the Central Pollution Control Board through national air quality monitoring platforms.
Helping Governments Manage Pollution Episodes
Continuous monitoring systems are particularly important during severe pollution episodes. When pollution levels rise rapidly, authorities need timely information to respond effectively.
Real-time data from monitoring stations can help governments:
- issue health advisories to the public
- implement temporary pollution control measures
- monitor the effectiveness of emission reduction policies
For example, during winter smog episodes in North Indian cities, monitoring networks provide critical information about how pollution levels evolve throughout the day.
Improving Environmental Research and Policy
Air pollution policies depend heavily on reliable data. Continuous monitoring systems provide long-term datasets that scientists and policymakers use to analyze pollution trends.
These datasets help answer important questions such as:
- How pollution levels change across seasons
- Which pollutants are increasing or decreasing over time
- Whether pollution control measures are effective
By providing consistent and reliable measurements, continuous monitoring networks support evidence-based environmental policy and urban air quality management.
To understand how air quality data is generated and reported, it is important to examine how a CAAQMS station operates step by step.
How CAAQMS Stations Measure Air Pollutants
Continuous Ambient Air Quality Monitoring Systems use specialized scientific instruments called pollutant analyzers to measure the concentration of different air pollutants. These instruments draw ambient air into the monitoring station and analyze it using physical and chemical detection methods. A detailed explanation of the sensors and instruments used in monitoring stations is provided in our guide Air Pollution Monitoring Stations: How Sensors Measure Air Pollutants.
Each pollutant requires a different measurement technique because gases and particles behave differently in the atmosphere. The analyzers operate continuously and record pollutant concentrations at regular intervals, often every few minutes.
The collected data is then processed and transmitted to central monitoring systems for analysis and public reporting.
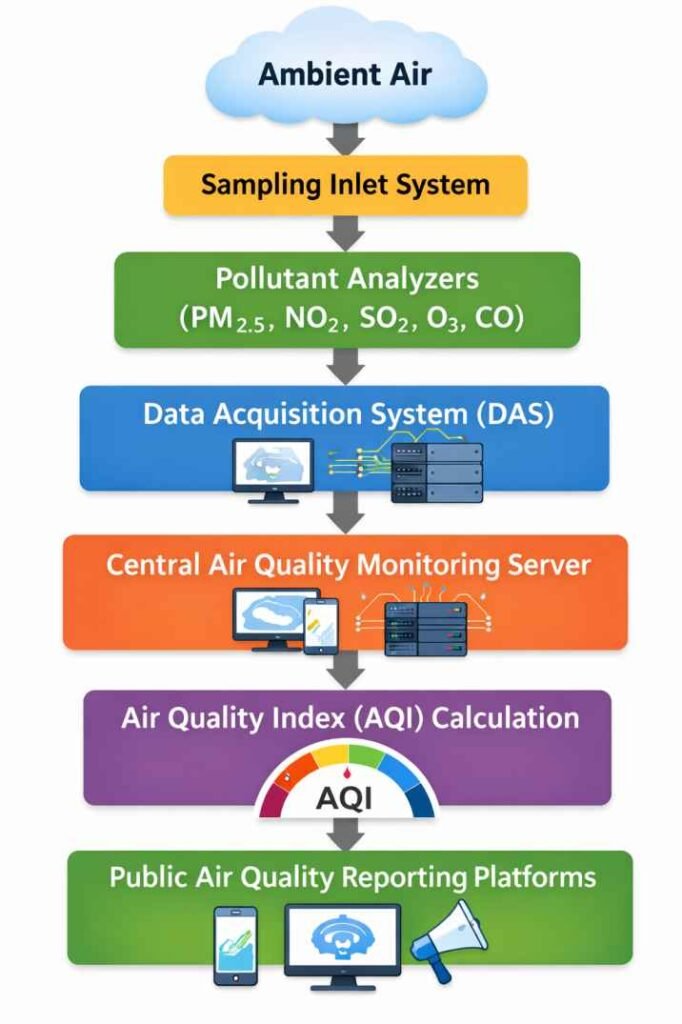
A simplified workflow of a CAAQMS station:
- Ambient air enters through a sampling inlet system
- Pollutants are measured using specialized analyzers
- Data is processed by a Data Acquisition System (DAS)
- Data is transmitted to central monitoring servers
- Air Quality Index (AQI) is calculated
- Information is published on public platforms
Measurement of Particulate Matter (PM₂.₅ and PM₁₀)
Particulate matter refers to tiny solid or liquid particles suspended in the air. These particles are categorized based on their size:
- PM₂.₅ – particles smaller than 2.5 micrometers
- PM₁₀ – particles smaller than 10 micrometers
CAAQMS stations typically measure particulate matter using techniques such as Beta Attenuation Monitoring (BAM) or Tapered Element Oscillating Microbalance (TEOM).
These instruments work by collecting airborne particles on a filter and measuring the mass of particles deposited over time. The measurement system continuously calculates the concentration of particulate matter present in the surrounding air.
Because fine particles can penetrate deep into the lungs and bloodstream, PM₂.₅ measurements are particularly important for assessing health risks associated with air pollution.
Different pollutants require different analytical techniques because gases and particles interact with light and chemical reactions in different ways.
| Pollutant | Measurement Technique Used in CAAQMS |
|---|---|
| PM₂.₅ / PM₁₀ | Beta Attenuation Monitor (BAM) or TEOM |
| Nitrogen Dioxide (NO₂) | Chemiluminescence analyzer |
| Sulfur Dioxide (SO₂) | UV fluorescence analyzer |
| Ozone (O₃) | UV photometric analyzer |
| Carbon Monoxide (CO) | Infrared absorption analyzer |
| Ammonia (NH₃) | Chemiluminescence or optical detection |
Measurement of Gaseous Pollutants
Several gaseous pollutants are commonly monitored in continuous monitoring stations. Each pollutant requires a specific analytical method to determine its concentration.
Examples include:
Nitrogen Dioxide (NO₂)
Measured using chemiluminescence analyzers, which detect light produced during chemical reactions involving nitrogen oxides.
Sulfur Dioxide (SO₂)
Measured using ultraviolet fluorescence analyzers, which detect ultraviolet light emitted by sulfur dioxide molecules when they are excited by radiation.
Ozone (O₃)
Measured using UV photometric analyzers, which determine ozone concentration by measuring how strongly ozone absorbs ultraviolet light.
Carbon Monoxide (CO)
Measured using infrared absorption techniques, which detect how carbon monoxide molecules absorb infrared radiation.
These measurement techniques allow monitoring stations to detect very small concentrations of pollutants with high precision.
Meteorological Measurements at Monitoring Stations
In addition to measuring pollutants, most CAAQMS stations also record local weather conditions. Meteorological parameters are important because weather strongly influences how pollutants disperse in the atmosphere. Wind patterns, atmospheric stability, and temperature inversions can strongly influence whether pollutants disperse quickly or accumulate near the ground.
Common meteorological measurements include:
- wind speed and direction
- temperature
- humidity
- atmospheric pressure
- solar radiation
These measurements help scientists understand how atmospheric conditions affect pollution levels and pollutant transport.
Continuous Data Collection and Quality Control
The analyzers in CAAQMS stations operate continuously and generate large amounts of data. This data is processed by a data acquisition system within the monitoring station.
Before being reported publicly, the measurements undergo several quality control steps to ensure accuracy. Calibration procedures and automated system checks help maintain reliable data collection.
Monitoring networks managed by agencies such as the Central Pollution Control Board regularly review station data to verify its accuracy and consistency.
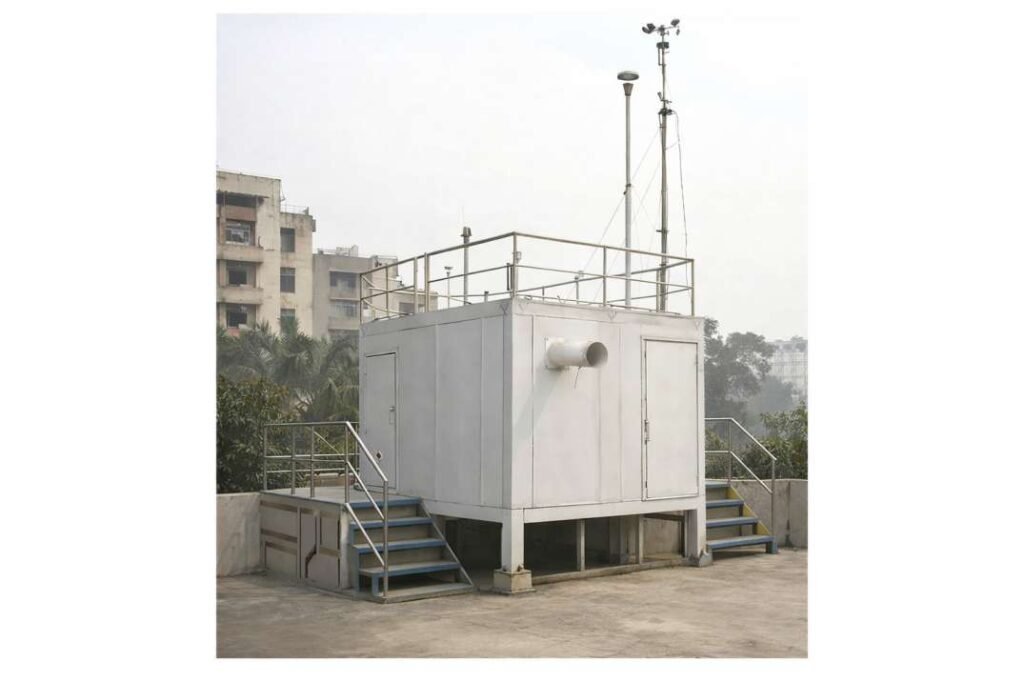
Components of a CAAQMS Monitoring Station
A Continuous Ambient Air Quality Monitoring System is not just a single instrument but a complete monitoring setup consisting of analyzers, sensors, and communication systems. Instead, it is a complete monitoring setup that includes multiple analyzers, sensors, and data communication systems working together to measure and report air quality.
Each monitoring station is designed to operate continuously with minimal human intervention. The different components of a CAAQMS station ensure accurate measurements, reliable data transmission, and proper system maintenance.
How Monitoring Data Flows Through the System
Ambient Air
↓
Sampling Inlet
↓
Pollutant Analyzer
↓
Data Acquisition System
↓
Monitoring Network Server
↓
AQI Calculation
↓
Public Air Quality Reporting
Pollutant Analyzers
The most important part of a monitoring station is the set of pollutant analyzers used to measure air contaminants. These instruments continuously draw in ambient air and analyze it using different detection techniques.
A typical CAAQMS station may include analyzers for:
- PM₂.₅ and PM₁₀ particulate matter
- Nitrogen dioxide (NO₂)
- Sulfur dioxide (SO₂)
- Ozone (O₃)
- Carbon monoxide (CO)
- Ammonia (NH₃)
Each analyzer is designed specifically for a particular pollutant and must be calibrated regularly to maintain measurement accuracy.
Air Sampling System
The air sampling system ensures that ambient air is properly collected and delivered to the analyzers. It typically includes inlet pipes, filters, and pumps that control the airflow entering the monitoring equipment.
Sampling inlets are usually installed at standardized heights above ground level to ensure that measurements represent the surrounding ambient air environment rather than localized pollution sources.
Proper sampling is important because incorrect airflow or contamination in the inlet system can affect measurement accuracy.
Meteorological Sensors
Most monitoring stations also include meteorological sensors that record local weather conditions. Weather plays a major role in determining how pollutants move and disperse in the atmosphere.
Common meteorological measurements include:
- wind speed
- wind direction
- temperature
- relative humidity
- atmospheric pressure
- solar radiation
These measurements help researchers understand how atmospheric conditions influence pollution levels and pollutant transport.
Data Acquisition System (DAS)
The Data Acquisition System (DAS) acts as the central control unit of the monitoring station. It collects data from all analyzers and sensors and stores it in digital format.
The system also performs initial data processing, time-stamping, and quality checks before transmitting the information to remote monitoring servers.
Modern DAS systems allow environmental agencies to access monitoring data remotely and observe station performance in real time.
Communication and Data Transmission Network
Once collected and processed, monitoring data must be transmitted to central databases. This is usually done through secure communication systems such as mobile networks, internet connections, or satellite links.
These networks allow monitoring stations to send pollution measurements continuously to national air quality monitoring platforms managed by agencies such as the Central Pollution Control Board.
The transmitted data is then used for air quality analysis, AQI calculation, and public reporting.
Calibration and Maintenance Systems
To ensure reliable measurements, monitoring stations include systems that allow instruments to be calibrated regularly. Calibration gases and automated testing procedures help verify that analyzers are functioning correctly.
Regular maintenance is also required to clean sampling systems, replace filters, and check instrument performance. Without proper maintenance, monitoring data can become inaccurate.
CAAQMS Monitoring Network in India
India has developed an expanding network of continuous air quality monitoring stations to track pollution levels across major cities and industrial regions. These monitoring systems provide real-time information about pollutant concentrations and support national air quality management programs.
Over the past decade, India has significantly expanded its network of continuous air quality monitoring stations across major cities and industrial regions.
The national monitoring framework is coordinated by the Central Pollution Control Board in collaboration with various State Pollution Control Boards (SPCBs) and Pollution Control Committees in union territories.
India has significantly expanded its real-time monitoring network over the past decade. Continuous monitoring stations are now installed in many major metropolitan regions and industrial clusters to track urban air pollution trends. These stations are integrated into national air quality monitoring platforms managed by the Central Pollution Control Board, which publishes real-time pollution data for public access. India now operates several hundred continuous monitoring stations across major cities and industrial regions as part of the national air quality monitoring framework.
The expansion of monitoring infrastructure is also supported by national initiatives such as the National Clean Air Programme, which aims to improve air quality management and strengthen monitoring capacity across Indian cities.
Monitoring data also helps scientists evaluate pollution sources by comparing measured pollutant concentrations with estimated emissions from different sectors. These estimates are developed using Emission Inventories: How Air Pollution Sources Are Quantified.
National Air Quality Monitoring Framework
India operates two main types of air quality monitoring systems:
Manual monitoring networks
These stations collect air samples periodically and analyze them in laboratories. They form part of the National Ambient Air Quality Monitoring Programme.
Continuous monitoring networks (CAAQMS)
These automated stations measure pollutants continuously and transmit real-time data to central monitoring platforms.
Continuous monitoring systems are particularly useful in densely populated urban areas where pollution levels can change rapidly throughout the day.
Expansion of Monitoring Stations in Indian Cities
Over the past decade, India has significantly expanded its network of continuous monitoring stations. Many major cities now operate multiple CAAQMS stations to capture spatial variations in pollution levels across different parts of the city.
Monitoring stations are typically located in areas such as:
- traffic corridors
- residential neighborhoods
- industrial zones
- urban background locations
For example, Delhi operates dozens of monitoring stations across residential areas, traffic corridors, and industrial zones in order to capture spatial variations in air pollution across the city.
This distribution helps scientists understand how different emission sources affect local air quality.
Large metropolitan regions such as Delhi, Mumbai, Bengaluru, and Kolkata operate several monitoring stations to provide comprehensive pollution data.
Integration with National Air Quality Reporting
Data collected by CAAQMS stations is transmitted to centralized environmental monitoring systems operated by the Central Pollution Control Board. These systems process the information and calculate the Air Quality Index (AQI) for different cities.
The AQI converts complex pollution measurements into a simplified scale that allows the public to understand air quality conditions quickly.
Real-time air quality information is shared through government websites and public information platforms. This transparency allows citizens, researchers, and policymakers to track pollution trends and identify high-pollution periods.
Role in National Air Pollution Control Programs
Continuous monitoring networks also support national air pollution control initiatives such as the National Clean Air Programme. These programs aim to reduce pollution levels in major cities by improving emission controls and strengthening environmental regulations.
Monitoring data helps authorities:
- evaluate the effectiveness of pollution control policies
- identify pollution hotspots within cities
- track long-term air quality trends
Without reliable monitoring networks, it would be difficult to measure whether pollution reduction strategies are working.
How CAAQMS Data Is Used to Calculate AQI
Continuous monitoring stations measure pollutant concentrations throughout the day, but these measurements must be converted into a simplified indicator that the public can understand. This is done through the Air Quality Index (AQI) system used for air quality reporting in India.
Monitoring stations record hourly concentrations of major pollutants such as PM₂.₅, PM₁₀, nitrogen dioxide, sulfur dioxide, ozone, carbon monoxide, and ammonia. These measurements are processed using formulas defined by the Central Pollution Control Board to convert pollutant concentrations into AQI sub-indices.
Each pollutant receives its own sub-index value based on its concentration.
The pollutant with the highest sub-index determines the final AQI value reported for a location.
For example:
- High PM₂.₅ levels may produce the highest sub-index
- That value becomes the overall AQI for the city
This method ensures that the pollutant posing the greatest health risk is reflected in the final air quality category.
The AQI scale in India ranges from Good to Severe, helping citizens quickly understand pollution levels and potential health risks. Continuous monitoring stations provide the real-time data required to update AQI values regularly.
Limitations of Continuous Air Quality Monitoring Systems
Although Continuous Ambient Air Quality Monitoring Systems provide valuable real-time data, they also have several limitations. Understanding these limitations is important when interpreting air quality measurements and assessing how representative the data is for an entire city or region.
High Installation and Maintenance Costs
One major limitation of CAAQMS stations is their high cost. Setting up a continuous monitoring station requires specialized analyzers, meteorological instruments, data acquisition systems, and communication infrastructure.
In addition to installation costs, these systems also require:
- regular calibration
- instrument maintenance
- replacement of filters and components
- trained technical staff
Because of these requirements, many regions cannot install large numbers of monitoring stations, which limits the spatial coverage of continuous monitoring networks.
Limited Geographic Coverage
Even in cities with multiple monitoring stations, the number of stations is usually small compared to the total urban area. This means that measurements from a single monitoring station may not represent pollution conditions everywhere in the city.
Air pollution can vary significantly across short distances due to localized emission sources such as traffic intersections, construction sites, and industrial facilities. As a result, monitoring networks may not always capture localized pollution hotspots.
To improve coverage, researchers often combine ground monitoring data with satellite observations and air quality models.
Because ground monitoring stations are limited in number, researchers often combine monitoring data with satellite observations to analyze pollution patterns across larger regions. This approach is discussed in Satellite Monitoring of Air Pollution: How Space-Based Sensors Track Pollutants.
Calibration and Data Quality Challenges
Accurate pollution measurements depend on proper instrument calibration and maintenance. If analyzers are not calibrated regularly, measurement errors can occur.
Monitoring agencies perform routine quality assurance procedures to ensure that data remains reliable. However, technical issues such as instrument malfunction, power interruptions, or communication failures can occasionally affect monitoring stations.
Environmental agencies such as the Central Pollution Control Board use standardized protocols to maintain data quality across the national monitoring network.
Difficulty Monitoring Rural and Remote Areas
Continuous monitoring stations are more commonly installed in large cities and industrial areas where pollution levels are highest. Rural regions and smaller towns often have fewer monitoring stations because of infrastructure and cost constraints.
As a result, air pollution data from rural areas may be limited, making it difficult to assess pollution exposure in these regions.
Expanding monitoring coverage to rural areas is an important goal for improving national air quality assessment.
Conclusion: Why Real-Time Air Quality Monitoring Matters
Continuous Ambient Air Quality Monitoring Systems have become an essential component of modern air quality management and environmental policy. By measuring pollutants continuously and transmitting data in near real time, these systems provide valuable insights into how air quality changes throughout the day.
The data collected by monitoring networks helps scientists study pollution trends, allows policymakers to evaluate environmental regulations, and enables governments to issue timely public health advisories. Continuous monitoring also supports the calculation of the Air Quality Index, which helps the public understand local air pollution conditions.
In India, monitoring networks operated by agencies such as the Central Pollution Control Board and State Pollution Control Boards play a central role in tracking pollution levels in major cities and industrial regions.
Although these systems have limitations, including high costs and limited spatial coverage, they remain one of the most reliable tools available for measuring ambient air pollution. As monitoring networks expand and technologies improve, real-time air quality monitoring will continue to play an increasingly important role in environmental research, policy development, and public health protection.
Understanding how CAAQMS systems work also helps citizens interpret AQI data more accurately and make informed decisions about exposure to air pollution in daily life.
Frequently Asked Questions (FAQs)
What is a Continuous Ambient Air Quality Monitoring System (CAAQMS)?
A Continuous Ambient Air Quality Monitoring System (CAAQMS) is an automated monitoring station that continuously measures air pollutants such as particulate matter (PM₂.₅ and PM₁₀), nitrogen dioxide (NO₂), sulfur dioxide (SO₂), ozone (O₃), and carbon monoxide (CO). These systems operate 24 hours a day and transmit real-time air quality data to environmental monitoring networks.
In India, many CAAQMS stations are operated by the Central Pollution Control Board and State Pollution Control Boards.
How does a CAAQMS monitoring station work?
A CAAQMS station draws ambient air into specialized analyzers that measure pollutant concentrations using different scientific techniques. For example, particulate matter is measured using particle mass analyzers, while gases such as nitrogen dioxide and sulfur dioxide are measured using optical or chemical detection methods.
The monitoring instruments record pollutant concentrations continuously and transmit the data to central servers where it is analyzed and used to calculate air quality indicators.
Which pollutants are monitored in CAAQMS stations?
Air pollution monitoring stations measure pollutants such as PM2.5 and nitrogen dioxide:
- PM₂.₅ (fine particulate matter)
- PM₁₀ (coarse particulate matter)
- Nitrogen dioxide (NO₂)
- Sulfur dioxide (SO₂)
- Ozone (O₃)
- Carbon monoxide (CO)
- Ammonia (NH₃)
These pollutants are known as criteria pollutants because they are used to evaluate ambient air quality and health risks.
How often is air quality data updated in CAAQMS systems?
Continuous monitoring stations measure pollutant concentrations at regular intervals, often every few minutes. The collected data is typically averaged over one-hour periods before being reported publicly.
These measurements are then used to update the Air Quality Index (AQI), which provides a simplified representation of air pollution levels for the public.
Why are continuous air quality monitoring systems important?
Continuous monitoring systems provide detailed information about how air pollution changes throughout the day. This information helps environmental agencies detect pollution spikes, monitor emission sources, and evaluate pollution control policies.
Real-time monitoring also allows authorities to issue public health advisories when pollution levels become hazardous.
Are CAAQMS stations installed in every city?
No. Continuous monitoring stations are usually installed in major cities and industrial regions where pollution levels are highest. Because these stations are expensive to install and maintain, many smaller towns and rural areas have fewer monitoring stations.
Environmental agencies are gradually expanding monitoring networks to improve coverage across different regions.
How accurate are CAAQMS measurements?
CAAQMS stations use highly sensitive scientific instruments that are designed to measure pollutants with high precision. However, accurate measurements require regular calibration and maintenance.
Environmental agencies follow standardized quality assurance procedures to ensure that monitoring data remains reliable and scientifically valid.
References
Central Pollution Control Board – National Ambient Air Quality Monitoring Programme (NAMP)
The national monitoring program coordinated by the CPCB that tracks air pollution levels across Indian cities.
CPCB Guidelines and Technical Specifications for Continuous Ambient Air Quality Monitoring Stations
Technical guidance documents describing installation, calibration, and operation of real-time air quality monitoring stations.
CPCB Protocol for Data Communication from Continuous Ambient Air Quality Monitoring Systems
Official protocol describing how monitoring stations transmit pollution data to central air quality monitoring networks.
Continuous Ambient Air Quality Monitoring System (CAAQMS) Overview
Explanation of how CAAQMS stations measure pollutants such as PM₂.₅, PM₁₀, NO₂, SO₂, CO, and O₃ and transmit real-time data.
Chemiluminescence Method for Measuring Nitrogen Oxides in Air Monitoring Systems
Technical explanation of chemiluminescence analyzers used to measure nitrogen oxides in ambient air monitoring stations.
Ambient Air Quality Monitoring Technologies and Measurement Methods
Overview of monitoring instruments such as BAM, TEOM, UV fluorescence, and infrared analyzers used in air quality monitoring stations.
Principles of Continuous Ambient Air Quality Monitoring Systems (CSE India)
Explanation of how continuous monitoring systems collect, analyze, and report air pollution data in real time.
Optional (Academic / Technical Sources)
These add credibility if you want a more research-oriented article.
Chemiluminescent Measurement of Nitrogen Oxides in Air Monitoring Systems
PubMed: https://pubmed.ncbi.nlm.nih.gov/2256545/
Thermo Fisher Scientific – TEOM Particulate Monitoring Technology
https://www.thermofisher.com/in/en/home/industrial/environmental/air-quality-analysis/ambient-gas-monitoring/technologies.html
- Continuous Ambient Air Quality Monitoring Systems (CAAQMS) in India: How Real-Time Air Quality Monitoring Works - March 17, 2026
- Air Pollution Monitoring Stations: How Sensors Measure Air Pollutants - March 12, 2026
- Vehicular Emissions in Indian Cities: How Traffic Causes Air Pollution - February 14, 2026