
Introduction
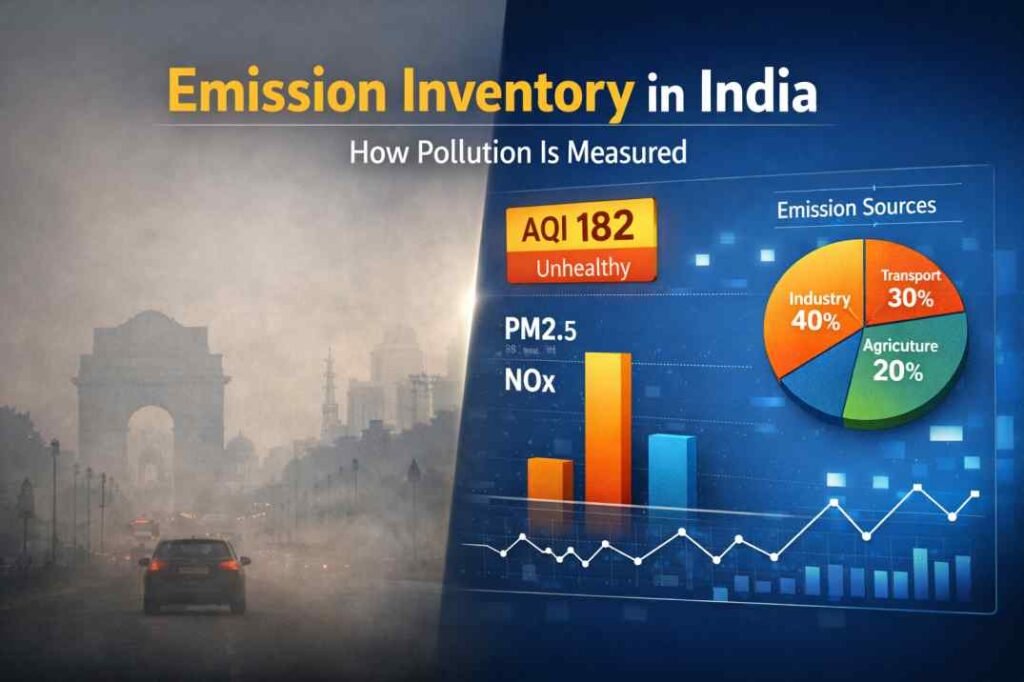
Emission inventory in India is a key tool used to understand how air pollution is generated from different sources across cities and regions.
Air pollution in Indian cities is often discussed in terms of AQI levels and pollutant concentrations. However, to control pollution effectively, it is equally important to understand where that pollution comes from and how much is being released into the atmosphere.
This is where emission inventories play a critical role.
An emission inventory is a systematic method used to estimate the amount of pollutants released from different sources such as vehicles, industries, power plants, and residential fuel use. Unlike air pollution monitoring stations, which measure pollutant concentrations in the air, emission inventories focus on quantifying emissions at their source.
In India, emission inventories are used by agencies like the Central Pollution Control Board (CPCB) and under programs such as the National Clean Air Programme (NCAP) to identify major pollution sources and design targeted control strategies.
This article explains:
- what an emission inventory is
- how emissions are estimated step by step
- the major sources of emissions in India
- and how emission data is used alongside monitoring systems to manage air pollution
To understand how pollution is measured in real time, see our guide on air pollution monitoring systems.
What Is an Emission Inventory?
Simple Definition
An emission inventory is a method to estimate the amount of air pollution released from sources such as vehicles, industries, and households over a specific period of time.
It answers a key question: Where is air pollution coming from?
In India, agencies such as the Central Pollution Control Board (CPCB) use emission inventories to identify pollution sources and develop control strategies.
They form the foundation of air quality management by linking pollution levels to their sources.
An emission inventory is a structured approach for estimating the total amount of air pollutants released from different sources over a specific period of time.
Unlike monitoring systems that measure pollution already present in the ambient air, an emission inventory focuses on quantifying emissions at their source—such as vehicles on roads, fuel burned in households, or coal used in power plants.
These pollutants are estimated across different sectors to understand overall emission patterns.
Emission inventories typically include major air pollutants such as:
- Particulate matter (PM2.5 and PM10)
- Nitrogen oxides (NOₓ)
- Sulfur dioxide (SO₂)
- Carbon monoxide (CO)
- Volatile organic compounds (VOCs)
These estimates are calculated using activity data (for example, how much fuel is used or how many vehicles are operating) combined with scientifically established emission factors.
Key Idea
- Emission inventory → how much pollution is emitted
- Monitoring systems → how much pollution is present in the air
This distinction is important for understanding how air pollution is managed in practice.
In India, emission inventories are developed at national, state, and city levels to support air quality management and policy planning.
Why Emission Inventories Are Important
Emission inventories are essential for understanding and managing air pollution because they explain where pollution is coming from, not just how much is present in the air.
Without this information, it is difficult to design effective pollution control strategies.
Identifying Major Pollution Sources
Emission inventories help determine which sectors contribute the most to pollution, such as:
- transport (vehicles)
- industry
- power generation
- residential fuel use
This allows policymakers to focus on the most impactful sources.
Supporting Air Pollution Control Policies
In India, emission inventory data is used to design and implement programs like the National Clean Air Programme (NCAP).
Authorities use this data to:
- prioritize interventions
- set reduction targets
- monitor progress over time
Complementing Monitoring Data
Air pollution monitoring stations measure pollutant concentrations in the air, but they do not explain the source of pollution.
Emission inventories fill this gap by linking pollution levels to specific emission sources.
Key insight:
Monitoring tells you what the air quality is
Emission inventory tells you why it is that way
Enabling City-Level Action Plans
Many Indian cities develop action plans based on emission inventories to:
- identify pollution hotspots
- implement sector-specific controls
- evaluate the effectiveness of interventions
Emission inventories are therefore a critical tool for moving from measurement to action in air pollution management.
Real-World Example (India)
In cities like Delhi, emission inventory studies have shown that transport, industry, and regional biomass burning contribute significantly to PM2.5 levels, with contributions varying by season.
This is why city-specific emission inventories are essential—pollution sources are not the same everywhere.
How Emission Inventory Works (Step-by-Step)
Emission inventories are built using a systematic process that converts real-world activities into estimated pollutant emissions.
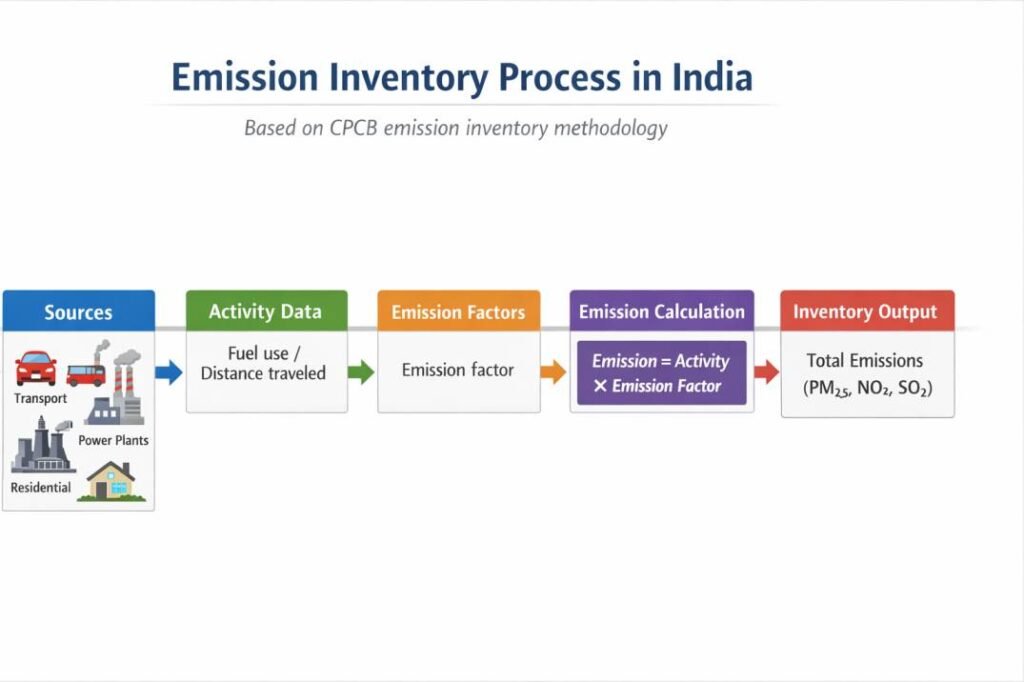
Step 1 — Identify Emission Sources
The first step is to identify all major sources of air pollution within a region.
These typically include:
- transport (cars, trucks, two-wheelers)
- industries and manufacturing units
- power plants
- residential fuel use (biomass, LPG, coal)
- agriculture (crop residue burning, machinery)
The goal is to ensure no major emission source is missed.
Step 2 — Collect Activity Data
Once sources are identified, data is collected to quantify how much activity is taking place.
Examples include:
- total fuel consumed (petrol, diesel, coal)
- number of vehicles and distance traveled
- industrial production levels
- number of households using different fuels
This is called activity data, and it forms the foundation of emission estimation.
Step 3 — Apply Emission Factors
Emission factors represent the amount of pollution released per unit of activity.
Examples:
- grams of PM2.5 emitted per kilometer by a vehicle
- SO₂ emitted per ton of coal burned
These factors are developed through scientific studies and standardized guidelines.
Step 4 — Calculate Total Emissions
Emissions are calculated using a simple relationship:
👉 Emission = Activity × Emission Factor
For example:
- If a vehicle travels more kilometers, total emissions increase
- If cleaner fuel is used, emission factors decrease
Key Formula
Emission = Activity Data × Emission Factor
- Activity data = how much fuel is used / distance traveled
- Emission factor = pollution released per unit activity
This relationship is the foundation of all emission inventories.
Step 5 — Spatial Distribution of Emissions
Emissions are then mapped across different locations within a city or region.
This helps identify:
- high-emission zones
- industrial clusters
- traffic corridors
Step 6 — Temporal Distribution of Emissions
Emission inventories also consider how emissions vary over time:
- hourly (traffic peaks)
- seasonal (winter pollution spikes)
- episodic (crop burning events)
This step-by-step process converts real-world human activities into quantifiable emission data, which can be used for analysis, planning, and policy-making.
Major Sources of Emissions in India
Emission inventories categorize pollution sources into broad sectors to understand how different activities contribute to total emissions. In India, the relative contribution of each source can vary significantly between cities depending on geography, economy, and fuel use patterns.
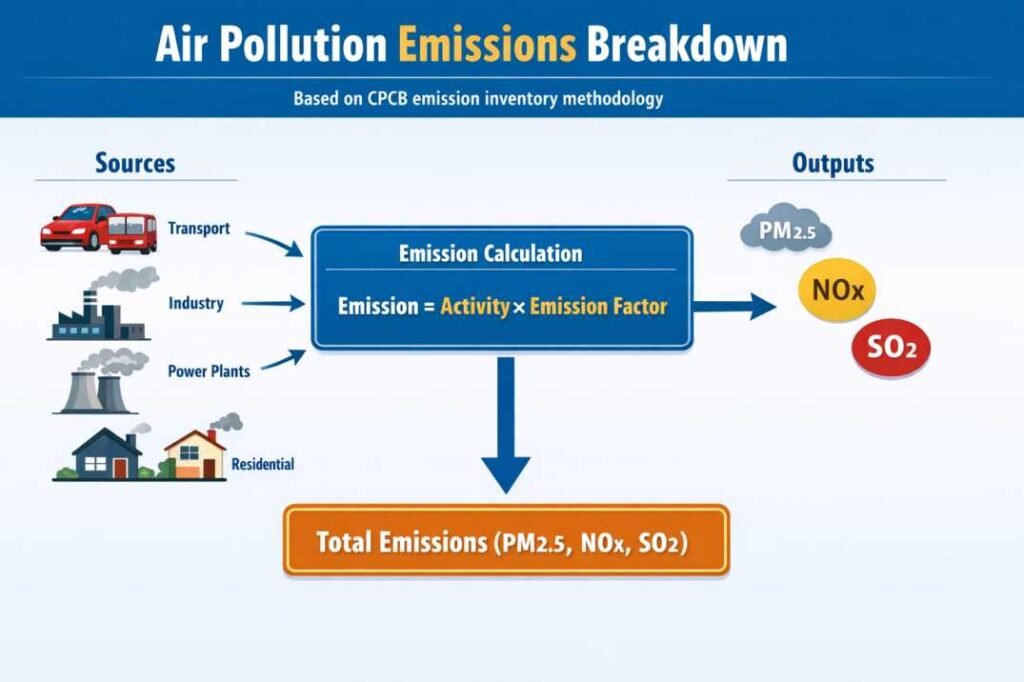
Transport Sector
The transport sector is a major source of:
- PM2.5
- nitrogen oxides (NOₓ)
- carbon monoxide (CO)
Emissions come from:
- cars, buses, trucks
- two-wheelers
- diesel vehicles in urban traffic
High traffic density and congestion increase emissions, especially in large cities like Delhi and Mumbai.
Industrial Sector
Industries contribute significantly to:
- SO₂
- NOₓ
- particulate matter
Major sources include:
- manufacturing units
- cement plants
- steel industries
- small-scale industries
Industrial emissions are often concentrated in specific zones, creating localized pollution hotspots.
Power Plants
Coal-based power plants are among the largest contributors to:
- sulfur dioxide (SO₂)
- particulate matter
These emissions can affect air quality over large regions due to long-range transport.
Residential Sector
Household fuel use contributes to emissions through:
- biomass burning (wood, dung, crop waste)
- coal use in some regions
This sector is particularly important in peri-urban and rural areas, and it significantly contributes to PM2.5 emissions.
Agricultural Activities
Agriculture contributes to air pollution through:
- crop residue burning
- use of machinery and fertilizers
Seasonal burning events, especially in North India, can cause sharp increases in pollution levels.
Key insight:
There is no single dominant source across all Indian cities—source contribution depends on local conditions and activities.
This sector-wise breakdown helps emission inventories identify which sources should be targeted first for effective pollution control.
Which Sources Dominate in Indian Cities?
The contribution of different sources varies significantly across cities.
Example Source Contribution (PM2.5 in Indian Cities)
| Sector | Contribution Range |
|---|---|
| Transport | 25–40% |
| Industry | 20–30% |
| Residential | 10–25% |
| Agriculture | 5–20% |
Note: These values are indicative and vary across cities depending on local conditions, season, and economic activity.
- In Delhi, transport and regional biomass burning often dominate PM2.5 levels
- In industrial regions, emissions from factories and power plants may be higher
- In smaller towns, residential fuel use can be a major contributor
👉 This variation is why emission inventories are developed at the city level rather than relying on national averages.
To understand these categories in detail, see our guide on sources of air pollution in India.
Emission Inventory vs Monitoring Data
Emission inventories and real-time air quality monitoring systems are both essential, but they serve different purposes in understanding air pollution.
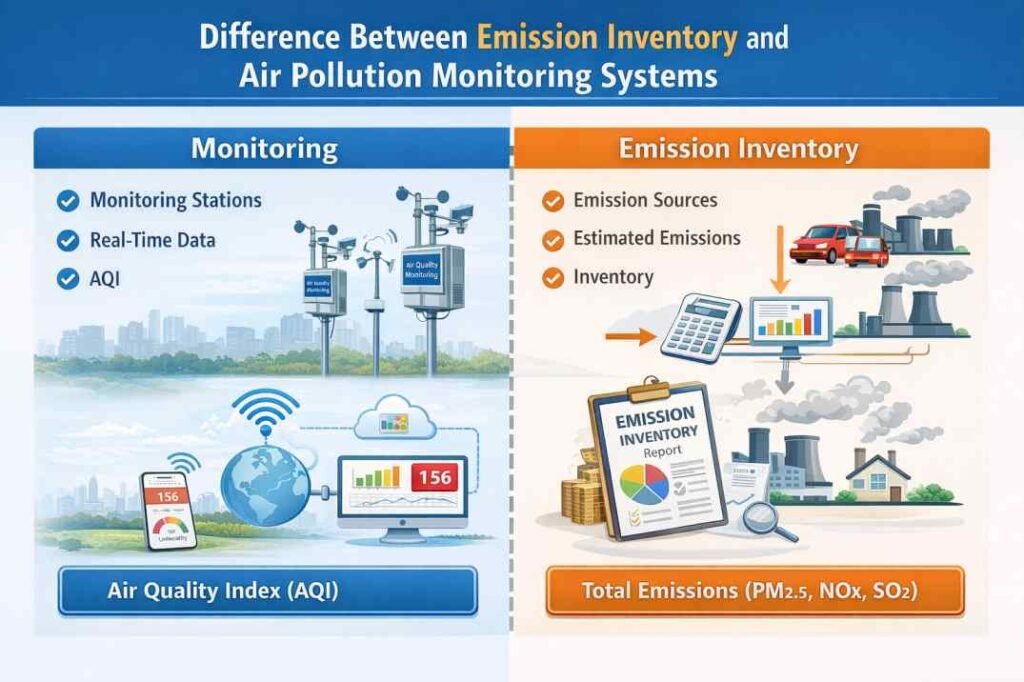
What Monitoring Systems Do
Air pollution monitoring stations measure the actual concentration of pollutants present in the air at a specific location and time.
They provide:
- real-time or periodic data
- pollutant levels (PM2.5, NO₂, SO₂, etc.)
- inputs for calculating AQI
👉 Monitoring answers:
“What is the current air quality?”
What Emission Inventories Do
Emission inventories estimate the amount of pollutants being released from different sources.
They provide:
- source-wise emission data
- sector contributions
- inputs for planning and policy
👉 Emission inventory answers:
“Where is the pollution coming from?”
Key Differences
| Aspect | Monitoring Systems | Emission Inventory |
|---|---|---|
| Measures | Pollutant concentration in air | Pollutant emissions from sources |
| Data type | Real-time or observed | Estimated or modeled |
| Purpose | AQI and public reporting | Source identification and planning |
| Use case | Health advisories | Policy and control strategies |
Why Both Are Needed
Monitoring data alone cannot identify the exact source of pollution.
Emission inventories alone cannot reflect real-time air quality conditions.
👉 Together:
- Monitoring shows current pollution levels
- Emission inventory explains why those levels occur
This combined approach is essential for effective air pollution management in India.
Who Prepares Emission Inventories in India?
Emission inventories in India are developed by a combination of government agencies, research institutions, and international organizations. These inventories are prepared at national, state, and city levels depending on the purpose and scale of analysis.
Central Pollution Control Board (CPCB)
The Central Pollution Control Board plays a key role in:
- developing national-level emission estimates
- providing guidelines and methodologies
- supporting city-level air quality planning
CPCB also works with state agencies to standardize emission inventory approaches across India.
State Pollution Control Boards (SPCBs)
State Pollution Control Boards are responsible for:
- preparing state and city-level emission inventories
- collecting local activity data
- supporting implementation of pollution control measures
These inventories are often used in city-specific action plans.
Research Institutions and Academic Organizations
Institutions such as:
- IITs
- NEERI (National Environmental Engineering Research Institute)
contribute by:
- developing emission factors
- conducting detailed sectoral studies
- improving estimation methodologies
International Agencies
Organizations like:
- World Bank
- UNEP
- other global research bodies
support emission inventory development through:
- technical assistance
- modeling tools
- funding and capacity building
Role in National Programs
Emission inventories are widely used in:
- National Clean Air Programme (NCAP)
- city air quality management plans
They help policymakers design targeted interventions based on source contribution.
Emission inventories are therefore the result of collaborative scientific and institutional efforts, combining data, modeling, and policy needs.
Limitations of Emission Inventories
While emission inventories are essential for understanding pollution sources, they also have important limitations that must be considered when interpreting their results.
Dependence on Assumptions and Estimates
Emission inventories are not direct measurements. They rely on:
- activity data (e.g., fuel use, vehicle movement)
- emission factors
If these inputs are inaccurate or outdated, the final estimates can be affected.
For example, fuel consumption data or vehicle usage patterns may not always reflect real-world conditions in rapidly growing Indian cities.
Data Gaps and Uncertainty
In many parts of India, especially in informal or unregulated sectors, reliable data may be limited.
Examples:
- small-scale industries
- unregistered vehicles
- household fuel use patterns
These gaps introduce uncertainty and can lead to underestimation or overestimation of emissions.
Variability in Emission Factors
Emission factors can vary depending on:
- technology used
- fuel quality
- maintenance conditions
In India, real-world emissions often differ from standard values due to factors such as traffic congestion, aging vehicles, and variable fuel quality.
As a result, generalized emission factors may not fully capture actual on-ground conditions.
Limited Real-Time Capability
Emission inventories are typically developed for:
- annual estimates
- seasonal assessments
They do not provide real-time information like air quality monitoring systems, and therefore cannot capture short-term pollution spikes such as winter smog events or crop burning episodes.
Challenges in Spatial Accuracy
Distributing emissions accurately across different locations can be complex, especially in densely populated or rapidly changing urban areas.
Factors such as mixed land use, informal settlements, and dynamic traffic patterns make precise spatial mapping difficult.
👉 Key insight:
Emission inventories are powerful tools for understanding pollution sources and long-term trends, but they are not exact representations of real-time conditions.
👉 They should always be used alongside air quality monitoring data for a complete and accurate understanding of air pollution.
Understanding these limitations is essential for interpreting emission data correctly and using it effectively in air quality planning and policy decisions.
How Emission Inventories Are Used in Policy
Emission inventories are a key input for designing and implementing air pollution control strategies in India. They help translate scientific data into actionable policy decisions.
Supporting the National Clean Air Programme (NCAP)
Under the National Clean Air Programme, emission inventories are used to:
- identify dominant pollution sources in each city
- set sector-specific reduction targets
- prioritize interventions based on source contribution
Designing City Action Plans
Many Indian cities prepare air quality management plans using emission inventory data.
These plans focus on:
- controlling high-emission sectors
- targeting pollution hotspots
- implementing localized measures such as traffic management or industrial regulation
Evaluating Policy Effectiveness
Emission inventories allow authorities to:
- compare emissions over time
- assess whether interventions are reducing pollution
- update strategies based on new data
Supporting Regulatory Decisions
Policymakers use emission inventory data to:
- design emission standards
- regulate industrial activities
- plan transitions to cleaner fuels and technologies
Integrating with Monitoring Data
Emission inventories are often used together with monitoring data to:
- validate trends
- improve air quality models
- strengthen decision-making
👉 Key takeaway:
Emission inventories enable authorities to move from understanding pollution sources to implementing targeted solutions.
In Short
- Emission inventory estimates how much pollution is released
- Monitoring systems measure pollution present in the air
- Emission = Activity × Emission Factor
- Source contribution varies across Indian cities
- Both systems are essential for air pollution management
Conclusion
Emission inventories play a crucial role in air pollution management by estimating how much pollution is released from different sources. While monitoring systems measure pollutant concentrations in the air, emission inventories provide insight into where that pollution originates.
Together, these systems form the foundation of air quality management in India—linking data, science, and policy.
Understanding emission inventories is essential not only for researchers and policymakers, but also for anyone trying to understand how air pollution is controlled in real-world conditions.
👉 In the next article, we will explore how AQI is calculated in India, which converts these measurements and estimates into a simple air quality index used by the public.
Frequently Asked Questions (FAQs)
What is an emission inventory?
An emission inventory is a method used to estimate how much pollution is released from different sources like vehicles, industries, and households.
How are emissions calculated?
Emissions are calculated using the formula:
Emission = Activity Data × Emission Factor
Why is emission inventory important in India?
It helps identify major pollution sources and supports policies like the National Clean Air Programme (NCAP).
What is the difference between emission inventory and AQI?
Emission inventory estimates pollution at the source, while AQI shows the current air quality based on measured pollutant concentrations.
Sources and References
This article is based on publicly available methodologies, reports, and research from the following authoritative sources:
– Central Pollution Control Board (CPCB) – Emission Inventory Reports and Guidelines
https://cpcb.nic.in/emission-inventory/
– National Clean Air Programme (NCAP), Ministry of Environment, Forest and Climate Change (MoEFCC)
https://moef.gov.in/en/air-pollution/national-clean-air-programme-ncap/
– CPCB – National Air Quality Monitoring Programme (NAMP)
https://cpcb.nic.in/national-air-quality-monitoring-programme/
– IIT Kanpur – Comprehensive Study on Air Pollution and Greenhouse Gases in Delhi
https://www.iitk.ac.in/erl/Downloads/Reports/Delhi_Report.pdf
– TERI (The Energy and Resources Institute) – Air Pollution Studies in India
https://www.teriin.org/projects/air-pollution
– National Environmental Engineering Research Institute (NEERI)
https://www.neeri.res.in/
– World Bank – Air Pollution and Health in South Asia
https://www.worldbank.org/en/topic/environment/publication/south-asia-air-pollution
– UNEP – Air Quality Policies and Emission Inventories
https://www.unep.org/explore-topics/air
- Health Effects of Air Pollution: Short-Term and Long-Term Impacts - March 24, 2026
- What AQI Numbers Mean in India (AQI Chart + Health Effects Guide) - March 22, 2026
- Emission Inventory in India: How Pollution Sources Are Measured (Complete Guide) - March 21, 2026