
Introduction
The most polluted cities in India consistently record much higher concentrations of harmful pollutants than others. Urban areas such as Delhi, Ghaziabad, Noida, and Kanpur frequently report the highest PM2.5 levels due to a combination of emissions, weather conditions, and geographic factors.
These rankings of the most polluted cities in India are usually based on measurements of fine particulate matter (PM2.5) and the Air Quality Index (AQI), which are used to assess how polluted the air is at a given time.
Understanding which cities have the worst air pollution requires more than just looking at rankings. It involves examining how pollution is measured, why certain regions are more affected, and how factors like weather, urban activity, and monitoring systems influence reported values.
This article explains which Indian cities are most affected by air pollution, why these patterns occur, and how to interpret pollution data in a meaningful way.
This article is based on analysis of CPCB monitoring data and publicly available air quality reports in India.
Most Polluted Cities in India
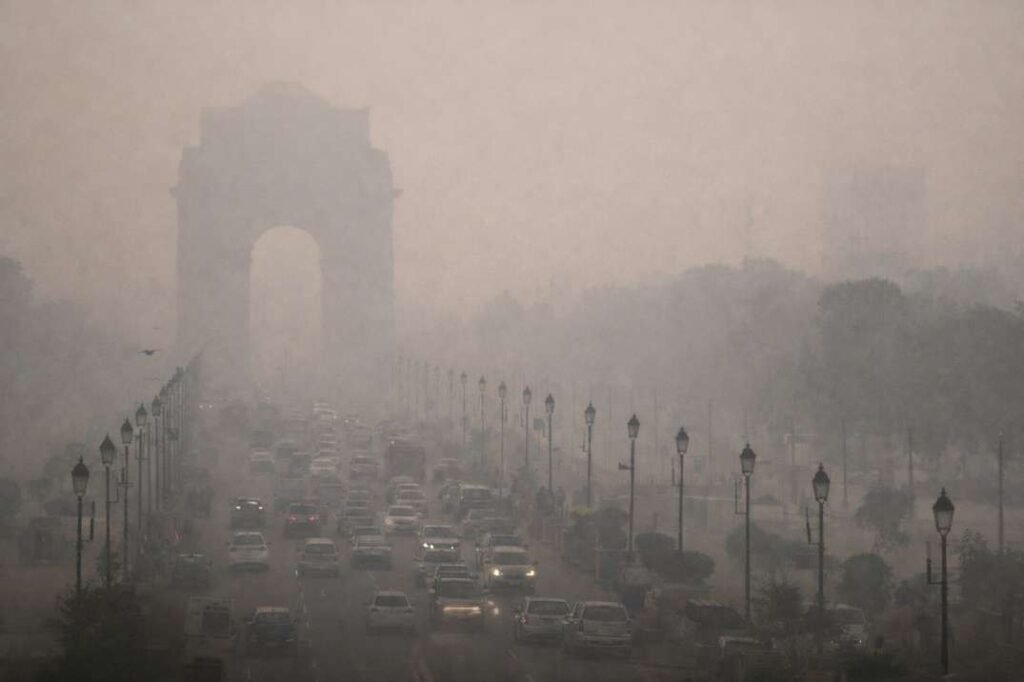
The most polluted cities in India are mainly located in the Indo-Gangetic Plain, including Delhi, Ghaziabad, Noida, Kanpur, and Patna. These cities frequently record the highest PM2.5 levels due to traffic, industry, construction activity, and seasonal weather conditions.
These most polluted cities in India experience high pollution due to a combination of factors, including dense population, traffic emissions, industrial activity, construction dust, and seasonal conditions like winter inversion, which traps pollutants close to the ground.
However, it is important to note that pollution rankings can change depending on the time of year, weather conditions, and the type of measurement used. Some cities may rank higher during winter, while others may show lower levels during monsoon months when rainfall helps clear pollutants from the air.
To understand how pollution levels are classified, see AQI explained in India.
How Air Pollution in Cities Is Measured
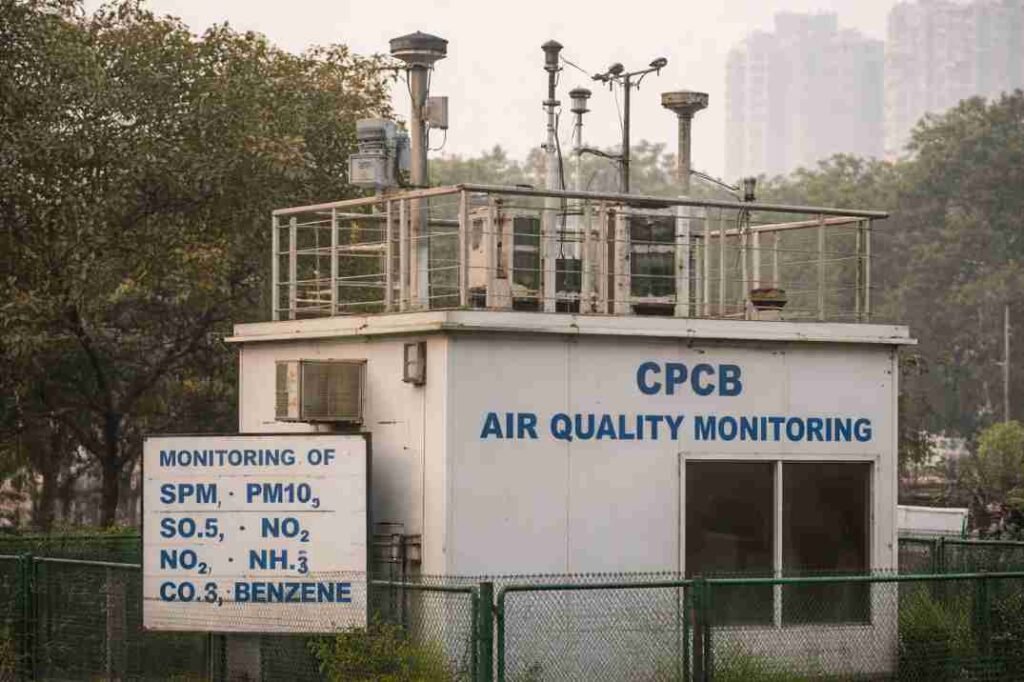
Air pollution levels in Indian cities are measured using a combination of pollutant concentrations and standardized indices. The most important pollutants tracked in urban areas include fine particulate matter (PM2.5), coarse particles (PM10), nitrogen dioxide (NO₂), and sulfur dioxide (SO₂).
Among these, PM2.5 is considered the most important indicator because these fine particles can penetrate deep into the lungs and are strongly associated with health risks. A detailed explanation is available in PM2.5 explained in India.
To make this data easier to understand, pollutant concentrations are converted into the Air Quality Index (AQI), which categorizes air quality into levels such as “Good,” “Moderate,” “Poor,” and “Severe.” This allows the public to quickly interpret how polluted the air is at a given time. For a full breakdown, see AQI explained in India.
Monitoring is carried out through a network of stations operated by agencies such as the Central Pollution Control Board (CPCB) and State Pollution Control Boards. These stations collect real-time and long-term data, which is used to assess pollution trends across cities.
However, it is important to understand that measurements can vary depending on:
- Number of monitoring stations
- Location of sensors within a city
- Time of day and season
This means that pollution data reflects measured conditions rather than exact exposure for every individual across a city.
Air Pollution Across Major Indian Cities
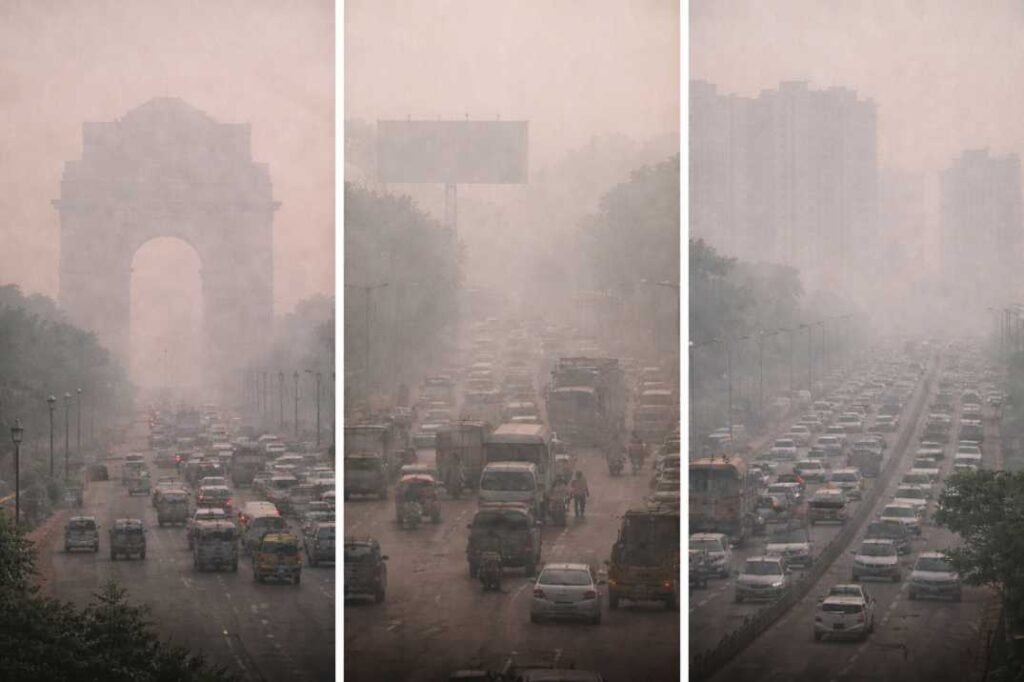
Air pollution levels in India are often highest in cities located in the northern region, particularly within the Indo-Gangetic Plain. These cities frequently record elevated PM2.5 concentrations due to a mix of urban emissions, industrial activity, and seasonal weather patterns.
While rankings may change depending on the data source and time period, certain cities consistently appear among the most polluted.
Commonly Reported Highly Polluted Cities
| City | Key Sources | Dominant Pollutant | Seasonal Peak |
|---|---|---|---|
| Delhi | Traffic, construction | PM2.5 | Winter |
| Ghaziabad | Industry | PM2.5 | Winter |
| Noida | Dust, traffic | PM10/PM2.5 | Winter |
| Kanpur | Industry | Mixed | Winter |
| Patna | Biomass burning | PM2.5 | Winter |
Recent Air Pollution Data (India Context)
According to recent air quality observations, several North Indian cities continue to record high PM2.5 levels, especially during winter months.
- Delhi often records winter AQI levels in the “Very Poor” to “Severe” (300–500) range
- Annual PM2.5 levels in major cities frequently exceed WHO guidelines by multiple times
- Indo-Gangetic Plain cities consistently report higher averages compared to southern regions
These values vary by season and year, but they highlight the scale of urban air pollution exposure in India.
These observations are based on CPCB monitoring data and publicly available air quality reports.
Key Observations
- Northern cities dominate pollution rankings due to geographic and climatic conditions.
- PM2.5 is the primary pollutant driving high pollution levels in most cities.
- Urban growth and construction activity significantly contribute to particulate matter.
- Industrial and transport emissions remain major sources across multiple cities.
Important Note
These cities are not permanently the most polluted. Rankings can change based on:
- Seasonal variations (especially winter vs monsoon)
- Weather conditions (wind, temperature, rainfall)
- Differences in monitoring infrastructure
This means pollution levels should be understood as trends over time, not fixed rankings.
Live Air Quality in Indian Cities
Air pollution levels change throughout the day depending on weather conditions, traffic, and local emissions. To check real-time air quality across Indian cities, refer to the official Central Pollution Control Board (CPCB) dashboard:
👉 https://airquality.cpcb.gov.in/AQI_India/
Why These Cities Have High Pollution Levels
Air pollution in Indian cities is not caused by a single factor. Instead, it results from a combination of geographic conditions, emission sources, and seasonal patterns that interact over time.
1. Geographic Location (Indo-Gangetic Plain)
Many of the most polluted cities are located in the Indo-Gangetic Plain, a region with:
- Low wind speeds
- Landlocked geography
- High population density
These conditions limit the dispersion of pollutants, allowing particulate matter to accumulate over urban areas.
2. Weather and Seasonal Conditions
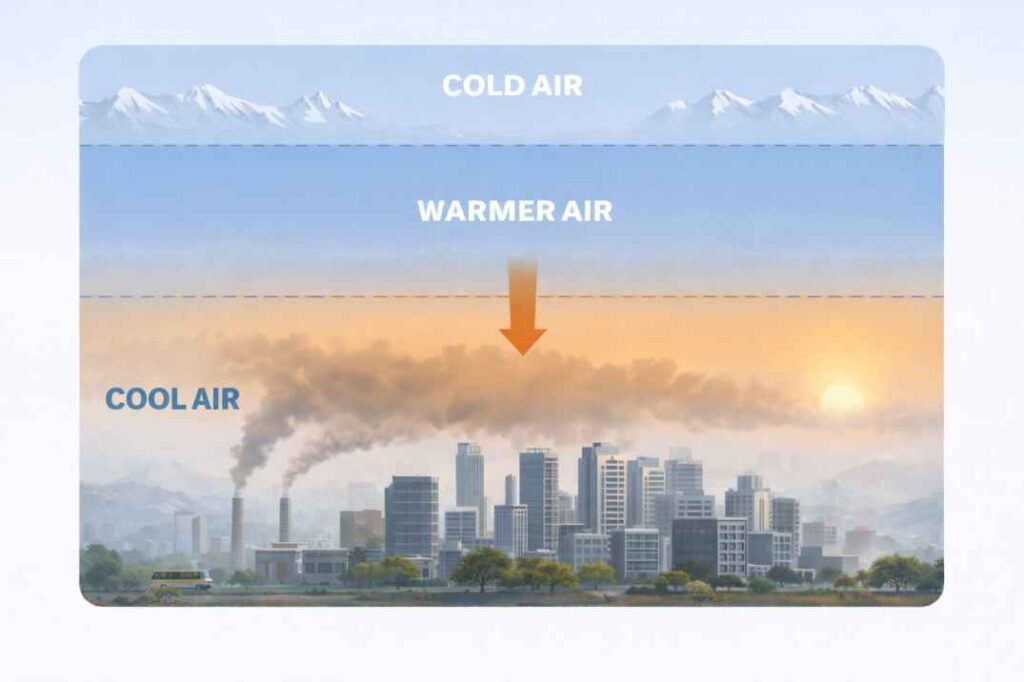
Seasonal changes play a major role in pollution levels:
- Winter inversion traps pollutants close to the ground
- Low temperatures and calm winds reduce dispersion
- Monsoon rains help wash pollutants out of the air
This is why cities like Delhi often experience severe pollution spikes during winter months.
3. Major Emission Sources
Urban air pollution comes from multiple sources, including:
- Vehicle emissions (cars, trucks, two-wheelers)
- Industrial activities
- Construction dust
- Biomass and waste burning
A detailed breakdown of these contributors is available in sources of air pollution in India.
4. Rapid Urbanization
Fast-growing cities experience:
- Increased traffic congestion
- Ongoing construction
- Higher energy demand
These factors contribute to sustained increases in particulate matter levels.
5. Regional Pollution Transport
Pollution is not always local. In northern India:
- Agricultural residue burning in nearby regions
- Industrial emissions from surrounding areas
can travel long distances and affect city air quality.
Key Takeaway
High pollution levels in Indian cities are driven by a combination of local emissions, regional factors, and weather conditions, rather than a single source.
Why Pollution Levels Change Throughout the Year
Air pollution levels in Indian cities are not constant. They change significantly throughout the year due to seasonal weather patterns and human activities.
1. Winter: Highest Pollution Levels
Winter is the most polluted season in many Indian cities due to temperature inversion and low wind speeds.
During winter months (November to January), many cities experience:
- Temperature inversion, which traps pollutants near the ground
- Low wind speeds, reducing dispersion
- Increased emissions from heating and burning
In northern India, additional factors such as crop residue burning further increase pollution levels.
👉 This is why cities like Delhi often reach “Severe” AQI levels during winter.
2. Summer: Moderate Pollution
In summer:
- Higher temperatures improve air movement
- Stronger winds help disperse pollutants
As a result, pollution levels usually decrease compared to winter, though they may still remain above safe limits.
3. Monsoon: Lowest Pollution Levels
During the monsoon season:
- Rainfall helps wash pollutants out of the air
- Air quality often improves significantly
This period typically records the lowest pollution levels in many Indian cities.
4. Short-Term Fluctuations
Air pollution can also vary daily due to:
- Traffic patterns
- Industrial activity
- Weather changes
This is why AQI values can change quickly even within the same city.
Key Takeaway
Air pollution levels in Indian cities are strongly seasonal, with the worst conditions usually occurring in winter and the best during the monsoon.
Are These Cities Always the Most Polluted?
Although cities like Delhi, Ghaziabad, and Kanpur are often listed among the most polluted, they are not always the worst at all times. Air pollution levels vary depending on several factors, and rankings can change frequently.
1. Pollution Rankings Change Over Time
Air quality data is dynamic. A city that ranks among the most polluted today may not hold the same position tomorrow or in another season.
This variation occurs because:
- Weather conditions change daily
- Emission levels fluctuate
- Pollution disperses differently over time
2. Different Metrics Show Different Results
Pollution rankings depend on how air quality is measured:
- PM2.5 concentration focuses on fine particles
- AQI combines multiple pollutants into a single index
Because of this, a city may rank high in PM2.5 but differ in AQI rankings. For more detail, see PM2.5 explained in India.
3. Monitoring Coverage Affects Rankings
Cities with more monitoring stations often report more accurate—and sometimes higher—pollution levels.
- More stations → better detection of pollution hotspots
- Fewer stations → less representative data
This means rankings can sometimes reflect data availability, not just actual pollution levels.
4. Seasonal Peaks Influence Rankings
Cities in northern India often appear more polluted during winter due to weather conditions. However, during monsoon or summer, pollution levels may decrease significantly.
Key Takeaway
Pollution rankings should be seen as temporary indicators, not fixed labels. Understanding trends over time provides a more accurate picture than relying on daily or short-term rankings.
What High Pollution Means for Residents
High air pollution levels are not just numbers—they represent increased exposure to harmful particles and gases that can affect daily life and long-term health.
1. Exposure to Fine Particles (PM2.5)
PM2.5 particles are small enough to enter deep into the lungs and bloodstream. In cities with consistently high pollution levels:
- People are exposed to elevated concentrations for long periods
- Outdoor air quality can remain poor for several days or weeks
- Even indoor air can be affected without proper ventilation or filtration
A detailed explanation is available in PM2.5 explained in India.
2. Short-Term Effects
During high pollution periods, residents may experience:
- Eye irritation
- Throat discomfort
- Breathing difficulty
- Reduced visibility
These effects are more noticeable during severe pollution episodes, especially in winter.
3. Long-Term Health Risks
Long-term exposure to polluted air is associated with:
- Respiratory conditions
- Cardiovascular stress
- Reduced lung function
For a deeper understanding, see health effects of air pollution in India.
4. Daily Life Impact
High pollution levels can also affect:
- Outdoor activities (limited during severe AQI days)
- School schedules (in extreme cases)
- Travel and visibility
In some cities, pollution alerts and advisories are issued when AQI reaches high categories.
This information is for educational purposes only and should not be considered medical advice.
Key Takeaway
Living in highly polluted cities means repeated exposure to harmful air, making it important to understand air quality data and take precautions when necessary.
What Do These Rankings Really Mean?
Lists of the “most polluted cities” are useful for understanding general patterns, but they should not be interpreted as exact or permanent rankings. Air pollution data is influenced by how it is measured, where it is measured, and when it is measured.
1. Rankings Reflect Trends, Not Exact Reality
Most pollution rankings are based on averages of PM2.5 concentrations or AQI values over a period of time. These values help identify broad trends, such as which regions consistently experience higher pollution.
However:
- They do not capture pollution in every neighborhood
- They may not reflect short-term spikes or local variations
2. Data Depends on Monitoring Systems
Air quality data comes from monitoring stations placed across cities. The number and location of these stations can influence results:
- More stations → better coverage of pollution hotspots
- Fewer stations → less detailed data
This means some cities may appear cleaner or more polluted depending on how extensively they are monitored.
3. Different Data Sources May Show Different Rankings
Pollution rankings can vary depending on:
- Government data (CPCB monitoring)
- Independent datasets (e.g., global reports)
- Time period used (daily vs annual averages)
Because of this, different reports may list slightly different cities at the top.
4. Pollution Is Not Uniform Across a City
Even within the same city:
- Traffic-heavy areas may have higher pollution
- Residential zones may show lower levels
- Industrial zones can have localized spikes
This means city-level rankings represent overall trends, not exact exposure everywhere.
Key Takeaway
Pollution rankings are best understood as indicators of regional patterns, not fixed labels. Looking at long-term trends and underlying causes provides a clearer picture than focusing only on rankings.
Conclusion
Air pollution in India is concentrated in certain urban regions, particularly in cities located in the Indo-Gangetic Plain, where geographic conditions, emissions, and seasonal weather patterns combine to create higher pollution levels. Cities such as Delhi, Ghaziabad, Noida, and Kanpur frequently appear in pollution rankings, but these positions can change depending on time, data sources, and measurement methods.
Understanding these patterns helps readers interpret air quality data more accurately and highlights why air pollution remains a major environmental challenge across Indian cities.
In practical terms, pollution rankings help identify broad patterns, but long-term trends and local conditions provide a more accurate picture of air quality. By interpreting this data carefully, readers can better understand how air pollution affects different cities and why it remains a significant environmental challenge in India.
Frequently Asked Questions (FAQs)
What are the most polluted cities in India?
Cities in northern India—such as Delhi, Ghaziabad, Noida, Kanpur, and Patna—frequently record the highest air pollution levels. These cities often experience high PM2.5 concentrations due to traffic, industry, construction activity, and seasonal weather conditions.
Which city has the highest air pollution in India?
There is no single city that is always the most polluted. Rankings change over time depending on weather, emissions, and measurement methods. However, cities like Delhi and Ghaziabad often appear at the top during winter months.
Why is air pollution higher in North Indian cities?
Air pollution is higher in many northern cities due to:
- Geographic location (Indo-Gangetic Plain)
- Winter temperature inversion
- Crop residue burning
- High population and traffic density
These factors reduce pollutant dispersion and increase concentration levels.
How is air pollution measured in cities?
Air pollution is measured using pollutant concentrations such as PM2.5, PM10, NO₂, and SO₂. These values are then converted into the Air Quality Index (AQI), which categorizes air quality levels for public understanding.
Does AQI ranking mean a city is always polluted?
No. AQI rankings reflect air quality at a specific time and can change daily or seasonally. A city may rank high during winter but show lower pollution levels during monsoon or summer.
Why do pollution rankings change frequently?
Pollution rankings change due to:
- Weather conditions
- Seasonal variations
- Differences in monitoring stations
- Changes in emissions
This makes air pollution a dynamic issue rather than a fixed ranking.
What does high PM2.5 level mean?
High PM2.5 levels indicate a high concentration of fine particles in the air, which can affect breathing and long-term health. These particles are small enough to enter deep into the lungs and bloodstream.
References
Central Pollution Control Board (CPCB).
National Air Quality Index (AQI) – Official Dashboard
https://airquality.cpcb.gov.in/AQI_India/
Central Pollution Control Board (CPCB).
National Air Quality Index (AQI) Framework
https://cpcb.nic.in/National-Air-Quality-Index/
Ministry of Environment, Forest and Climate Change (MoEFCC), Government of India.
National Clean Air Programme (NCAP)
https://moef.gov.in/en/air-pollution/national-clean-air-programme/
PRANA Portal (CPCB) – NCAP Tracking System
https://prana.cpcb.gov.in/
Press Information Bureau (PIB), Government of India.
National Clean Air Programme Updates
https://pib.gov.in/
World Health Organization (WHO).
Global Air Quality Guidelines (2021)
https://www.who.int/publications/i/item/9789240034228
IQAir.
World Air Quality Report – India
https://www.iqair.com/india
Government of India Open Data Platform.
Air Quality Index – Real-Time Data
https://www.data.gov.in/
Centre for Research on Energy and Clean Air (CREA).
NCAP Progress and Air Pollution Analysis
https://energyandcleanair.org/
ScienceDirect (Elsevier).
Air Pollution and Policy Research (NCAP-related studies)
https://www.sciencedirect.com/
His work focuses specifically on India’s CPCB monitoring systems and real-world pollution exposure. He simplifies complex air quality science for Indian households and policy understanding.