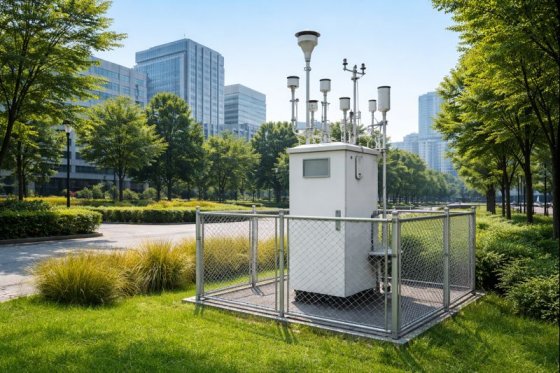
What Is an Air Pollution Monitoring Station?
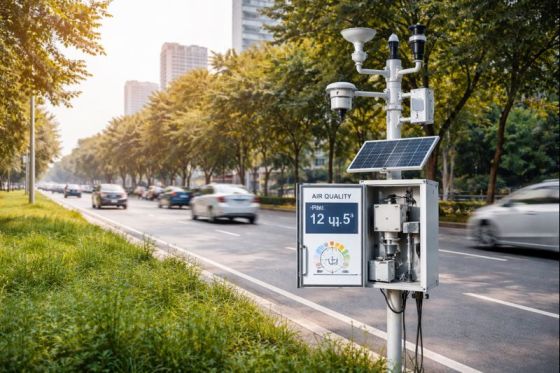
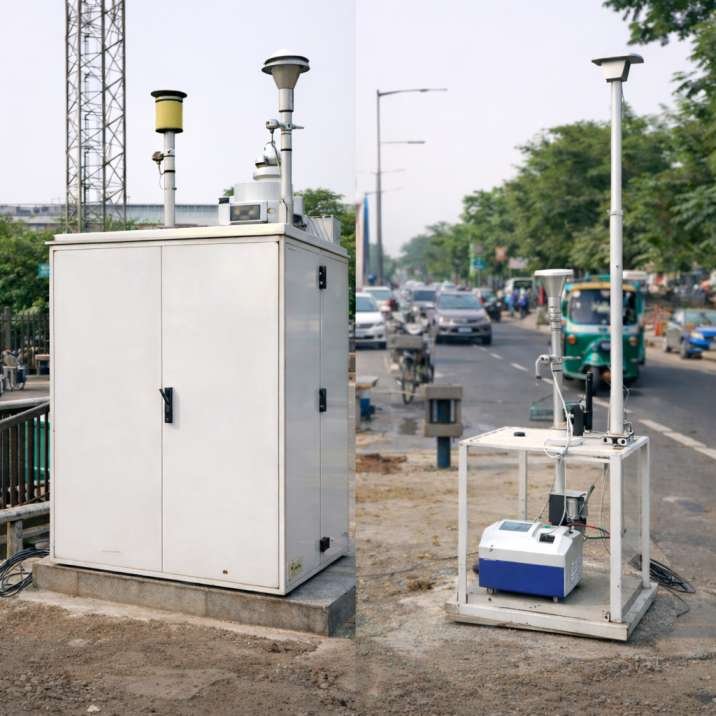
An air pollution monitoring station is a facility equipped with scientific instruments that measure the concentration of pollutants present in the ambient air. These stations continuously analyze pollutants such as particulate matter (PM2.5 and PM10), nitrogen dioxide, sulfur dioxide, carbon monoxide, and ozone.
Monitoring stations collect environmental data that helps scientists and environmental agencies understand pollution levels, identify emission sources, and evaluate the effectiveness of pollution control policies. The collected data is also used to calculate the Air Quality Index (AQI), which provides the public with a simplified indicator of air quality conditions.
In India, national monitoring networks are coordinated by the Central Pollution Control Board through programs such as the National Air Monitoring Programme.
Components of an Air Pollution Monitoring Station
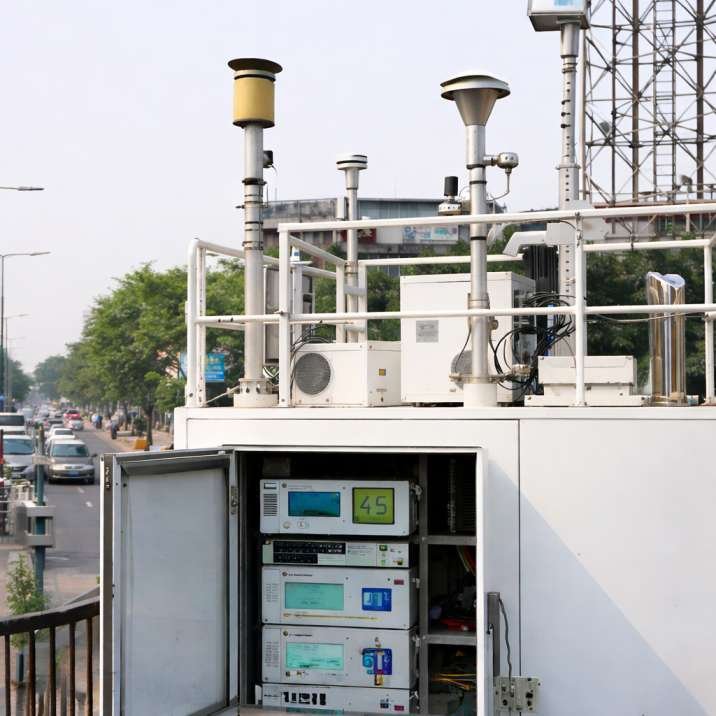
Air pollution monitoring stations contain several specialized instruments designed to collect and analyze air samples continuously. These components work together to measure pollutant concentrations accurately and transmit environmental data to monitoring networks.
Typical components of a monitoring station include:
Air Sampling Inlet
This inlet draws ambient air from the surrounding environment into the monitoring instruments. It is usually positioned at a standardized height to ensure measurements represent local atmospheric conditions.
Pollutant Analyzers
These instruments measure the concentration of specific pollutants such as particulate matter, nitrogen dioxide, sulfur dioxide, ozone, and carbon monoxide. Each pollutant requires a dedicated analyzer that uses chemical or optical measurement techniques.
Pumps and Flow Control Systems
Air pumps pull air through sampling lines and filters at controlled flow rates. Maintaining consistent airflow is important for ensuring accurate pollutant measurements.
Meteorological Sensors
Many monitoring stations also measure weather conditions such as wind speed, wind direction, temperature, and humidity. These parameters help scientists interpret pollution patterns and identify potential emission sources.
Data Acquisition and Transmission Systems
Collected measurements are recorded by a data logger and transmitted to central monitoring servers. Environmental agencies use this data to evaluate air quality trends and generate public air quality reports.
Why Air Pollution Monitoring Stations Are Important
Air pollution cannot be effectively managed without reliable measurement. Monitoring stations provide the scientific data needed to understand how pollution levels change across locations, time periods, and seasons.
These stations continuously measure concentrations of major air pollutants such as particulate matter (PM₂.₅ and PM₁₀), nitrogen dioxide (NO₂), sulfur dioxide (SO₂), carbon monoxide (CO), and ozone (O₃). By collecting this data, environmental authorities can identify pollution sources, detect dangerous pollution episodes, and evaluate whether regulatory policies are working.
Monitoring data also forms the foundation of the Air Quality Index (AQI) reporting system. AQI converts pollutant concentration measurements into a standardized scale that helps the public understand current air quality conditions and associated health risks.
In India, air quality monitoring is coordinated primarily by the Central Pollution Control Board (CPCB) under the National Air Monitoring Programme. The CPCB works with State Pollution Control Boards (SPCBs) and other research institutions to operate a network of monitoring stations across many Indian cities.
These monitoring networks serve several critical functions:
- tracking long-term air quality trends
- identifying pollution hotspots in urban areas
- supporting environmental policy decisions
- providing real-time air quality information to the public
Without systematic monitoring, governments would not have the data necessary to design pollution control policies or evaluate environmental regulations such as vehicle emission standards and industrial limits.
Air pollution monitoring stations therefore act as the measurement backbone of air quality management systems.
Why Air Pollution Monitoring Stations Are Important.
Monitoring stations are not placed randomly within a city. Their location is carefully selected so that the measurements represent different pollution environments such as traffic corridors, industrial zones, residential areas, and background locations.
For example, a monitoring station located near a busy road may detect higher levels of nitrogen dioxide and particulate matter due to vehicle emissions. In contrast, stations located in residential neighborhoods may represent the broader urban air quality experienced by most residents.
Environmental agencies therefore design monitoring networks to capture pollution variation across different parts of a city. This helps scientists identify pollution hotspots and better understand how emission sources influence air quality.
Types of Air Pollution Monitoring Stations
Air quality monitoring networks typically use two main types of monitoring stations. These systems differ in how frequently they collect data, the instruments they use, and how quickly the information becomes available.
In India, both types are operated under programs coordinated by the Central Pollution Control Board along with State Pollution Control Boards and research institutions.
Continuous Ambient Air Quality Monitoring Stations (CAAQMS)
Continuous Ambient Air Quality Monitoring Stations, commonly called CAAQMS, are automated monitoring systems that measure air pollutant concentrations continuously throughout the day.
These stations use advanced analyzers and sensors to measure pollutants such as:
- PM₂.₅ (fine particulate matter)
- PM₁₀ (coarse particulate matter)
- nitrogen dioxide (NO₂)
- sulfur dioxide (SO₂)
- carbon monoxide (CO)
- ozone (O₃)
Measurements are typically recorded every few minutes and transmitted automatically to central data servers. The data can then be used to generate near real-time air quality information for cities.
Because of this continuous monitoring capability, CAAQMS stations are widely used for:
- real-time Air Quality Index (AQI) reporting
- detecting sudden pollution spikes
- studying daily pollution patterns
- issuing health advisories during severe pollution events
Many large Indian cities such as Delhi, Mumbai, Kolkata, and Bengaluru operate CAAQMS networks that provide hourly air quality updates to the public.
Manual Monitoring Stations
Manual monitoring stations use traditional sampling techniques rather than fully automated analyzers.
In these systems, air samples are collected using specialized equipment such as high-volume samplers or respirable dust samplers. The collected particles or gases are then analyzed in laboratories to determine pollutant concentrations.
Manual stations generally operate on scheduled sampling cycles rather than continuous monitoring. For example, samples may be collected for 24 hours once or twice per week.
Although these stations do not provide real-time data, they are still important for long-term air quality assessment. Manual monitoring networks are often used to:
- track pollution trends over multiple years
- validate measurements from automated stations
- support research studies on air pollution exposure
Because the equipment is simpler and less expensive than automated systems, manual monitoring stations can be installed in a larger number of locations.
For this reason, many countries — including India — use a combination of continuous and manual monitoring systems to build a comprehensive air quality monitoring network.
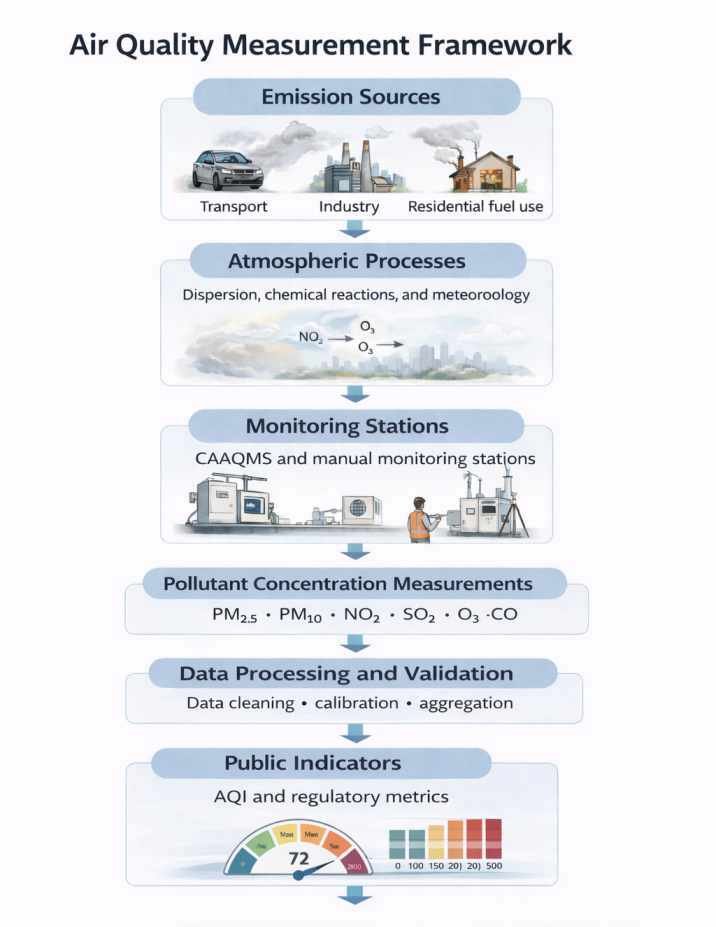
How Air Pollution Monitoring Stations Work
Air pollution monitoring stations follow a systematic process to measure pollutants in the atmosphere. The monitoring workflow typically involves several steps that transform ambient air samples into usable environmental data. In India, air quality monitoring is coordinated by the Central Pollution Control Board (CPCB) through national monitoring programs that track pollutant concentrations across major cities and industrial regions.
Monitoring process:
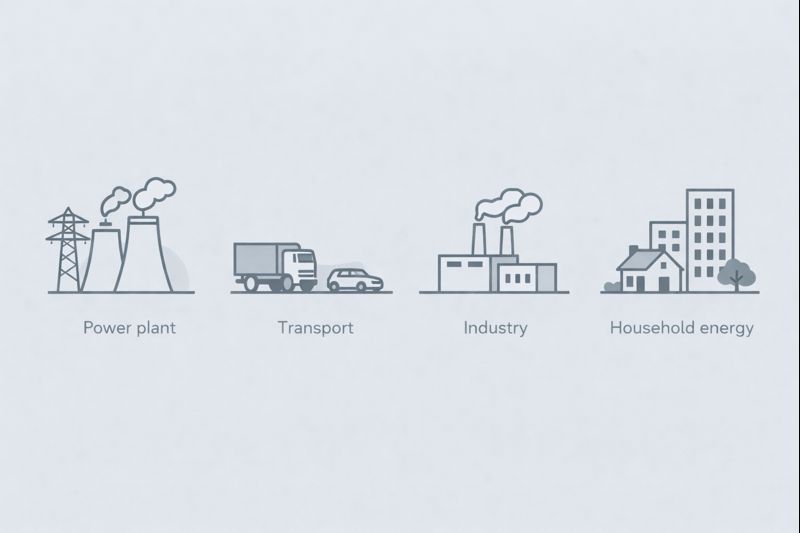
Emission sources
↓
Air sampling inlet
↓
Pollutant sensors and analyzers
↓
Data processing system
↓
Central environmental database
↓
Air Quality Index (AQI) reporting
Air is first drawn into the monitoring system through an inlet designed to capture representative ambient air. The air then passes through specialized analyzers that detect particulate matter and gaseous pollutants using optical, chemical, or infrared detection techniques.
The measured data is automatically recorded and transmitted to central air quality databases where it is processed and used for environmental monitoring and AQI reporting. Monitoring networks also perform automated data validation checks to detect instrument errors, calibration problems, or abnormal readings before the information is used for air quality reporting.
Air Sampling Inlets
Air pollution monitoring stations use specially designed sampling inlets to collect representative ambient air. These inlets are engineered to ensure that particles and gases entering the monitoring instruments accurately reflect the surrounding atmospheric conditions.
Some inlet systems include size-selective components that allow only particles below certain diameters to enter the analyzer. For example, instruments measuring PM₂.₅ use inlet designs that filter out larger particles before the air sample reaches the sensor.
Proper inlet design and placement are important because inaccurate sampling can lead to incorrect pollution measurements.
How Particulate Matter (PM₂.₅ and PM₁₀) Is Measured
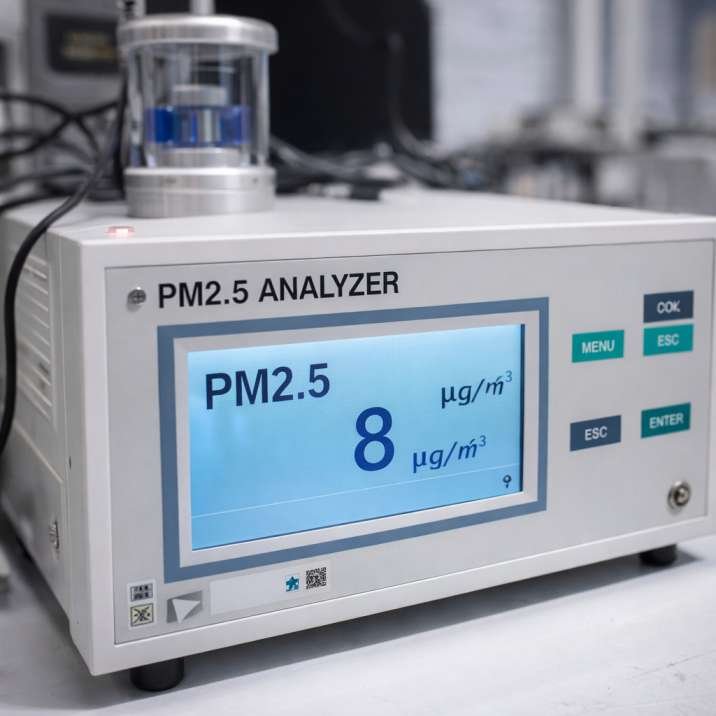
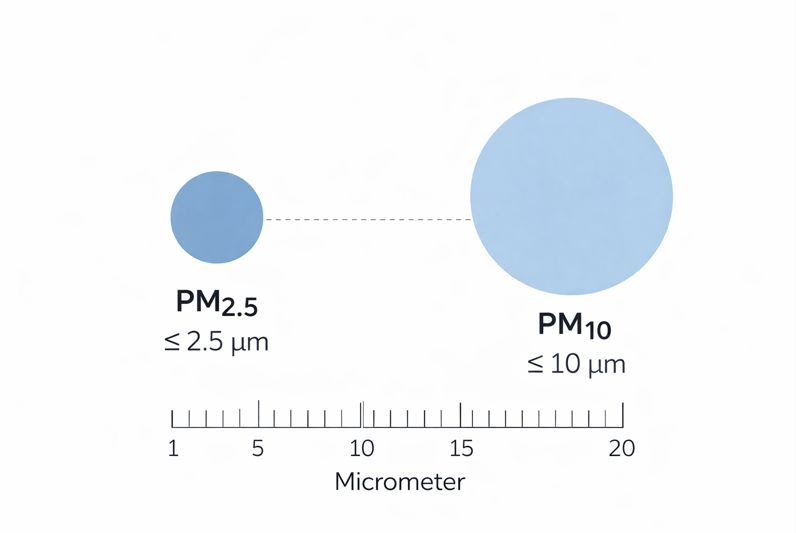
Particulate matter is one of the most important pollutants measured in air quality monitoring systems because it is strongly linked to respiratory and cardiovascular health risks. Monitoring stations measure both PM₂.₅ (particles smaller than 2.5 micrometers) and PM₁₀ (particles smaller than 10 micrometers).
Because these particles are extremely small and suspended in air, specialized instruments are required to detect and quantify their concentration.
Air pollution monitoring stations typically use three main measurement approaches.
Optical Sensors
Many modern monitoring stations use optical particle sensors, which estimate particulate matter concentrations using light scattering.
In this method, air is drawn into the instrument through a small inlet. Inside the device, a laser beam or light source illuminates the particles suspended in the air. As particles pass through the light beam, they scatter light in different directions.
Sensitive detectors measure this scattered light. The intensity and pattern of scattering depend on:
- the number of particles
- their size
- their optical properties
Using calibration models, the instrument converts the light scattering signal into estimates of PM₂.₅ and PM₁₀ concentrations.
Optical sensors are widely used because they can provide continuous real-time measurements, which makes them useful for monitoring pollution trends throughout the day.
However, their readings can sometimes be affected by factors such as humidity, particle composition, or calibration differences.
Beta Attenuation Monitors (BAM)
A more precise method used in many regulatory monitoring stations is the beta attenuation monitor.
In this technique, airborne particles are collected on a filter tape inside the instrument. After particles accumulate on the filter, the instrument passes a beam of beta radiation through the collected sample.
Particles on the filter partially absorb this radiation. The amount of radiation absorbed is directly proportional to the mass of particulate matter deposited on the filter.
By measuring how much the radiation intensity decreases, the instrument can calculate the mass concentration of particulate matter in the sampled air.
Beta attenuation monitors are widely used in official monitoring networks because they provide:
- accurate mass measurements
- automated sampling cycles
- reliable long-term operation
Many Continuous Ambient Air Quality Monitoring Stations (CAAQMS) in India use BAM technology for regulatory PM measurement.
Particle Counters
Some monitoring instruments measure particulate matter using particle counters, which directly count the number of particles in different size ranges.
Air is pulled through a sensing chamber where particles pass through a focused laser beam. Each particle generates a light pulse that is detected and recorded. The size of the pulse corresponds to the approximate particle size.
The instrument then classifies particles into size categories and estimates the number concentration of particles in the air.
Using conversion models, particle count data can be transformed into approximate mass concentrations for PM₂.₅ and PM₁₀.
Particle counters are often used in research studies, portable monitoring devices, and low-cost sensor networks.
Why Measuring Particulate Matter Is Challenging
Unlike gases, particulate matter varies greatly in:
- size
- chemical composition
- density
- shape
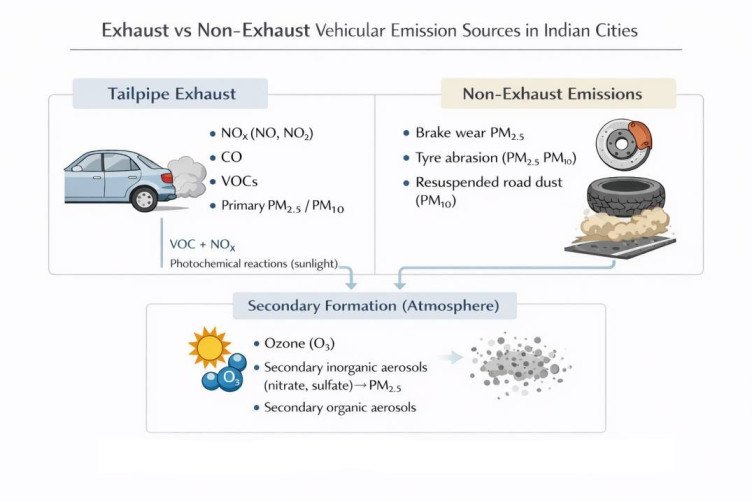
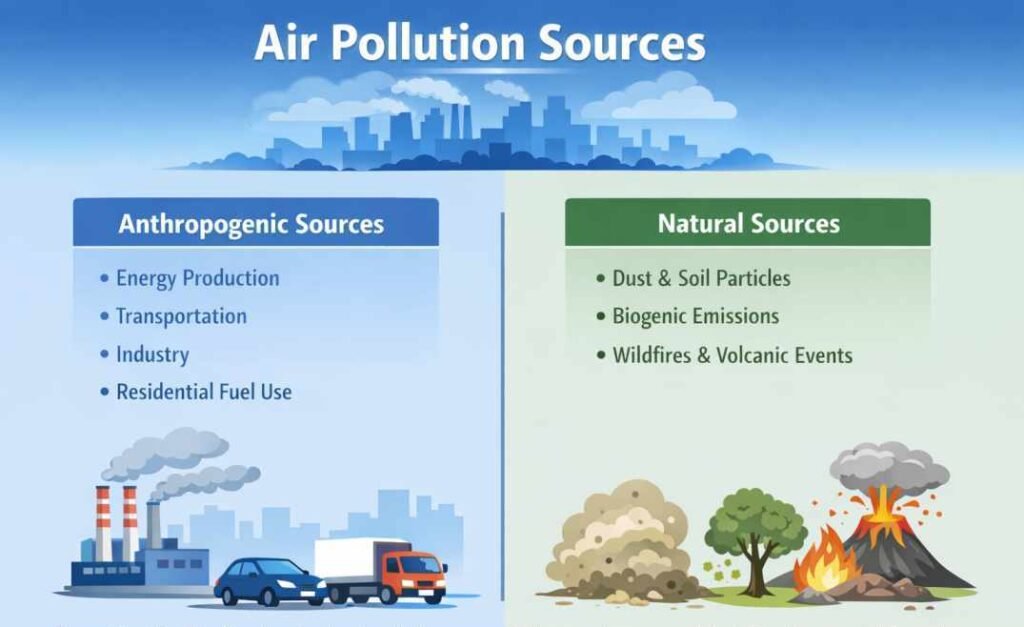
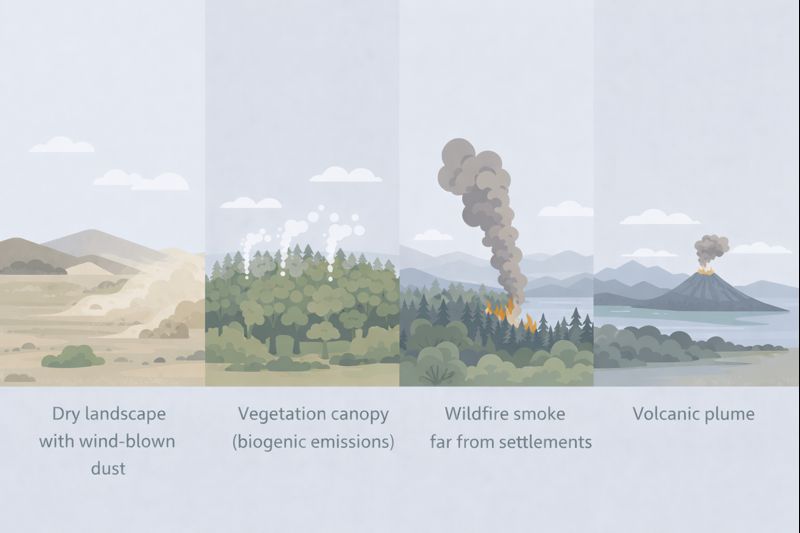
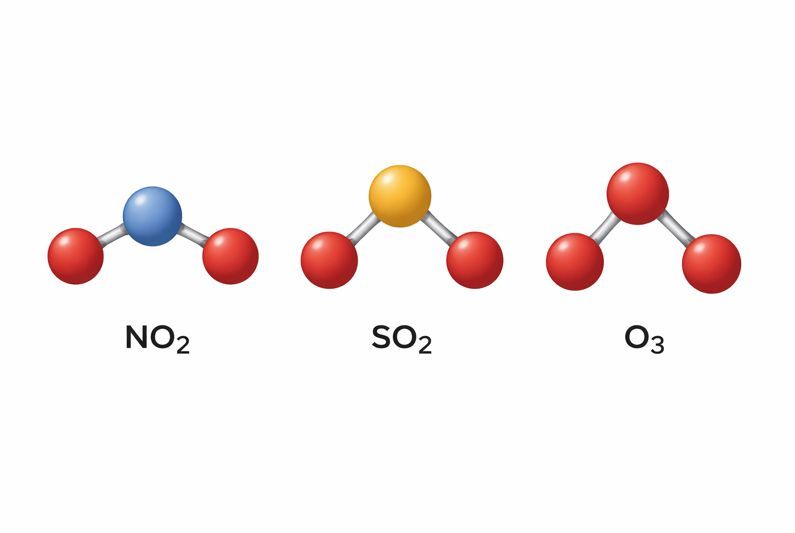
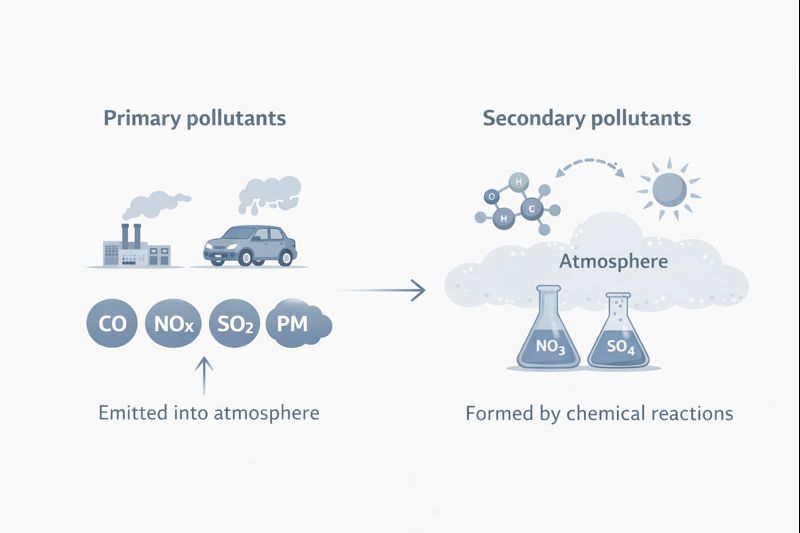
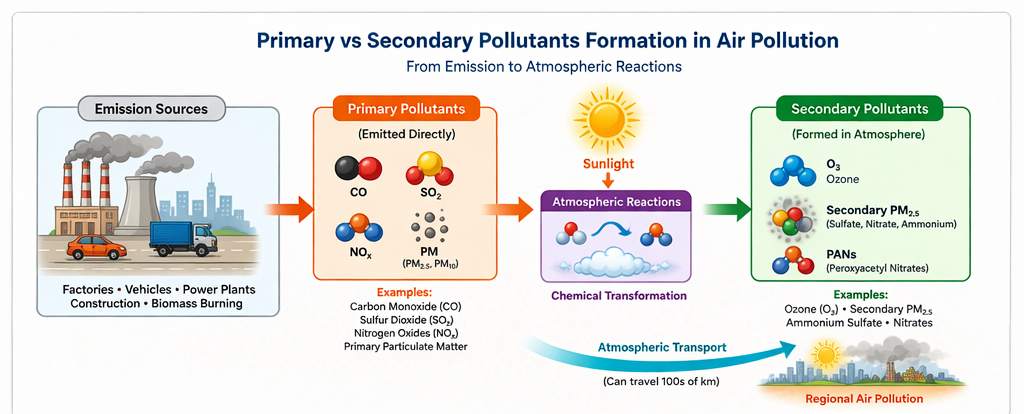
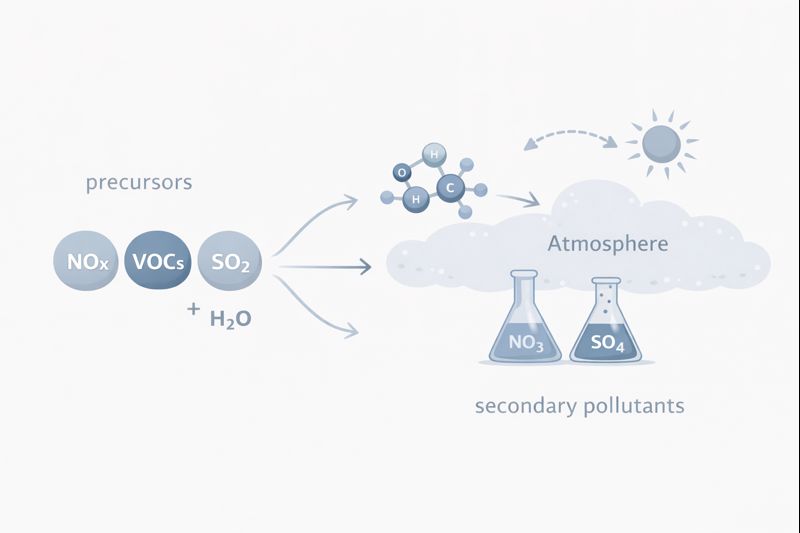
Particles may originate from many different sources such as vehicle emissions, industrial processes, dust, biomass burning, and secondary chemical reactions in the atmosphere.
Because of this variability, instruments require regular calibration and maintenance to ensure accurate measurements.
For this reason, national monitoring networks such as those operated by the Central Pollution Control Board use standardized instruments and measurement protocols to maintain data quality.
How Gas Pollutants Are Measured
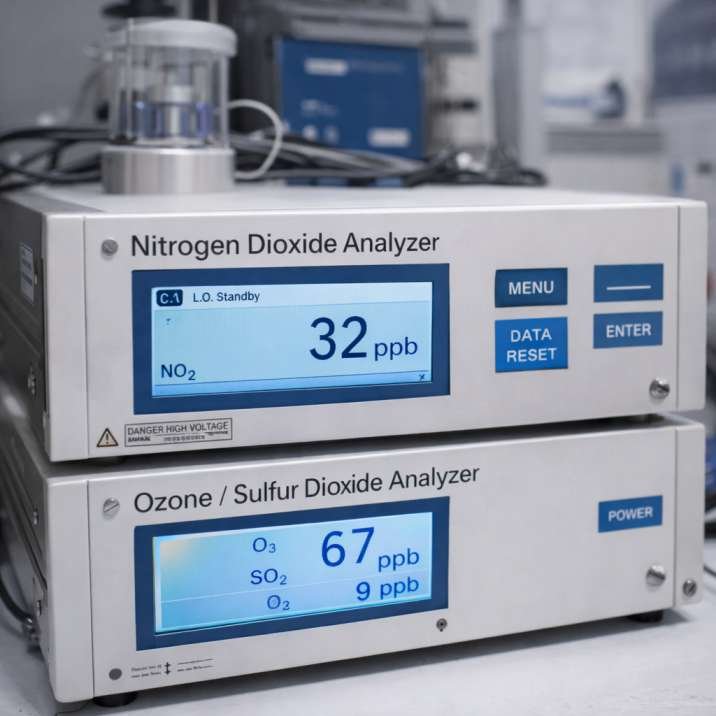
In addition to particulate matter, air pollution monitoring stations measure several gaseous pollutants that contribute to urban air pollution and health risks. Commonly monitored gases include nitrogen dioxide (NO₂), sulfur dioxide (SO₂), and carbon monoxide (CO).
These pollutants are measured using specialized gas analyzers. Each analyzer uses a specific physical or chemical principle to detect the presence and concentration of a particular gas in the air.
Air is continuously drawn into the analyzer through an inlet system, and the instrument measures how the gas interacts with light, chemicals, or electrical signals. The measured signal is then converted into a pollutant concentration, usually expressed in micrograms per cubic meter (µg/m³) or parts per million (ppm).
Modern monitoring stations automatically record these measurements at regular intervals and transmit the data to central air quality databases.
Sensor Calibration and Data Quality
Air pollution monitoring instruments require regular calibration to maintain measurement accuracy. Over time, sensor performance may change due to environmental exposure, aging components, or contamination.
Calibration involves comparing the readings from monitoring instruments with reference standards under controlled conditions. This ensures that measurements remain consistent across different monitoring stations.
Environmental agencies follow strict quality assurance procedures to maintain reliable data. In India, monitoring networks follow guidelines established by the Central Pollution Control Board and state pollution control agencies.
Accurate calibration is essential because monitoring data is used for scientific research, environmental regulation, and public reporting of air quality conditions.
Nitrogen Dioxide Measurement
Nitrogen dioxide (NO₂) is primarily produced by high-temperature combustion processes, especially from vehicle engines, power plants, and industrial activities.
Monitoring stations commonly measure NO₂ using the chemiluminescence method.
In this technique, nitrogen monoxide (NO) present in the air sample reacts with ozone (O₃) inside the analyzer. This chemical reaction produces light. The emitted light intensity is measured by a photodetector, and the signal is proportional to the concentration of nitrogen oxides.
To determine the amount of NO₂, the instrument first converts NO₂ into NO using a catalytic converter. The analyzer then measures the total nitrogen oxides (NOx), allowing the concentration of NO₂ to be calculated.
Chemiluminescence analyzers are widely used in regulatory monitoring stations because they provide high sensitivity and continuous measurement capability.
Sulfur Dioxide Measurement
Sulfur dioxide (SO₂) is mainly produced by burning sulfur-containing fuels such as coal and heavy oils. Industrial processes and thermal power plants are major sources of SO₂ emissions.
Air monitoring stations typically measure SO₂ using the ultraviolet fluorescence method.
In this method, sulfur dioxide molecules absorb ultraviolet (UV) light when exposed to a UV lamp inside the analyzer. After absorbing the energy, the molecules release it as fluorescent light at a different wavelength.
The intensity of this fluorescent light is measured by a detector. Because the emitted light is directly related to the number of SO₂ molecules present, the instrument can determine the concentration of sulfur dioxide in the air sample.
This technique is widely used because it offers high accuracy and rapid measurement.
Carbon Monoxide Measurement
Carbon monoxide (CO) is a colorless and odorless gas produced by incomplete combustion of fuels. In urban areas, motor vehicles are one of the main sources of CO emissions.
Monitoring stations usually measure CO using non-dispersive infrared (NDIR) analyzers.
Carbon monoxide molecules absorb infrared radiation at specific wavelengths. Inside the analyzer, infrared light is passed through the air sample. If carbon monoxide is present, it absorbs part of this radiation.
A detector measures how much infrared light reaches the sensor after passing through the sample. The reduction in light intensity corresponds to the concentration of carbon monoxide.
NDIR analyzers are commonly used because they provide continuous measurement with good stability and reliability.
Data collected from these gas analyzers contributes to national air quality monitoring systems operated by organizations such as the Central Pollution Control Board and state pollution control authorities.
These measurements play an essential role in tracking pollution trends, identifying emission sources, and supporting air quality regulations.
Sensor Calibration and Data Quality
Air pollution monitoring instruments require regular calibration to maintain measurement accuracy. Over time, sensor sensitivity can change due to environmental conditions, aging components, or contamination.
Calibration involves comparing the readings from monitoring instruments with reference standards under controlled conditions. This process ensures that measurements from different monitoring stations remain consistent and scientifically reliable.
Environmental monitoring agencies follow strict quality assurance protocols to maintain data accuracy. In India, calibration procedures are implemented according to guidelines established by the Central Pollution Control Board and other regulatory authorities.
Proper calibration is essential for ensuring that monitoring data can be used confidently for air quality research, regulatory decisions, and public reporting.
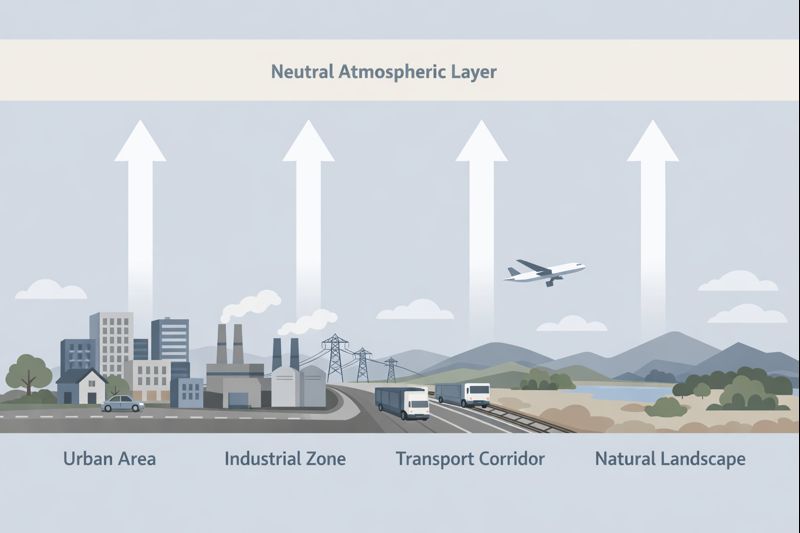
Meteorological Instruments in Monitoring Stations
Air pollution levels are strongly influenced by weather conditions. For this reason, most air quality monitoring stations also include meteorological instruments that measure atmospheric variables affecting the movement and dispersion of pollutants.
Meteorological data helps scientists understand how pollutants travel, accumulate, or disperse in the atmosphere. Without this information, it would be difficult to interpret changes in air pollution levels.
Key meteorological parameters measured at monitoring stations include wind speed, wind direction, temperature, and humidity.
Wind Speed
Wind speed plays a major role in determining how quickly air pollutants disperse.
When wind speeds are high, pollutants are carried away from their source and diluted over a larger area. This process reduces the concentration of pollutants in a specific location.
In contrast, low wind speeds allow pollutants to accumulate near the ground, especially in densely populated urban areas.
Monitoring stations measure wind speed using anemometers, which typically consist of rotating cups or ultrasonic sensors that detect the movement of air.
Wind speed data helps researchers analyze pollution transport patterns and identify conditions that may lead to pollution buildup.
Wind Direction
Wind direction indicates the direction from which the wind is blowing. This information is essential for identifying potential pollution sources.
For example, if high pollution levels are observed at a monitoring station and the wind is blowing from an industrial area, scientists can infer that emissions from that direction may be contributing to the measured pollution levels.
Wind direction is usually measured using wind vanes or ultrasonic wind sensors installed on monitoring towers.
By combining wind direction data with pollutant measurements, environmental scientists can perform source attribution studies that help locate pollution sources.
Temperature
Temperature influences several atmospheric processes that affect air pollution.
Warm air near the ground usually rises and mixes with the surrounding atmosphere, allowing pollutants to disperse more easily. However, under certain conditions, a phenomenon called temperature inversion can occur.
During a temperature inversion, a layer of warm air traps cooler air near the ground. This prevents vertical mixing and allows pollutants to accumulate close to the surface, often leading to severe smog events.
Temperature sensors installed at monitoring stations help detect such conditions and improve the interpretation of air pollution data.
Humidity
Humidity refers to the amount of water vapor present in the air. High humidity can influence air pollution in several ways.
Water vapor can interact with pollutants and contribute to the formation of secondary particulate matter, including sulfate and nitrate particles. Humidity can also affect how particles grow in size by absorbing moisture from the atmosphere.
In addition, humidity can influence the performance of certain air pollution sensors, especially optical particulate matter instruments.
Monitoring stations measure humidity using hygrometers, which track changes in atmospheric moisture levels.
Air Pollution Monitoring Network in India
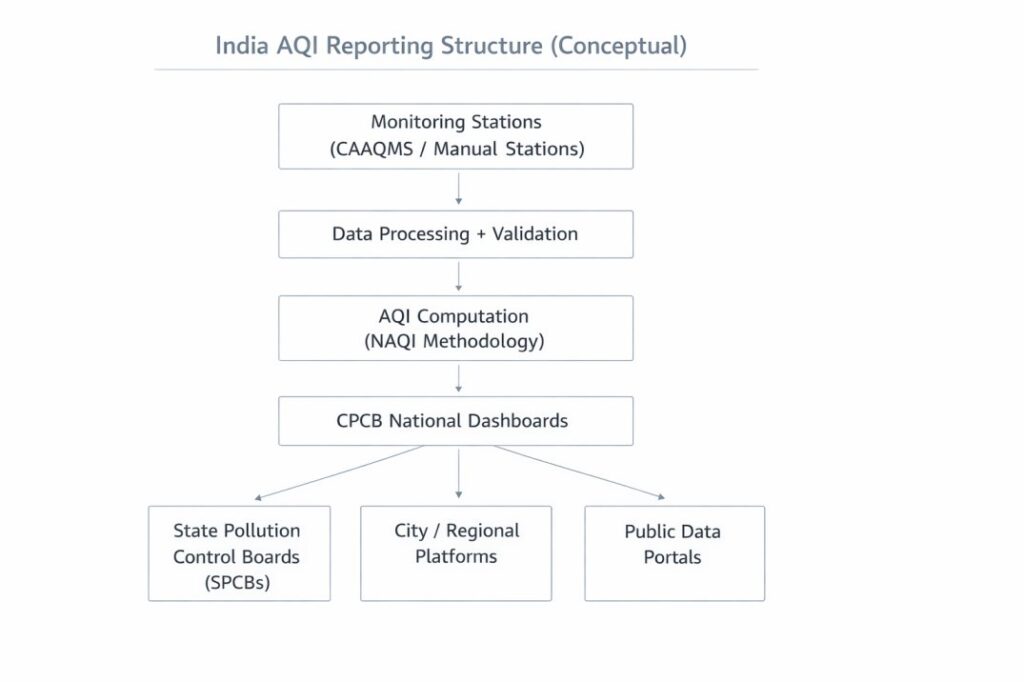
India operates a large air quality monitoring system to track pollution levels across major cities and regions. This monitoring network is coordinated at the national level by the Central Pollution Control Board (CPCB) under the Ministry of Environment, Forest and Climate Change.
Air pollution levels can vary significantly within a city because of differences in traffic density, industrial activity, construction work, and local weather conditions. For this reason, monitoring networks use multiple stations distributed across urban areas to capture spatial variations in air pollution levels.
The CPCB works together with State Pollution Control Boards (SPCBs) and Pollution Control Committees to operate monitoring stations in different states and urban areas.
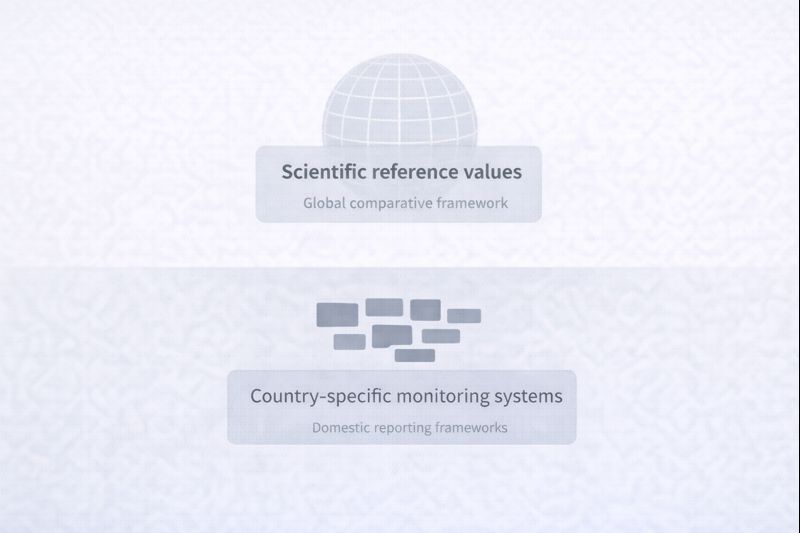
The national monitoring framework mainly consists of two major systems.
Detecting Urban Pollution Episodes
Continuous monitoring stations make it possible to detect short-term pollution events known as pollution episodes. These events occur when pollutant concentrations rise rapidly within a short period of time.
Pollution episodes may occur due to several factors, including:
- heavy traffic congestion
- biomass burning
- industrial emissions
- atmospheric temperature inversion during winter
Because automated monitoring stations collect data continuously, they can quickly identify sudden increases in pollutant concentrations. Environmental agencies may use this information to issue health advisories or investigate potential emission sources.
National Air Monitoring Programme (NAMP)
The National Air Monitoring Programme (NAMP) is one of India’s primary long-term air quality monitoring initiatives. It was established to systematically measure pollution levels in cities and towns across the country.
Under this program, monitoring stations measure key pollutants such as:
- particulate matter (PM₁₀ and PM₂.₅)
- sulfur dioxide (SO₂)
- nitrogen dioxide (NO₂)
Many NAMP stations use manual monitoring methods, where air samples are collected periodically and analyzed in laboratories.
These stations help researchers and policymakers track long-term pollution trends and assess whether pollution levels are increasing or decreasing over time.
Continuous Ambient Air Quality Monitoring Stations (CAAQMS)
In addition to manual monitoring networks, India also operates Continuous Ambient Air Quality Monitoring Stations (CAAQMS) in many major cities.
These automated stations measure multiple pollutants continuously and transmit data to central servers in near real time. The data collected from CAAQMS systems supports:
- real-time air quality reporting
- hourly pollution updates
- early detection of pollution spikes
- public health advisories during severe pollution episodes
Large metropolitan areas such as Delhi, Mumbai, Kolkata, and Bengaluru operate multiple CAAQMS stations to provide detailed air quality information across different parts of the city.
Role of State Pollution Control Boards
While the Central Pollution Control Board sets monitoring guidelines and manages national data systems, much of the operational responsibility lies with State Pollution Control Boards.
These agencies are responsible for:
- installing monitoring stations
- maintaining monitoring equipment
- ensuring data quality and calibration
- reporting air quality data to national databases
State agencies also use monitoring data to support regional environmental regulation and pollution control planning.
City-Level Monitoring Networks
Many large cities operate dense monitoring networks that combine stations operated by CPCB, state authorities, and research institutions.
These networks provide localized pollution data that helps identify pollution hotspots such as:
- traffic corridors
- industrial zones
- construction areas
- densely populated urban neighborhoods
Urban monitoring networks are particularly important because air pollution can vary significantly within different parts of a city.
Together, these national, state, and city-level systems form India’s air quality monitoring infrastructure, generating the data used for environmental regulation, scientific research, and public information systems.
Monitoring data from these networks is also used to calculate and publish the Air Quality Index (AQI) for cities across the country.
How Monitoring Data Is Used for AQI Calculation
Air pollution monitoring stations continuously collect data on the concentration of major air pollutants. This raw measurement data is then used to calculate the Air Quality Index (AQI), which provides a simplified way for the public to understand air quality conditions.
In India, AQI calculations are developed and managed by the Central Pollution Control Board. The system converts pollutant concentration values into a standardized index that represents the overall air quality level.
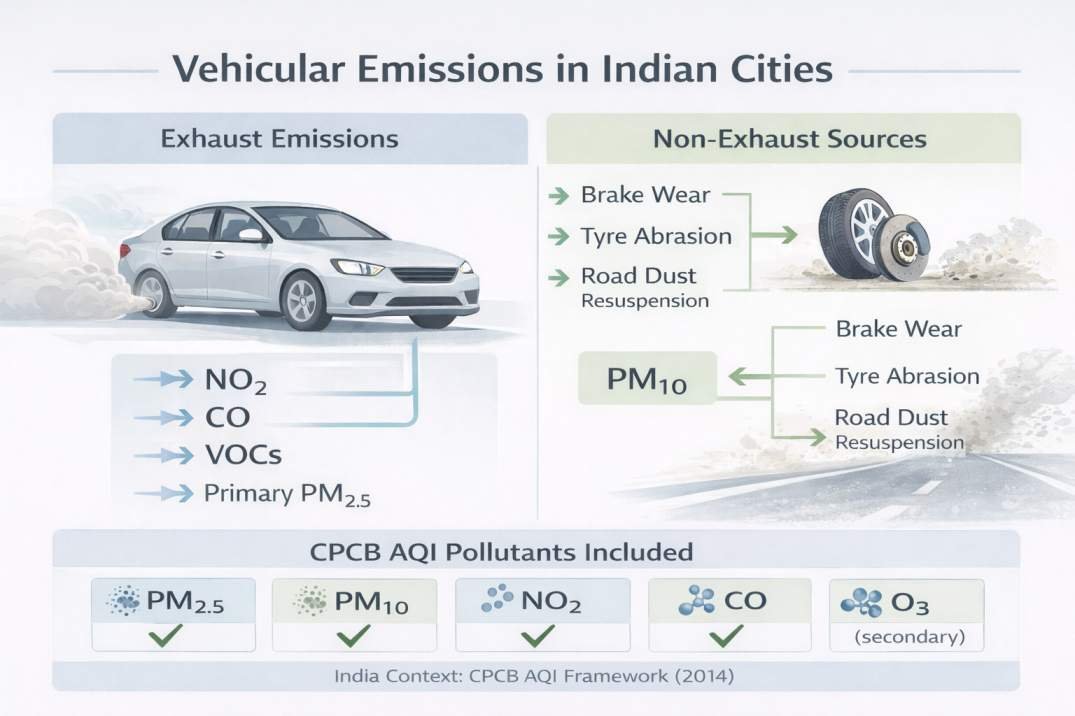
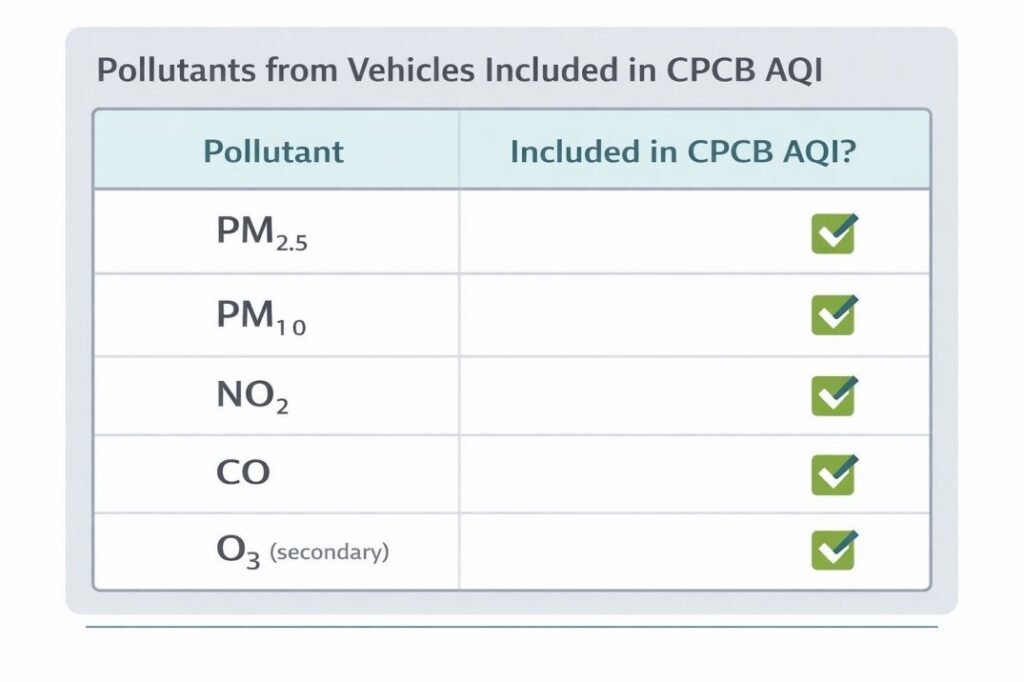
Monitoring stations measure several pollutants that contribute to the AQI calculation, including:
- particulate matter (PM₂.₅ and PM₁₀)
- nitrogen dioxide (NO₂)
- sulfur dioxide (SO₂)
- carbon monoxide (CO)
- ozone (O₃)
- ammonia (NH₃)
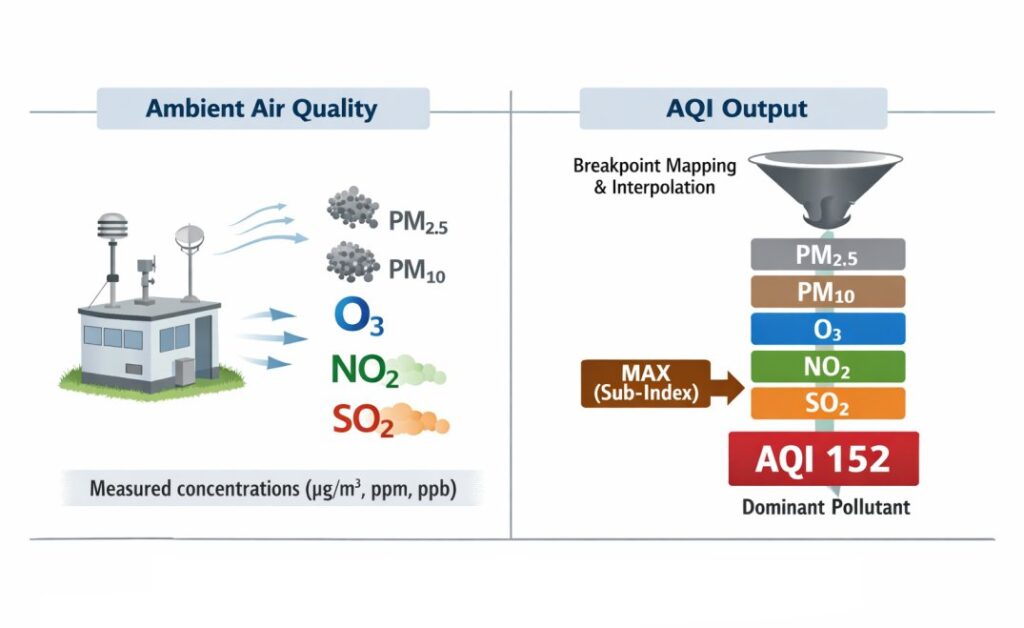
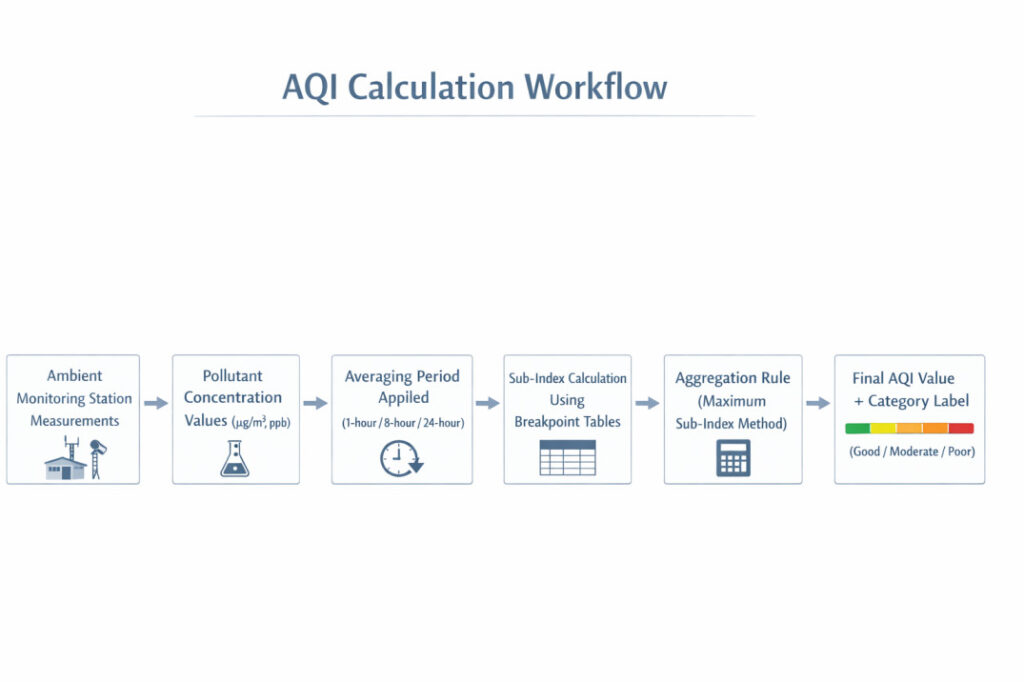
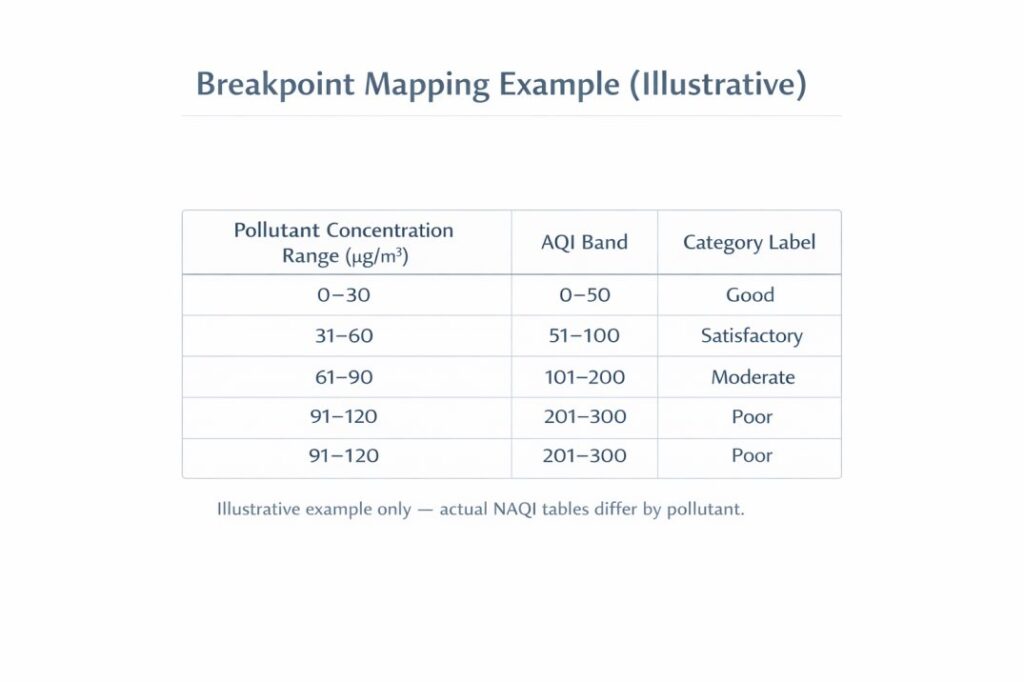
For each pollutant, the measured concentration is compared with predefined breakpoint concentration ranges. These ranges correspond to specific AQI categories such as Good, Satisfactory, Moderate, Poor, Very Poor, and Severe.
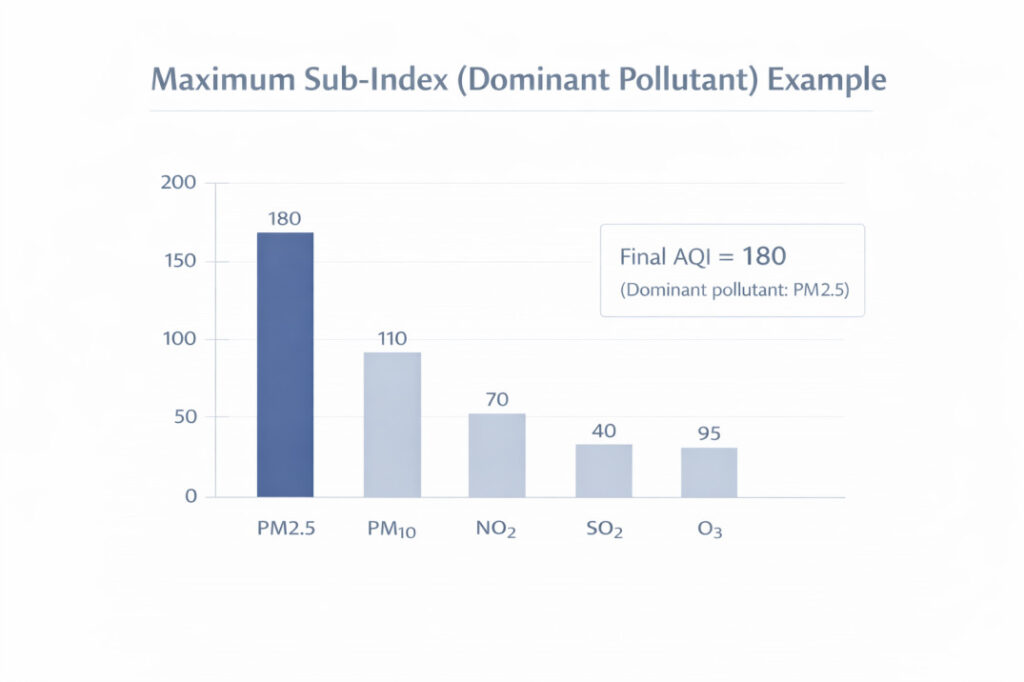
The concentration value is converted into a sub-index score for that pollutant. The highest sub-index value among all monitored pollutants determines the overall AQI reported for that location.
For example, if PM₂.₅ levels produce a higher AQI sub-index than other pollutants, PM₂.₅ becomes the dominant pollutant for that reporting period.
AQI values are typically calculated using 24-hour average concentrations for particulate matter and shorter averaging periods for certain gases. The results are then displayed on public air quality dashboards and mobile applications to inform citizens about current air pollution levels.
Monitoring data collected from stations across India feeds into national air quality platforms operated by the Central Pollution Control Board, allowing cities to publish daily AQI values.
For a detailed explanation of how AQI categories and calculation methods work, see the article:
Air Quality Index (AQI) Explained: Measurement Structure and Reporting Framework (India Context).
Components of an Air Pollution Monitoring Station
Air pollution monitoring stations contain several specialized instruments designed to collect and analyze air samples continuously. These components work together to measure pollutant concentrations and record environmental data.
Key components of a monitoring station include:
Air Sampling Inlet
This inlet draws ambient air from the surrounding atmosphere into the monitoring instruments. It is usually positioned at a standardized height so that measurements represent local environmental conditions.
Pollutant Analyzers
Dedicated analyzers measure concentrations of pollutants such as particulate matter (PM2.5 and PM10), nitrogen dioxide, sulfur dioxide, ozone, and carbon monoxide. Each pollutant requires a specific detection technique.
Air Pumps and Flow Control Systems
Pumps move air through sampling lines at controlled flow rates. Maintaining consistent airflow is necessary to ensure reliable pollutant measurements.
Meteorological Sensors
Monitoring stations often include sensors that measure temperature, humidity, wind speed, and wind direction. These weather parameters help scientists understand how pollutants move and disperse in the atmosphere.
Data Acquisition Systems
All measurements are recorded by data loggers and transmitted to central monitoring servers where environmental agencies analyze air quality trends.
Limitations of Air Pollution Monitoring Networks
Although monitoring stations provide valuable environmental data, they also have certain limitations.
Limited Spatial Coverage
Monitoring stations are usually installed at specific locations such as urban centers or industrial areas. Because air pollution levels can vary significantly across neighborhoods, measurements from a single station may not represent the entire city.
High Installation and Maintenance Costs
Continuous monitoring stations require advanced analyzers, calibration systems, and technical maintenance. These costs can limit the number of stations that environmental agencies are able to deploy.
Calibration and Data Quality Challenges
Air monitoring instruments must be regularly calibrated to ensure accurate measurements. Poor maintenance or calibration errors can affect the reliability of recorded pollutant concentrations.
Local Environmental Influences
Nearby traffic, construction activities, or industrial emissions can influence measurements at individual stations. Scientists often use multiple monitoring sites to better understand regional pollution patterns.
Understanding these limitations helps researchers interpret monitoring data more accurately and design more effective air quality management strategies.
Summary
Air pollution monitoring stations form the foundation of modern air quality management systems. These stations use specialized instruments to measure both particulate matter and gaseous pollutants in the atmosphere.
Particulate matter such as PM₂.₅ and PM₁₀ is measured using techniques including optical sensors, beta attenuation monitors, and particle counters. Gaseous pollutants such as nitrogen dioxide, sulfur dioxide, and carbon monoxide are measured using gas analyzers based on chemical or optical detection methods.
In addition to pollutant measurements, monitoring stations collect meteorological data such as wind speed, wind direction, temperature, and humidity. These factors influence how pollutants disperse in the atmosphere.
In India, national monitoring networks operated by the Central Pollution Control Board and State Pollution Control Boards collect air quality data from monitoring stations across many cities. This data is used to calculate the Air Quality Index (AQI) and support environmental policy decisions.
Although monitoring stations provide essential information, their coverage and accuracy depend on proper maintenance, calibration, and sufficient geographic distribution.
Together, these monitoring systems play a critical role in understanding air pollution patterns and supporting efforts to improve air quality.
Key Takeaways
Monitoring data is used to calculate the Air Quality Index (AQI) and support environmental policy decisions.
- Air pollution monitoring stations measure pollutant concentrations in the ambient atmosphere using specialized sensors and analyzers.
- Particulate matter such as PM₂.₅ and PM₁₀ is measured using optical sensors, beta attenuation monitors, and particle counters.
- Gaseous pollutants including nitrogen dioxide, sulfur dioxide, and carbon monoxide are measured using chemical and optical analyzers.
- Meteorological instruments measure wind speed, wind direction, temperature, and humidity to help interpret pollution patterns.
- Monitoring networks operated by the Central Pollution Control Board and state pollution control agencies collect air quality data across India.
Frequently Asked Questions
What is an air pollution monitoring station?
An air pollution monitoring station is a facility equipped with scientific instruments that measure the concentration of pollutants in ambient air. These stations monitor pollutants such as particulate matter (PM2.5 and PM10), nitrogen dioxide, sulfur dioxide, carbon monoxide, and ozone to assess air quality.
How do air quality sensors measure pollutants?
Air quality sensors detect pollutants using specialized technologies such as optical particle counters for particulate matter and gas analyzers for gases like nitrogen dioxide or sulfur dioxide. These instruments analyze air samples and convert measurements into digital data.
What pollutants are commonly measured at monitoring stations?
Most monitoring stations measure particulate matter (PM2.5 and PM10), nitrogen dioxide (NO₂), sulfur dioxide (SO₂), carbon monoxide (CO), ozone (O₃), and sometimes volatile organic compounds (VOCs).
Who operates air pollution monitoring stations in India?
In India, air quality monitoring is primarily conducted by the Central Pollution Control Board (CPCB) and State Pollution Control Boards under programs such as the National Air Quality Monitoring Programme.
How is monitoring data used?
Air pollution monitoring data is used to calculate the Air Quality Index (AQI), identify pollution sources, track long-term air quality trends, and support environmental regulations and public health policies.
References
Kumar, P., et al. (2015). The Rise of Low-Cost Sensing for Managing Air Pollution in Cities. Environment International.
https://doi.org/10.1016/j.envint.2014.11.019
Central Pollution Control Board (CPCB). National Air Quality Monitoring Programme (NAMP).
https://cpcb.nic.in/about-namp/ (Central Pollution Control Board)
Central Pollution Control Board (CPCB). National Air Quality Monitoring Programme Data.
https://cpcb.nic.in/namp-data/ (Central Pollution Control Board)
Ministry of Environment, Forest and Climate Change (MoEFCC), Government of India. National Clean Air Programme (NCAP).
https://moef.gov.in/en/major-initiatives/national-clean-air-programme-ncap/
World Health Organization (WHO). WHO Global Air Quality Guidelines: PM2.5, PM10, Ozone, NO₂, SO₂ and CO (2021).
https://www.who.int/publications/i/item/9789240034228 (World Health Organization)
United States Environmental Protection Agency (EPA). Air Sensor Toolbox for Citizen Scientists and Researchers.
https://www.epa.gov/air-sensor-toolbox
European Environment Agency (EEA). Air Quality in Europe – Monitoring and Assessment.
https://www.eea.europa.eu/en/analysis/publications/air-quality-in-europe-2022 (European Environment Agency)
Snyder, E. G., Watkins, T. H., Solomon, P. A., et al. (2013). The Changing Paradigm of Air Pollution Monitoring. Environmental Science & Technology.
https://doi.org/10.1021/es4022602