Introduction
Air pollution is a major public health risk in India, especially in cities where AQI levels frequently remain in the “Poor” or “Severe” category for long periods.
Breathing polluted air does more than cause temporary discomfort. Fine particles such as PM2.5 can travel deep into the lungs, enter the bloodstream, and gradually increase the risk of respiratory and cardiovascular diseases over time.
During severe pollution episodes, people may experience coughing, throat irritation, headaches, eye discomfort, and breathing difficulty. Repeated exposure over months or years can contribute to chronic illnesses such as asthma, heart disease, stroke, and lung cancer.
Understanding these health effects helps explain why AQI levels matter during daily life and long-term exposure. Learn more about how AQI levels are measured and interpreted in our Air Quality Index (AQI) guide.
Learning Objectives
By the end of this guide, you will understand:
- The difference between short-term and long-term health effects of air pollution.
- Why PM2.5 is considered the most dangerous air pollutant for human health.
- How AQI levels relate to health risks.
- Which groups are most vulnerable to air pollution.
- Practical ways to reduce health risks during high AQI days.
Learn more about the major pollutants responsible for these diseases in our Criteria Pollutants Explained guide.
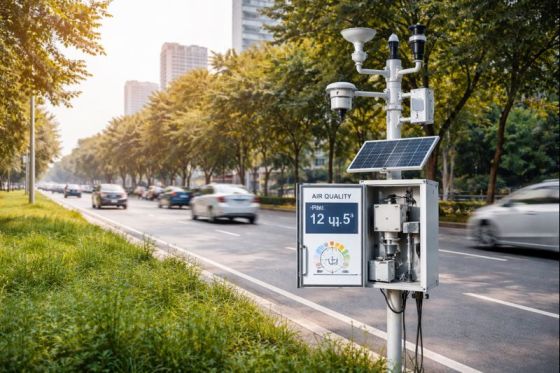
Air Pollution Exposure in India
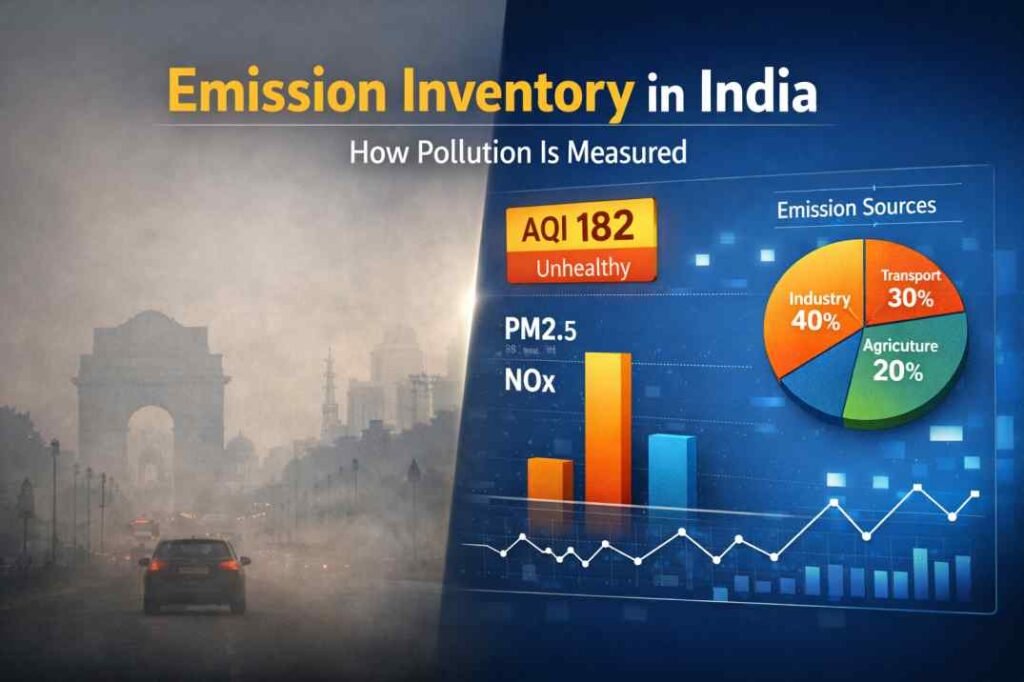
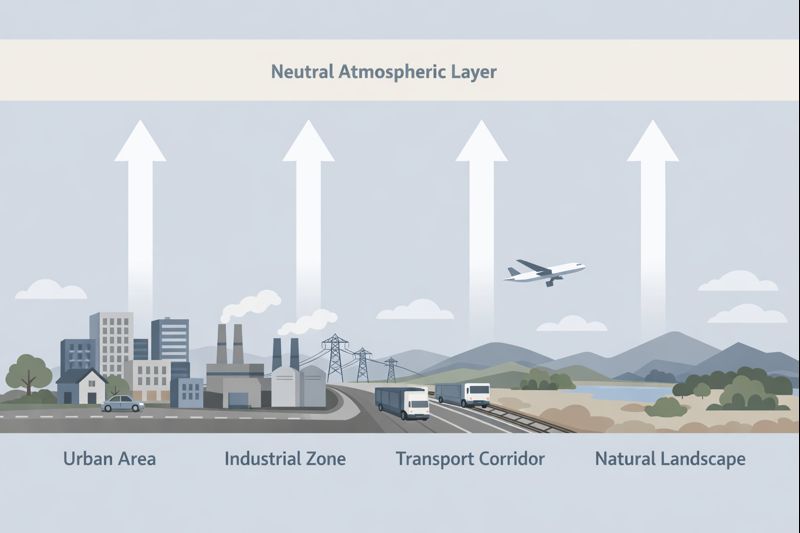
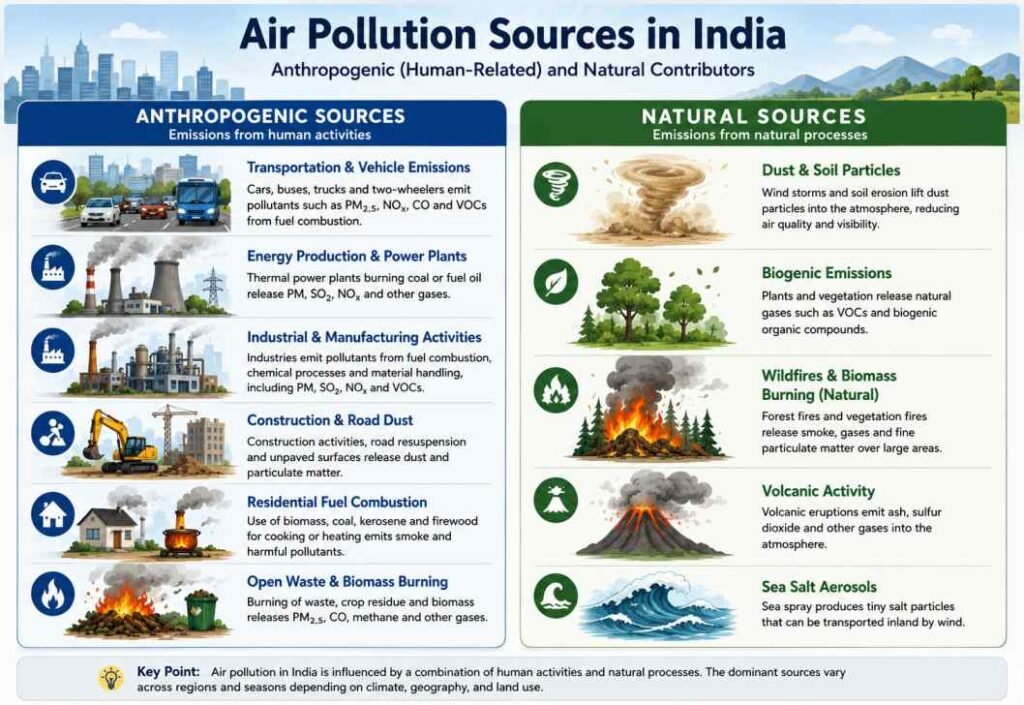
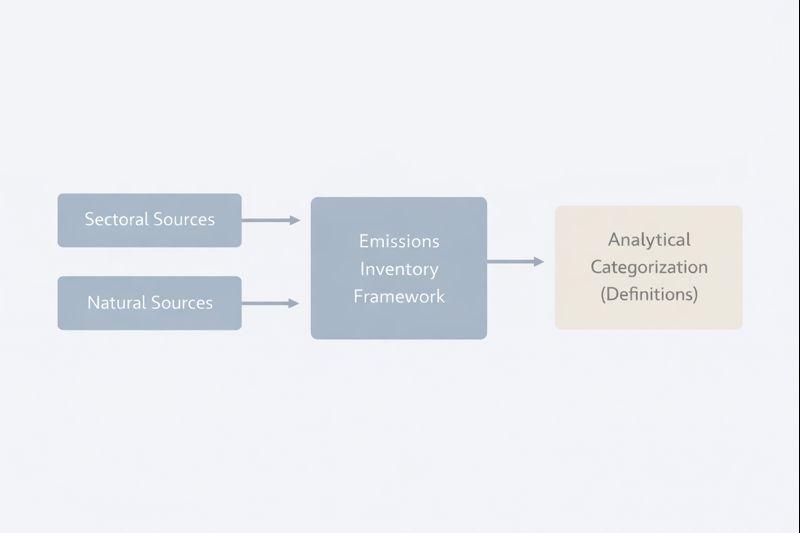
Air pollution exposure in India is driven by a combination of traffic emissions, industrial activity, construction dust, biomass burning, and dense urban development. These pollution sources contribute differently to PM2.5 and AQI levels across Indian cities.
During winter, many North Indian cities experience prolonged periods of poor air quality as weather conditions trap pollutants close to the ground. Cities such as Delhi frequently record PM2.5 levels far above World Health Organization (WHO) safety guidelines during severe pollution episodes.
Because exposure occurs repeatedly across daily life — during commuting, outdoor activity, and even indoors — long-term health risks become significantly higher in heavily polluted urban regions.
How Pollutants Reach Different Parts of the Body
| Pollutant | Main Target | Common Health Effect |
|---|---|---|
| PM2.5 | Lungs + Bloodstream | Heart disease, stroke |
| PM10 | Upper respiratory tract | Irritation, coughing |
| NO₂ | Airways | Asthma symptoms |
| Ozone | Lungs | Chest tightness |
| SO₂ | Airways | Breathing difficulty |
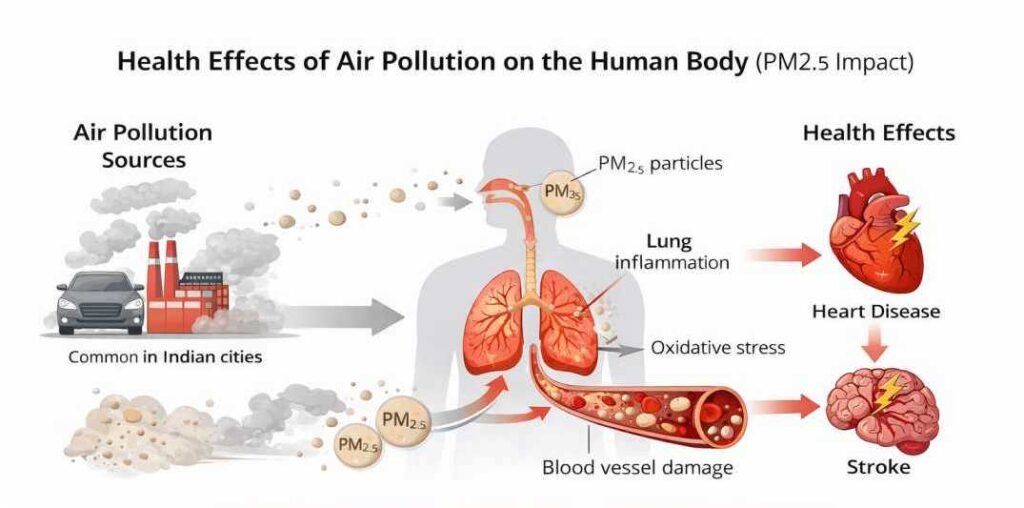
How Air Pollution Affects the Human Body
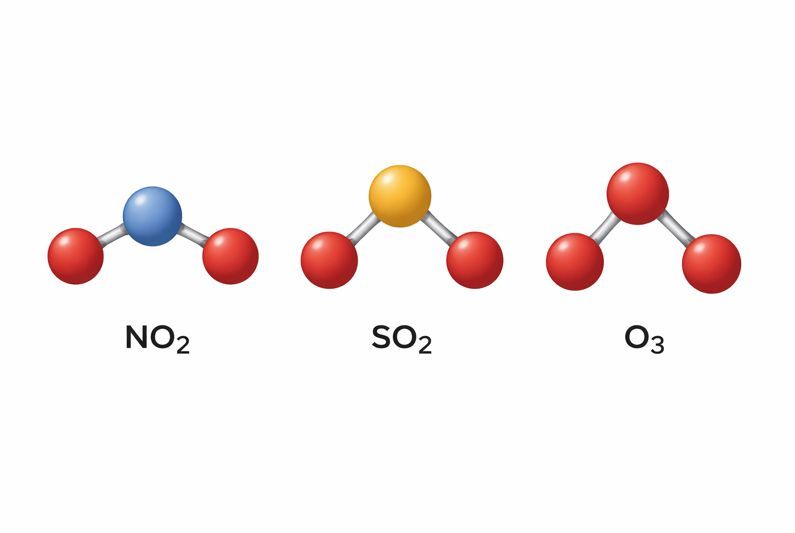
Air pollution contains a mixture of fine particles and harmful gases, including PM2.5, PM10, nitrogen dioxide (NO₂), sulfur dioxide (SO₂), ozone (O₃), and carbon monoxide (CO).
When polluted air is inhaled, larger particles are usually trapped in the nose and throat. However, fine particles such as PM2.5 can travel deep into the lungs and reach the alveoli, where oxygen exchange takes place. Some particles may also enter the bloodstream.
This exposure triggers inflammation and oxidative stress inside the body, affecting both the respiratory and cardiovascular systems over time. Repeated exposure can damage blood vessels, reduce lung function, and increase the risk of chronic diseases such as asthma, heart disease, stroke, and lung cancer.
Because PM2.5 particles are extremely small, their health effects are often gradual and difficult to notice immediately, especially during long-term exposure.
Key Concept
Air pollution does not affect every organ in the same way.
Large particles mainly irritate the nose and throat.
Fine particles like PM2.5 can reach the lungs and even enter the bloodstream, increasing the risk of diseases beyond the respiratory system.
Short-Term Health Effects of Air Pollution
Short-term exposure to polluted air can cause immediate health symptoms, especially during severe AQI conditions. Common effects include coughing, throat irritation, eye discomfort, headaches, fatigue, and shortness of breath.
People with asthma or other respiratory conditions are often more sensitive to pollution spikes and may experience worsening symptoms during severe episodes. Even healthy individuals can feel breathing discomfort or reduced exercise tolerance after several hours of exposure to heavily polluted air.
Health effects generally become more noticeable as pollution levels increase, particularly when AQI remains in the “Poor” or “Very Poor” category for extended periods.
| Exposure Duration | Typical Effect |
|---|---|
| Minutes–Hours | Eye, nose and throat irritation |
| Several Hours | Coughing and breathing discomfort |
| Days–Weeks | Asthma symptoms may worsen |
| Months | Reduced lung function |
| Years | Higher risk of heart disease, stroke and lung cancer |
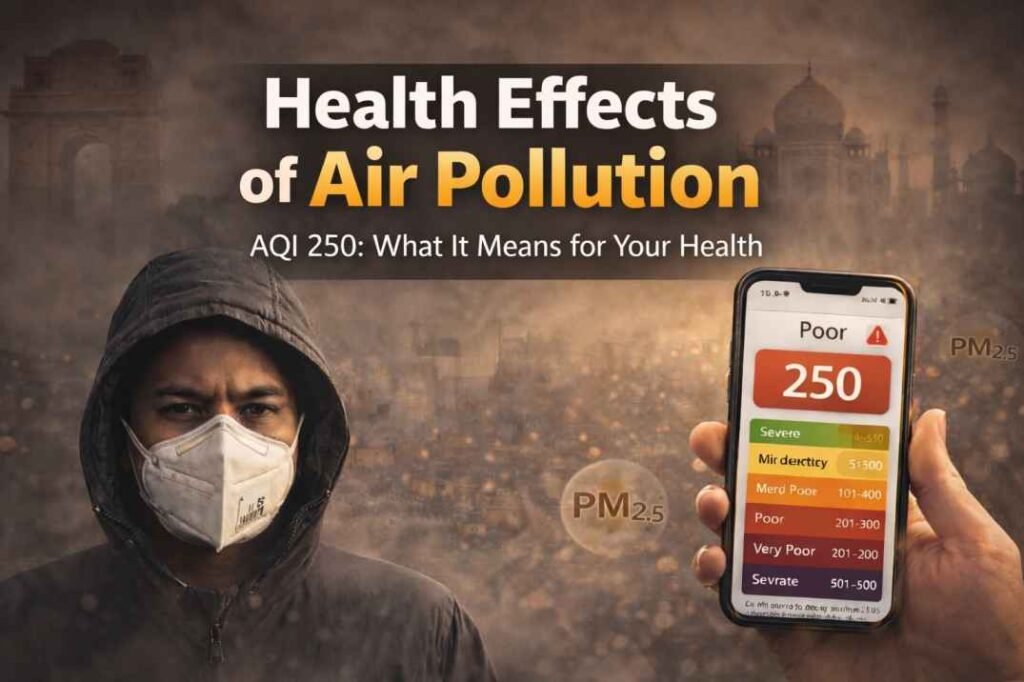
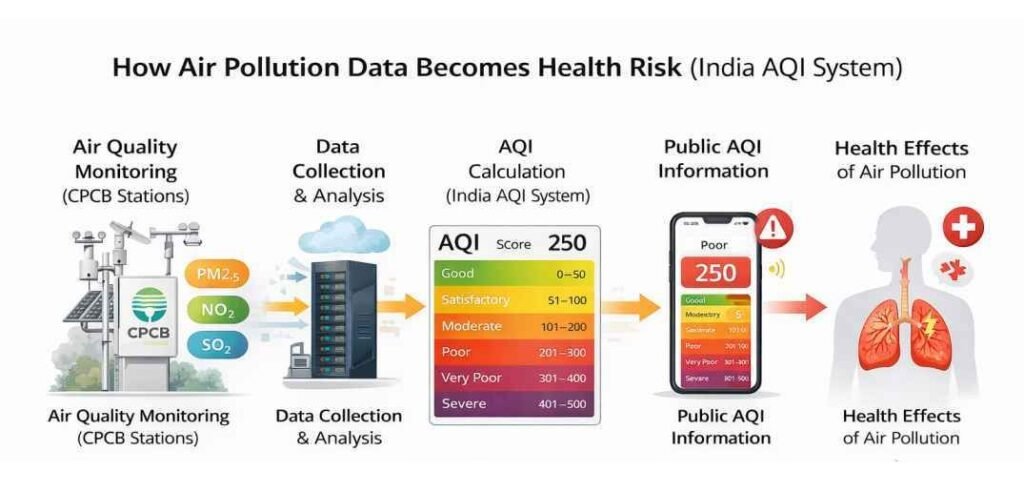
How AQI Levels Relate to Health Effects
| AQI | Health Meaning |
|---|---|
| 0–100 | Generally safe for most people. |
| 101–200 | Sensitive groups may experience symptoms during prolonged outdoor activity. |
| 201–300 | Many people may develop breathing discomfort with prolonged exposure. |
| 301+ | Everyone may experience health effects, with serious risks for sensitive groups. |
Higher AQI levels increase the risk of respiratory and cardiovascular stress, especially during prolonged exposure and winter pollution episodes. You can also learn what AQI ranges are generally considered safe for outdoor activity in our detailed AQI safety guide.
What Happens During an AQI 300 Day?
The following example shows how a day with an AQI above 300 can increase health risks, especially for children, older adults, and people with respiratory diseases.
High AQI (>300)
↓
PM2.5 enters lungs
↓
Inflammation develops
↓
Breathing becomes difficult
↓
Asthma symptoms worsen
↓
Outdoor activity should be minimized
Read our guide on What AQI Is Dangerous in India for a detailed explanation of AQI risk categories.
Why Exposure Duration Matters
Health risk depends not only on pollution levels, but also on how long a person is exposed to polluted air.
Short-term exposure may cause temporary irritation and breathing discomfort, while repeated exposure over months or years can gradually reduce lung function and increase the risk of chronic diseases. This cumulative effect explains why people living in heavily polluted cities face greater long-term health risks even when daily symptoms appear mild.
Common Misconception
Many people believe that one day of polluted air causes permanent damage.
In reality, the greatest health risk usually comes from repeated exposure over months or years, although extremely high pollution episodes can also trigger serious short-term health problems.
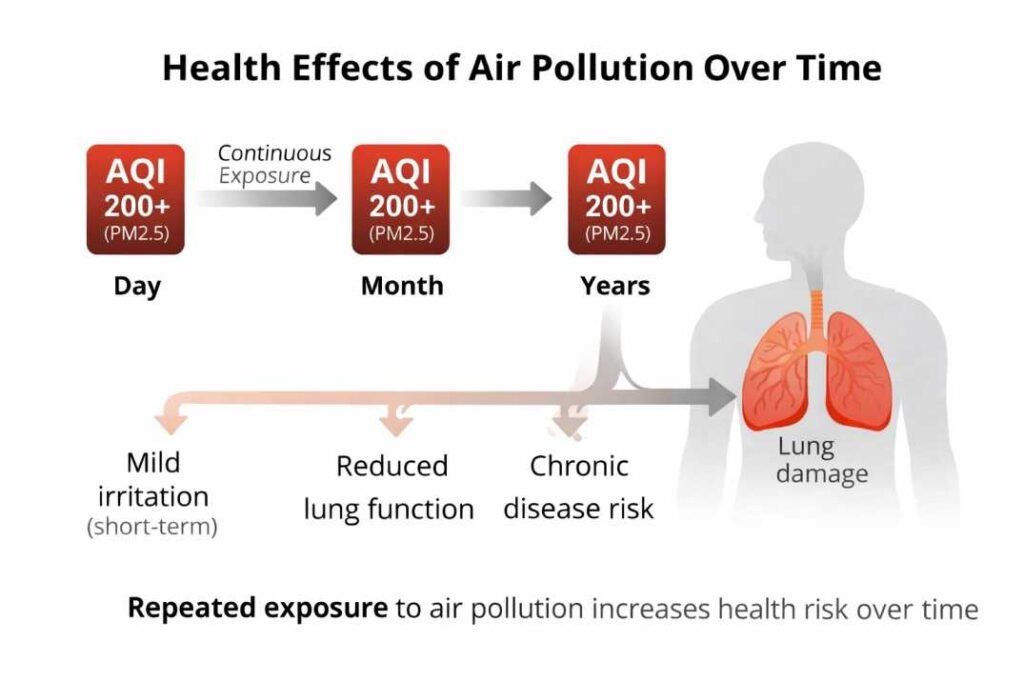
Long-term exposure to polluted air can gradually reduce lung function and increase the risk of chronic diseases, even when daily symptoms appear mild. This is one reason why prolonged exposure to AQI levels above 200 is considered a serious public health concern in many Indian cities.
Long-Term Health Effects of Air Pollution
Unlike short-term exposure, long-term exposure to air pollution can cause gradual and often irreversible damage to the body.
Repeated exposure to pollutants such as PM2.5 increases inflammation and stress inside the lungs and blood vessels over time. Even when symptoms appear mild, long-term exposure may slowly reduce lung function and increase the risk of chronic diseases.
Major long-term health risks include asthma, chronic bronchitis, heart disease, hypertension, stroke, and lung cancer. Long-term exposure is also associated with higher mortality risk and reduced life expectancy in heavily polluted regions.
Long-term exposure also affects the cardiovascular system, increasing the risk of heart disease and stroke.
Learn more about the major pollutants responsible for these diseases in our Criteria Pollutants Explained guide.
Does Air Pollution Reduce Life Expectancy?
Long-term exposure to air pollution has been linked to reduced life expectancy in many countries, including India. Fine particles such as PM2.5 increase the risk of heart disease, stroke, lung disease, and premature death. The overall impact depends on pollution levels, exposure duration, age, and existing health conditions.
Cardiovascular Effects (Often Overlooked)
Air pollution affects far more than the lungs. Fine particles such as PM2.5 can enter the bloodstream and trigger inflammation inside blood vessels, increasing stress on the cardiovascular system over time.
Long-term exposure to polluted air is associated with a higher risk of heart disease, high blood pressure, heart attacks, and stroke. Research also shows that repeated exposure to PM2.5 contributes significantly to cardiovascular mortality in heavily polluted regions.
Because these effects often develop gradually, air pollution is now considered a major but frequently underestimated cardiovascular health risk.
Did you know?
Air pollution contributes to millions of premature deaths worldwide every year, making it one of the leading environmental health risks according to the World Health Organization.
What to Do When AQI Is High
During severe pollution episodes, reducing outdoor exposure is one of the most effective ways to lower health risk. Avoid outdoor exercise near traffic-heavy areas when AQI levels remain high for long periods.
Using a well-fitted N95 mask, limiting time outdoors during peak pollution hours, and improving indoor air quality through proper ventilation or air purifiers may help reduce exposure. When AQI rises above 300, outdoor activity should be minimized as much as possible, especially for sensitive groups.
Indoor air pollution can also contribute significantly to long-term exposure, especially in poorly ventilated environments.
Health Effects on Vulnerable Groups
Air pollution affects some populations more severely than others. Children are especially vulnerable because their lungs are still developing and they breathe more rapidly than adults. Elderly individuals and people with asthma, COPD, or heart disease face a higher risk of severe symptoms and hospitalization during high pollution periods.
Pregnant women may also face increased health risks, including possible impacts on fetal development and birth outcomes. During severe AQI conditions, these groups are generally more sensitive to prolonged outdoor exposure.
Why Some Groups Face Higher Health Risks
| Group | Why Risk Is Higher |
|---|---|
| Children | Developing lungs |
| Older Adults | Reduced immunity |
| Pregnant Women | Fetal development |
| Asthma Patients | Sensitive airways |
| Heart Patients | Cardiovascular stress |
Common Diseases Linked to Air Pollution
Long-term exposure to air pollution is associated with a higher risk of several respiratory and cardiovascular diseases. Common conditions linked to prolonged pollution exposure include asthma, chronic bronchitis, COPD, heart disease, stroke, and lung cancer.
Research also suggests possible links between air pollution and diabetes, adverse pregnancy outcomes, and certain neurological disorders, although evidence for some emerging health effects is still developing.
Can Healthy People Be Affected?
Yes. Air pollution does not affect only people with existing health conditions. Even healthy adults may experience eye irritation, headaches, coughing, temporary lung inflammation, and reduced exercise tolerance during periods of high pollution. While these effects are often temporary, repeated exposure over time may increase the risk of long-term respiratory and cardiovascular diseases.
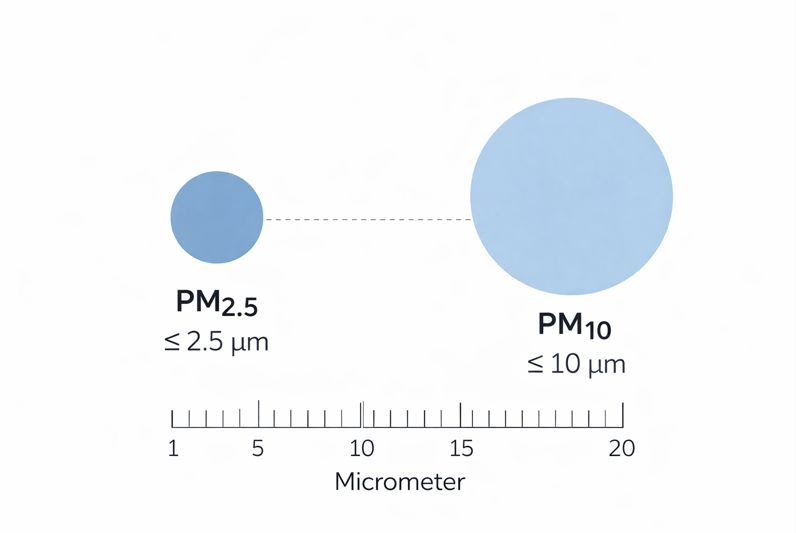
Why Fine Particles (PM2.5) Are Dangerous
PM2.5 particles are extremely small — roughly 30 times smaller than the width of a human hair. Because of their size, they can bypass many of the body’s natural respiratory defenses and travel deep into the lungs.
Some particles may also enter the bloodstream, triggering inflammation and oxidative stress that affect multiple organs over time. Long-term exposure to PM2.5 is strongly associated with respiratory disease, cardiovascular disease, stroke, and increased mortality risk.
In many Indian cities, PM2.5 levels frequently exceed World Health Organization (WHO) safety guidelines, especially during winter pollution episodes. This makes PM2.5 one of the most important pollutants in urban air quality management.
Pollution Exposure Patterns in India
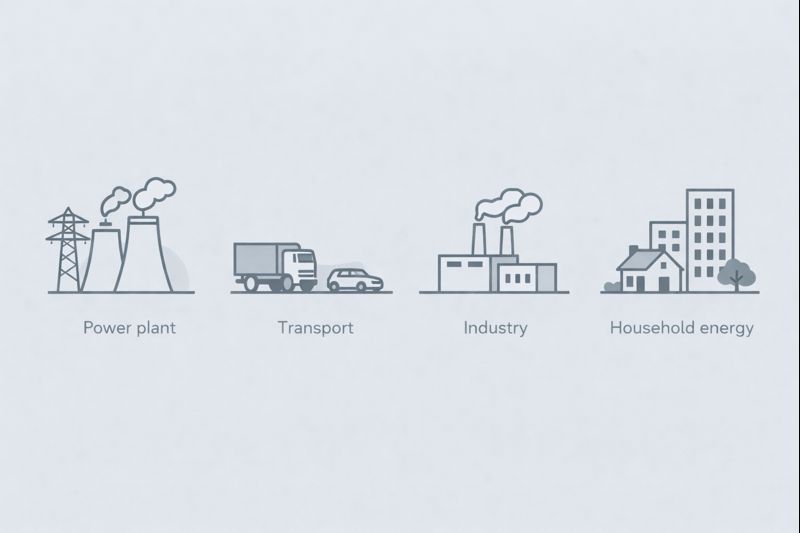
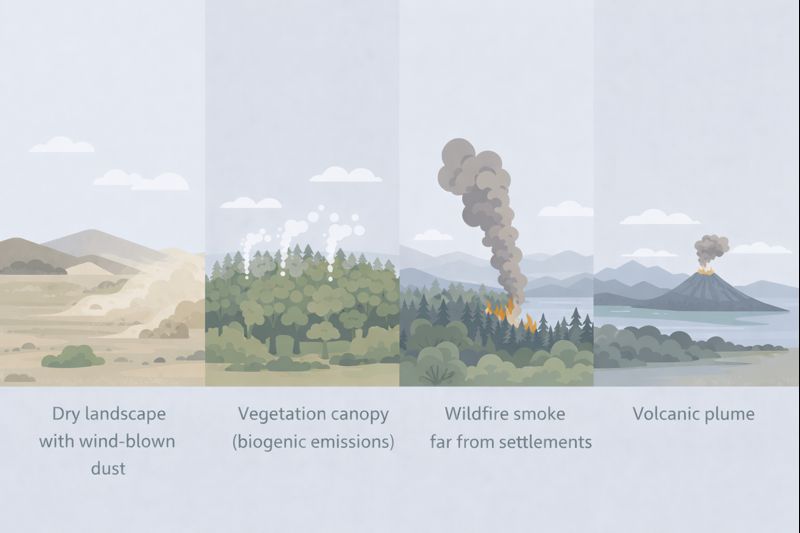
Air pollution exposure in India occurs across both outdoor and indoor environments. Outdoor exposure is driven by traffic emissions, industrial activity, construction dust, and seasonal biomass burning, while indoor exposure may come from cooking smoke, poor ventilation, dust, and household fuel use.
In densely populated urban regions, repeated daily exposure during commuting, outdoor activity, and indoor living conditions can significantly increase long-term health risks. Seasonal pollution spikes during winter and crop-burning periods further intensify exposure levels across many North Indian cities.
Teacher Tip
Ask students to compare today’s AQI with the AQI table in this guide and identify which groups are most likely to experience health effects. Encourage them to explain their answers using scientific reasoning rather than personal opinion.
Classroom Activity
Look at today’s AQI in your city.
Predict
- Which health effects are most likely?
- Which people should avoid outdoor exercise?
Discuss your answers using the AQI table above.
Conclusion
Air pollution affects far more than the lungs. Repeated exposure to pollutants such as PM2.5 increases the risk of respiratory and cardiovascular diseases, especially in cities with persistently high AQI levels.
Understanding AQI, reducing exposure during severe pollution periods, and improving indoor air quality can help lower long-term health risks.
Key Takeaways
✔ PM2.5 causes the greatest long-term health risk.

✔ Health effects depend on both pollution level and exposure duration.

✔ Children and elderly people are more vulnerable.

✔ High AQI does not affect everyone equally.

✔ Reducing exposure can significantly lower health risks.
✔ Long-term exposure is generally more harmful than occasional short-term exposure.
Frequently Asked Questions (FAQ)
How does air pollution affect the lungs and heart?
Air pollution increases inflammation inside the lungs and blood vessels, raising the risk of respiratory and cardiovascular diseases over time.
What are the symptoms of air pollution exposure?
Common symptoms include coughing, throat irritation, eye discomfort, headaches, fatigue, and shortness of breath during high AQI conditions.
Does air pollution affect healthy adults?
Yes. Even healthy adults can experience eye irritation, coughing, headaches, reduced exercise tolerance, and temporary breathing discomfort during periods of high air pollution. Repeated long-term exposure may also increase the risk of chronic respiratory and cardiovascular diseases.
Which air pollutant is most harmful?
PM2.5 is generally considered the most harmful air pollutant because its tiny particles can travel deep into the lungs and may enter the bloodstream, affecting multiple organs over time.
Can indoor air pollution cause similar health problems?
Yes. Indoor air pollution from cooking smoke, poor ventilation, household fuels, and dust can cause respiratory irritation and contribute to long-term health risks, especially with prolonged exposure.
Can air pollution affect mental health?
Emerging research suggests that long-term exposure to air pollution may be associated with a higher risk of anxiety, depression, and cognitive decline. However, the strongest scientific evidence remains for its effects on the lungs, heart, and blood vessels.
Why is PM2.5 considered dangerous?
PM2.5 particles are small enough to travel deep into the lungs and may enter the bloodstream, affecting multiple organs over time.
Can long-term exposure cause permanent health damage?
Yes. Repeated exposure to polluted air over several years can gradually reduce lung function and increase the risk of chronic diseases such as asthma, heart disease, stroke, and lung cancer.
How long does it take for air pollution to affect the body?
Some health effects, such as eye irritation, coughing, or breathing discomfort, can occur within hours of exposure. More serious conditions, including reduced lung function and heart disease, usually develop after repeated exposure over months or years.
Does wearing an N95 mask completely prevent pollution exposure?
No. A properly fitted N95 mask can significantly reduce exposure to fine particles such as PM2.5, but it does not provide complete protection. Reducing outdoor exposure during high AQI periods and improving indoor air quality are also important ways to lower health risks.
References
- World Health Organization (WHO) – Air Pollution and Health
https://www.who.int/health-topics/air-pollution - Health Effects Institute (HEI) – State of Global Air https://www.stateofglobalair.org/
- Central Pollution Control Board (CPCB) – National Air Quality Index
https://cpcb.nic.in/national-air-quality-index/ - Global Burden of Disease (GBD) – Health Effects of Air Pollution in India
https://www.healthdata.org/research-analysis/library/india-state-level-disease-burden-initiative-air-pollution - The Lancet Planetary Health – Air Pollution and Cardiovascular Disease
https://www.thelancet.com/journals/lanplh/home - Ministry of Health and Family Welfare (MoHFW), India – Air Pollution Health Advisory
https://www.mohfw.gov.in/ - US EPA – Health and Environmental Effects of Particulate Matter (PM2.5) https://www.epa.gov/pm-pollution/health-and-environmental-effects-particulate-matter-pm