This category examines air pollution through an educational lens, focusing on sources, atmospheric pollutants, measurement frameworks, health and environmental impacts, and regulatory responses. Articles draw on scientific research, air quality monitoring data, and policy frameworks to explain how air pollution is assessed, managed, and contextualized, without providing personal exposure advice or behavioral guidance.
Air pollution levels in India are commonly reported through PM2.5 measurements, AQI categories, and pollution monitoring dashboards. During severe pollution episodes in cities such as Delhi, PM2.5 levels can rise far above recommended limits, especially during winter months.
These pollution values are usually interpreted using two major reference systems:
India’s National Ambient Air Quality Standards (NAAQS) developed by the Central Pollution Control Board (CPCB)
Global Air Quality Guidelines (AQG) published by the World Health Organization (WHO)
Although both systems are widely used in pollution reporting, they serve different purposes. CPCB standards are used within India’s national monitoring and reporting system, while WHO guideline values function as global scientific reference levels based on international health research.
This article explains how CPCB standards and WHO guidelines differ, how they are used in air quality reporting, and why the same pollution measurement may be interpreted differently across monitoring platforms and AQI systems.
What Are Pollution Standards in India? (Quick Answer)
Pollution standards in India define the maximum concentration limits for pollutants such as PM2.5, PM10, nitrogen dioxide (NO₂), and sulphur dioxide (SO₂) in outdoor air.
These standards are part of India’s National Ambient Air Quality Standards (NAAQS) system managed by the Central Pollution Control Board (CPCB).
For example:
PM2.5 annual limit: 40 µg/m³
PM10 annual limit: 60 µg/m³
These values are used in air quality monitoring systems and AQI reporting across Indian cities.
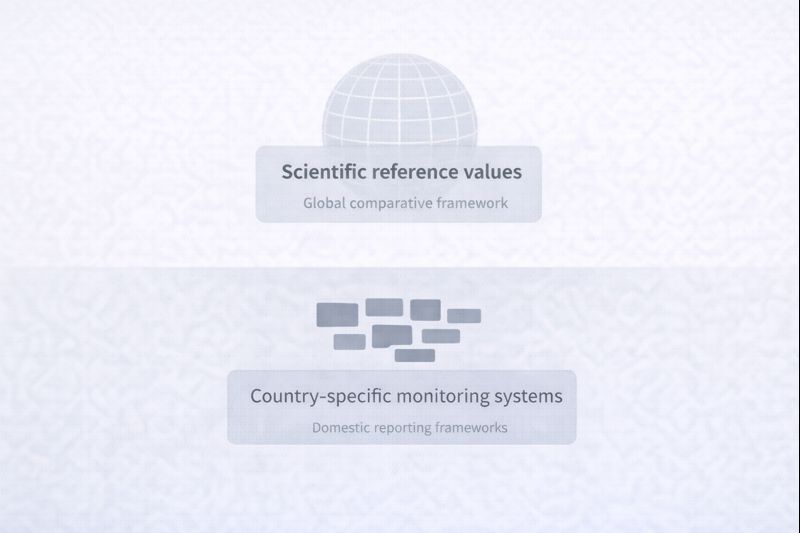
Why Indian Pollution Standards Exist
Conceptual illustration showing institutional factors that shape how pollution standards and guideline values are defined.
Air pollution cannot always be seen directly, so monitoring systems use standardized pollution limits to measure and compare pollutant levels across different locations.
In India, CPCB standards help monitoring stations report pollutants such as PM2.5, PM10, NO₂, and SO₂ using consistent measurement and averaging methods.
These standards also make it easier to compare pollution data between cities and across different time periods. For example, pollution readings from Delhi and Mumbai can be interpreted more consistently when the same monitoring standards are used nationwide.
WHO guideline values serve a different role by providing global scientific reference levels based on international health research.
CPCB Air Pollution Standards in India (NAAQS)
India’s air pollution standards are defined under the National Ambient Air Quality Standards (NAAQS) system managed by the Central Pollution Control Board (CPCB).
These standards are used to measure and compare major pollutants in outdoor air, including:
PM2.5
PM10
Nitrogen dioxide (NO₂)
Sulphur dioxide (SO₂)
Ozone (O₃)
Carbon monoxide (CO)
Monitoring stations across India use these standards to report pollution levels using common averaging periods such as annual averages and 24-hour averages.
For example, PM2.5 data collected from monitoring stations in Delhi, Mumbai, Kolkata, and other cities is interpreted using CPCB reference standards before being displayed through AQI systems and public reporting platforms.
This helps pollution data remain more consistent and comparable across different cities and monitoring networks.
For a detailed explanation of these pollutants, see PM2.5 explained in India and related pollutant guides.
National Air Quality Standards (India)
This difference does not mean the two systems are used in the same way.
Pollutant
Annual Limit (µg/m³)
24-Hour Limit
Used For
PM2.5
40
60
Fine particle monitoring
PM10
60
100
Dust and coarse particle monitoring
NO₂
40
80
Traffic and combustion pollution monitoring
SO₂
50
80
Industrial emission monitoring
The table below compares selected annual pollutant limits from CPCB standards and WHO guideline values.
How CPCB Standards Are Used in Monitoring and Reporting
Conceptual illustration showing how pollution standards function within environmental monitoring and reporting systems.
CPCB air pollution standards are applied within national monitoring systems to structure how air quality data is collected, processed, and presented. Measurements recorded at monitoring stations are aggregated using defined averaging rules before being published in datasets or summarised into commonly used reporting formats.
In public reporting contexts, raw concentration data is often converted into categories or index values. This process is shaped by CPCB reference frameworks, which provide consistency in how observed pollution conditions are described.
These systems are designed to support comparability across regions and time periods rather than to provide individual-level interpretation of exposure or risk.
CPCB standards are periodically reviewed in relation to evolving scientific assessment practices, monitoring infrastructure, and data availability. Revisions typically involve changes in reporting conventions, averaging structures, or pollutant inclusion, reflecting institutional monitoring priorities.
WHO Air Quality Guidelines (AQG)
The World Health Organization (WHO) publishes global air quality guideline values for pollutants such as PM2.5, PM10, ozone (O₃), nitrogen dioxide (NO₂), and sulphur dioxide (SO₂).
These guideline values are based on international health research and are often lower than India’s CPCB standards.
For example:
WHO annual PM2.5 guideline: 5 µg/m³
CPCB annual PM2.5 standard: 40 µg/m³
This difference does not mean the two systems are used in the same way.
WHO guideline values mainly serve as global scientific reference levels, while CPCB standards are used within India’s national monitoring and AQI reporting systems.
Because WHO values are much lower, pollution levels in many Indian cities may exceed WHO guideline levels even when they are being interpreted under India’s own reporting framework.
Conceptual illustration of WHO guidelines as global reference frameworks
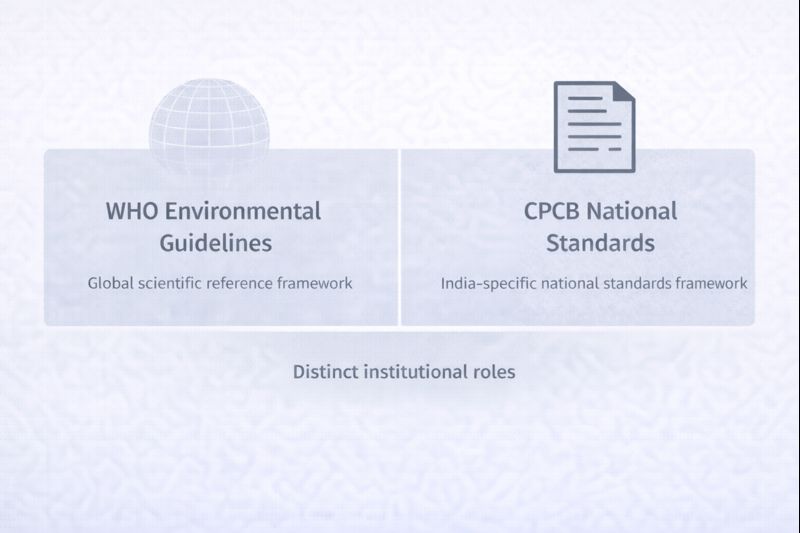
CPCB vs WHO: Understanding Differences Without Ranking
Comparisons between CPCB standards and WHO guideline values are common, but numerical differences are often interpreted without sufficient institutional context. CPCB standards and WHO guidelines are designed to serve different purposes.
CPCB standards are structured to operate within India’s domestic monitoring and reporting systems. They function as institutional reference benchmarks that support consistent description of observed pollution conditions across diverse geographic settings.
WHO guideline values, by contrast, are designed as global scientific reference points derived from international evidence synthesis. They are not embedded within national monitoring systems and do not carry institutional or legal authority within India.
Because these frameworks serve different functions, differences in numerical values do not automatically indicate that one system is more accurate, more protective, or more appropriate than the other. Differences reflect variations in institutional design, averaging conventions, monitoring context, and policy objectives.
Example: Delhi Pollution Levels vs Standards
During winter in Delhi:
PM2.5 levels often exceed 200 µg/m³
CPCB annual standard: 40 µg/m³
WHO guideline: 5 µg/m³
This shows how real-world pollution levels can be significantly higher than both national standards and global guideline values.
What Do These Differences Mean in Practice?
The differences between CPCB standards and WHO guideline values become easier to understand when real pollution levels are compared with both systems.
For example, during severe winter pollution episodes in Delhi, PM2.5 levels at some monitoring stations may rise above 200–300 µg/m³.
In comparison:
CPCB annual PM2.5 standard: 40 µg/m³
WHO annual PM2.5 guideline: 5 µg/m³
This means pollution levels recorded during peak winter conditions can become several times higher than both India’s national standards and WHO guideline values.
Similar pollution patterns are also observed in cities such as Ghaziabad, Noida, Kanpur, and other parts of the Indo-Gangetic Plain during winter months.
These comparisons help explain why AQI values often remain in “Very Poor” or “Severe” categories during major pollution episodes in North India.ity. For instance, PM2.5 concentrations above 250 µg/m³ during severe winter pollution events can push AQI values into the “Severe” category at several monitoring stations in North India.
Comparison of CPCB NAAQS Standards and WHO Air Quality Guidelines
The conceptual differences between the two frameworks can be summarized as follows:
Framework
Role
Scope
CPCB NAAQS
National regulatory standards
India monitoring systems
WHO AQG
Global scientific guideline values
International reference
Conceptual illustration showing CPCB national standards and WHO guidelines as parallel but distinct frameworks.
Why “Stricter” vs “Looser” Comparisons Can Be Misleading
WHO guideline values for pollutants such as PM2.5 are lower than India’s CPCB standards, but the two systems are designed for different purposes.
CPCB standards are used within India’s national air quality monitoring and AQI reporting system. WHO guideline values, by contrast, are global scientific reference levels based on international health research.
Because these systems serve different roles, numerical differences alone do not fully explain how pollution data is monitored or interpreted in practice.
For example, the same PM2.5 measurement may appear in AQI reporting under CPCB standards while also being compared with WHO guideline values in international pollution discussions.
This is why pollution standards should be understood within their own monitoring and reporting context rather than treated as simple “better” or “worse” systems.
How Standards Appear in AQI Reporting and Public Communication
Most people encounter pollution standards through AQI apps, CPCB dashboards, weather platforms, and news reports rather than through technical monitoring documents.
In India, pollution measurements collected from monitoring stations are converted into AQI categories such as:
Good
Moderate
Poor
Very Poor
Severe
For example, during winter pollution episodes in Delhi, PM2.5 concentrations may rise high enough for AQI systems to classify air quality as “Very Poor” or “Severe.”
This process uses CPCB pollution standards, pollutant breakpoints, and averaging methods to convert raw monitoring data into public AQI values.
Different reporting platforms may also reference WHO guideline values for comparison. Because of this, the same pollution measurement may sometimes appear differently across AQI dashboards, reports, or international pollution trackers.
These differences usually reflect different reporting systems and averaging methods rather than contradictions in the monitoring data itself.
To understand how pollution measurements are converted into AQI categories, see AQI explained in India.
Conceptual illustration showing how environmental standards and guidelines structure reported air quality information.
Key Takeaways for Readers
CPCB standards are used in India’s air quality monitoring and AQI reporting systems.
WHO guideline values are global scientific reference levels based on international health research.
PM2.5 and PM10 pollution levels in many Indian cities often exceed both CPCB standards and WHO guideline values during severe pollution periods.
AQI categories such as “Poor,” “Very Poor,” and “Severe” are based on pollution measurements collected from monitoring stations.
Differences between CPCB and WHO values reflect different monitoring and reporting purposes rather than simple “better” or “worse” standards.
Understanding these standards makes it easier to interpret AQI values, pollution dashboards, and air quality reports published across India.
Soumen Chakraborty is the founder of GreenGlobe25, an independent educational platform focused on air pollution systems and air quality research in India. His work centers on explaining pollution-related concepts, standards, and institutional frameworks using publicly available data and authoritative sources.
Content published on GreenGlobe25 is written as neutral, research-based educational explainers. It draws on materials from organizations such as the Central Pollution Control Board (CPCB), the World Health Organization (WHO), and other institutional bodies, and follows a documented fact-checking and source-attribution process. The material is descriptive in nature and does not provide professional, medical, or policy advice.
Educational Context Note: This article explains institutional and scientific frameworks for pollution measurement and reporting. It does not provide personal health, safety, or compliance advice.
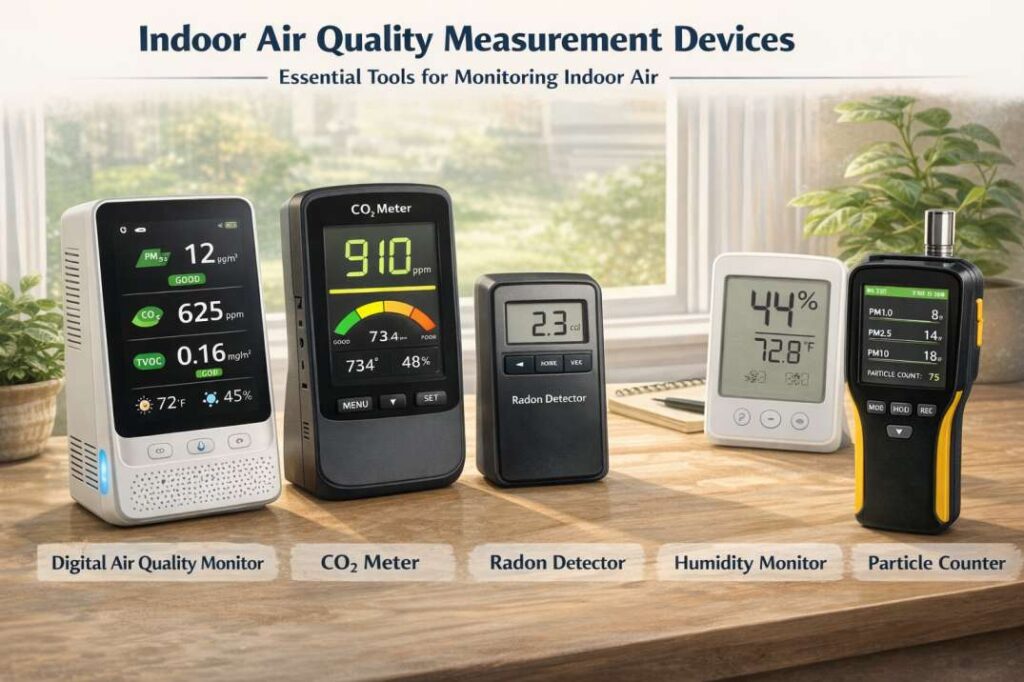
Measurement studies typically monitor particulate matter, combustion-related gases, and volatile organic compounds using specialised sampling instruments.
Introduction
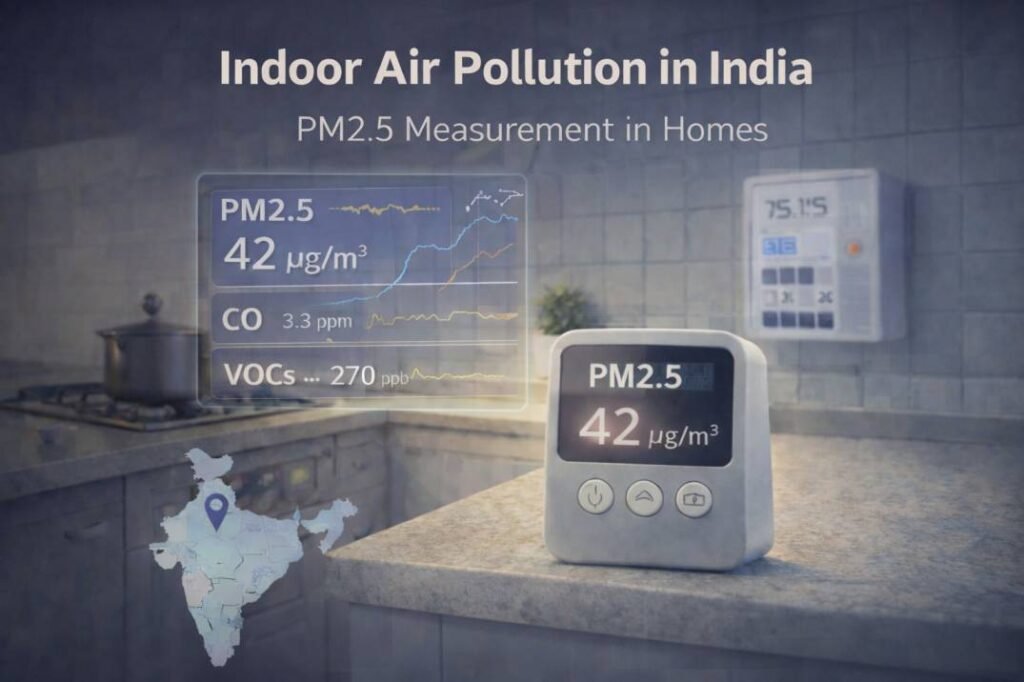
Indoor air pollution refers to the presence of particulate matter and chemical pollutants inside enclosed environments such as homes, offices, and other buildings. In India, indoor air pollution is primarily studied through household exposure research and academic monitoring campaigns rather than continuous national monitoring networks. As a result, much of the available evidence comes from field measurement studies that examine pollutant concentrations, emission sources, and exposure patterns in indoor environments.
Unlike ambient (outdoor) air pollution, which is monitored through institutional observation networks in many countries, indoor air pollution in India is typically documented through targeted household studies and research-based exposure assessments. For foundational definitions and classification boundaries, refer to: What is Air Pollution in India?
Indoor environments vary widely by housing type, ventilation characteristics, household activity patterns, and regional climate conditions. Because of this variability, indoor pollutant concentrations often show greater fluctuation than ambient outdoor datasets, and interpretation depends strongly on sampling duration, measurement location, and behavioural context.
This article explains how indoor air pollution is measured in India in 2025, which pollutants are commonly assessed, which instruments are used in research studies, and what methodological limitations should be considered when interpreting indoor air quality datasets.
What Indoor Air Pollution Means for You
Indoor pollution can be higher than outdoor levels in India
Cooking and outdoor AQI both affect your home air
Even if AQI is in the ‘Moderate’ category (CPCB), indoor exposure can still be high.”
What is Indoor Air Pollution in India?
Indoor air pollution in India refers to the presence of harmful pollutants like PM2.5, carbon monoxide, and VOCs inside homes and buildings. It is mainly caused by cooking emissions, household fuels, and outdoor pollution entering indoor spaces, especially in urban areas with high AQI levels.
Indoor Air Pollution in India – Real Exposure Context
In cities like Delhi, indoor PM2.5 levels can exceed 150–300 µg/m³ during cooking
CPCB data shows outdoor pollution often enters homes, especially in winter
Studies show Indian households using solid fuels face significantly higher exposure levels
Indoor air pollution in India is not only caused inside homes but also influenced by outdoor AQI levels, especially in polluted cities.
Indoor Air Quality in India vs Household Air Pollution (Terminology)
Indoor air pollution and indoor air quality (IAQ) are frequently used interchangeably, but the terms reflect different framing. Indoor air quality is often used as a descriptive measurement term that refers to pollutant concentration levels inside enclosed spaces. Indoor air pollution is used more explicitly when indoor pollutant concentrations are treated as a contamination condition.
A related term, household air pollution (HAP), is widely used in public health literature. In Indian contexts, HAP typically refers to indoor exposure conditions linked to household energy use, particularly cooking and heating practices, and may involve specific focus on fuel type, kitchen design, and exposure duration.
These distinctions are important because many Indian studies are not designed to describe indoor environments in general, but rather to quantify pollutant exposure patterns in specific household settings.
Indoor Air Pollution as an Observational Category
As in ambient air pollution research, indoor air pollution is best understood as an observational concept. It refers to measurable pollutant presence in indoor air, documented through concentration measurements, chemical sampling, or particle monitoring.
Indoor air pollution datasets typically describe:
pollutant concentration levels inside rooms or kitchens
variation during activity periods such as cooking
persistence of pollutants across hours or days
the relationship between indoor and outdoor pollutant infiltration
Unlike ambient air monitoring systems, indoor measurement coverage is not standardised nationally. Most indoor datasets are produced through research sampling and therefore vary in methodology and comparability.
How Indoor Air Pollution Is Measured (Simple Explanation)
Indoor air pollution is measured using:
PM2.5 sensors (real-time monitoring)
Gas sensors for CO, NO2, SO2
Passive samplers for long-term measurement
Laboratory analysis for VOCs
These methods are used in Indian household studies to measure both short-term pollution peaks and long-term exposure levels.
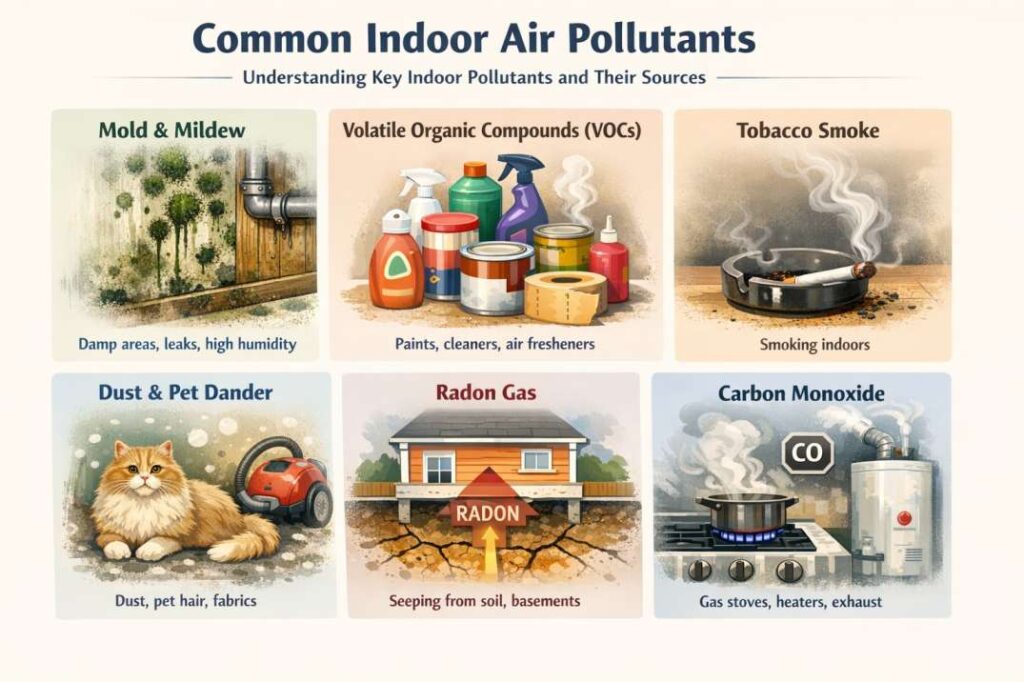
Pollutants Commonly Measured in Indian Indoor Studies
Indoor air pollution studies in India typically focus on particulate matter, combustion-related gases, and volatile organic compounds. Measurement priorities depend on study objectives, household conditions, and instrument availability. For pollutant-specific definitions used in India’s ambient reporting framework,see PM2.5 and other criteria pollutants.
Illustrative categories shown are commonly included in indoor air quality studies and are not exhaustive or prescriptive.
Common Indoor Pollutants Measured in Indian Indoor Air Studies
Pollutant
Typical Unit
Measurement Method
Common Indoor Sources
Health Relevance
PM₂.₅
µg/m³
Gravimetric sampling, optical sensors
Cooking emissions, outdoor infiltration
Respiratory and cardiovascular effects
PM₁₀
µg/m³
Gravimetric sampling, optical monitoring
Dust resuspension, construction influence
Airway irritation
CO
ppm / mg/m³
Electrochemical sensors
Incomplete combustion from cooking fuels
Reduces oxygen delivery in blood
NO₂
µg/m³ / ppb
Passive samplers, chemiluminescence
Gas stoves, traffic infiltration
Respiratory irritation
SO₂
µg/m³
Passive samplers, gas analysers
Combustion emissions, industrial influence
Airway inflammation
VOCs
µg/m³
Sorbent tubes + laboratory analysis
Household products, solvents
Chemical irritation and exposure risk
Note: Sources vary by building type, ventilation conditions, household practices, and regional climate. Categories shown above are illustrative rather than exhaustive.
Measurement Instruments and Sampling Approaches
Indoor air pollution measurement studies in India generally follow two methodological approaches: integrated sampling and real-time monitoring.
Integrated Sampling (Filter-Based and Passive Sampling)
Integrated sampling methods measure pollutant concentration over a defined time window. For particulate matter, gravimetric sampling is widely used, where air is drawn through a filter and mass concentration is calculated from collected particle mass and sampled air volume.
For gases such as NO₂ and SO₂, passive samplers are often used in indoor studies. These devices absorb pollutants over a fixed period, after which the sampler is analysed in a laboratory.
Integrated sampling methods are valuable because they provide stable average concentration estimates and support chemical analysis, but they may not capture short-duration peaks.
Real-Time Monitoring (Continuous Sensors and Portable Devices)
Real-time monitoring instruments measure concentrations continuously or at short intervals. These are used to document:
rapid concentration increases during cooking
hourly variability inside rooms
indoor-outdoor infiltration patterns
Low-cost optical PM sensors are increasingly used in indoor studies, though their accuracy depends on calibration and environmental conditions such as humidity. CO is often measured using portable electrochemical sensors due to cost and deployment feasibility.
Example: Indoor Air Pollution Measurement in a Household Study
In many Indian exposure studies, researchers place particulate matter monitors inside kitchens or living areas to measure indoor pollutant concentrations.
For example:
A portable PM₂.₅ sensor may be placed at breathing height inside a kitchen.
Measurements are recorded continuously during cooking periods.
Researchers compare concentration peaks during cooking with background levels recorded during non-activity periods.
Outdoor measurements may also be collected to understand how much pollution enters the home from surrounding environments.
Such monitoring designs help researchers identify short-term exposure peaks as well as daily average concentration levels.
Examples of instruments used in indoor air measurement studies.
Sampling Duration in Indoor Studies (Short-Term vs 24-Hour vs Seasonal)
A major factor shaping indoor air pollution interpretation is sampling duration. Indian indoor datasets commonly use one of the following approaches:
Short-Term Activity Monitoring (Minutes to Hours)
Many studies monitor indoor PM₂.₅ or CO during cooking periods. These measurements capture peak concentration episodes and are useful for identifying short-term exposure patterns.
However, peak-period measurements should not be interpreted as representative of full-day indoor air quality.
8–12 Hour Sampling (Partial Day Observation)
Some studies use half-day monitoring to represent daytime household activity. This approach can capture multiple emission events but remains incomplete without overnight measurements.
24-Hour Integrated Sampling (Daily Average)
24-hour sampling provides a more comparable dataset for interpreting average indoor concentration levels. It is often used in epidemiological and exposure assessment contexts because it reduces the influence of short-term peaks.
Multi-Day or Seasonal Monitoring
Higher-quality studies repeat measurements across multiple days or across seasons. This is particularly important in India because:
ventilation changes across monsoon and winter periods
cooking and heating patterns differ seasonally
outdoor infiltration varies with meteorology
Sampling duration should always be considered before comparing results across studies or regions. Sampling duration is also important when interpreting air quality indicators reported in ambient monitoring systems such as the Air Quality Index (AQI).
Data Interpretation Challenges in Indoor Air Pollution
Indoor air pollution datasets require cautious interpretation because concentration levels depend on both measurement design and household variability.
High Variability Across Household Types
Indoor environments differ substantially by:
housing materials
kitchen design and enclosure
window opening practices
fuel type and combustion efficiency
occupancy density
As a result, pollutant levels reported in one indoor study may not represent broader regional conditions.
Indoor vs Outdoor Interaction
Indoor pollutant concentrations can originate from indoor emission sources, outdoor air infiltration, or a combination of both. In many Indian settings, particulate matter levels indoors reflect a combination of cooking emissions and infiltration from ambient PM pollution, especially in high-traffic urban regions.
Peak vs Average Concentrations
Several Indian studies report PM₂.₅ concentrations exceeding 100–300 µg/m³ during cooking or enclosed activity periods. Reported ranges differ significantly across study designs, seasons, kitchen configurations, and fuel types, and such values often reflect peak cooking-period measurements rather than full-day averages. Such peak-period concentration ranges are consistent with exposure patterns documented in WHO household air pollution evidence reviews and related measurement literature from Indian household exposure studies.
WHO indoor air quality guideline documentation on household fuel combustion is commonly used as a benchmark reference when interpreting Indian exposure datasets.
For interpretation, it is essential to distinguish:
peak exposure windows
daily average concentrations
multi-day averages
Indoor Air Pollution and CPCB Reporting Frameworks (AQI and NAAQS Boundaries)
India’s National Air Quality Index (AQI), introduced by CPCB in 2014, translates monitored ambient pollutant concentrations into standardised air quality categories for reporting. For a detailed breakdown of how CPCB converts pollutant concentrations into index categories, refer to: how AQI is calculated in India.
India’s National Ambient Air Quality Standards (NAAQS) define benchmark concentration limits for regulated pollutants in ambient outdoor air. These standards are used for regulatory assessment and national reporting, but they are not designed as indoor air quality standards. For benchmark comparison between India’s NAAQS standards and WHO guideline values, see: CPCB vs WHO Air Pollution Standards in India.
This distinction is important because indoor air pollution studies may use the same concentration units as ambient monitoring (such as µg/m³), but indoor measurements are typically influenced by household activities, ventilation conditions, and building characteristics. As a result, indoor concentration values cannot be interpreted as direct equivalents of ambient compliance benchmarks without careful methodological context.
Is AQI Used for Indoor Air Quality?
No. India’s AQI system, developed by CPCB, is designed for outdoor air pollution monitoring. Indoor air quality does not have a standardized national index and depends on household conditions, ventilation, and indoor pollution sources.
Indoor vs Ambient Measurement Comparability
Indoor air pollution data cannot be interpreted as directly comparable to ambient monitoring datasets without methodological context.
Ambient monitoring systems such as NAMP and CAAQMS:
use standardised station locations
follow institutional measurement protocols
produce comparable long-term datasets
Indoor studies, in contrast:
vary by sampling location (kitchen, bedroom, living room)
differ in sampling height and placement
differ in ventilation and occupancy patterns
may capture activity peaks rather than average conditions
Indoor datasets are therefore most useful for understanding exposure patterns and indoor environment variability rather than for producing nationwide comparability in the same way as CPCB ambient datasets.
For example, during winter in Delhi, AQI frequently reaches ‘Severe’ levels (300+), increasing indoor pollution infiltration.
What These PM2.5 Levels Mean in Real Life
100–300 µg/m³ during cooking = very high short-term exposure
Indoor pollution can exceed outdoor AQI levels in Indian homes
Long exposure increases health risk, especially for children
Key Takeaways
• Indoor air pollution in India is mainly documented through research studies and household exposure assessments, rather than continuous national monitoring networks. • PM₂.₅ is the most frequently measured indoor pollutant, as it indicates combustion-related exposure and particulate infiltration. • Measurement approaches typically include gravimetric sampling, passive gas samplers, and real-time sensor monitoring. • Indoor pollutant concentrations vary significantly depending on household activities, ventilation, building characteristics, and outdoor pollution infiltration. • Interpretation of indoor datasets requires careful consideration of sampling duration, measurement location, and study design.
Why Indoor Air Pollution Measurement Matters
Helps understand real exposure, not just outdoor AQI
Important for cities with high pollution like Delhi, Kolkata, Lucknow
Conclusion
Indoor air pollution in India is primarily documented through research-based measurement studies rather than standardised national monitoring systems. Measurement approaches commonly include gravimetric particulate sampling, real-time sensor monitoring, passive gas samplers, and laboratory-based chemical analysis for VOCs and related compounds.
Interpretation depends strongly on sampling duration, household conditions, ventilation patterns, and the extent of outdoor infiltration. Indoor pollutant concentrations can vary widely across housing types and regions, meaning indoor datasets should be evaluated with explicit attention to representativeness limits.
In 2025, indoor air pollution remains a measurable but methodologically diverse category of environmental observation in India. Reliable interpretation requires careful reading of sampling design, instrument type, and temporal coverage rather than reliance on single concentration values.
Understanding how indoor air pollution is measured helps interpret research findings correctly and supports better assessment of household exposure patterns in different Indian environments.
Related Guides on Air Pollution in India
What is Air Pollution (Basics)
PM2.5 and Criteria Pollutants Explained
How Air Quality is Measured in India
CPCB vs WHO Standards
AQI Explained (India System)
How to Reduce Indoor Air Pollution in Indian Homes
Improve Ventilation
Open windows when outdoor air is cleaner (early morning or after rain)
Use exhaust fans in kitchen and bathrooms
Avoid cooking in fully closed rooms
Reduce Cooking Emissions
Always use chimney or exhaust while cooking
Prefer LPG or electric cooking over biomass fuels
Keep kitchen windows or doors open
Control PM2.5 Indoors
Use air purifiers (HEPA filter) if affordable
Do wet mopping instead of dry sweeping
Avoid incense sticks and indoor smoking
Prevent Outdoor Pollution Entry
Close windows during high AQI periods
Use curtains and door mats to trap dust
Clean surfaces regularly
Do Indoor Plants Help?
Plants like snake plant or areca palm have limited effect
They are not a substitute for ventilation or filtration
What to Do When AQI is Above 300 (Severe in India)
The content simplifies measurement-based research into practical public understanding.
Frequently Asked Questions (FAQ)
Is indoor air pollution measured by CPCB in India?
CPCB primarily monitors ambient air pollution through outdoor station networks. Indoor air pollution evidence is usually produced through academic studies and exposure assessment surveys rather than routine CPCB monitoring.
Is AQI applicable to indoor air quality?
No. India’s AQI framework is designed for ambient air reporting and is not intended as an indoor classification system.
Which pollutant is most commonly measured indoors in India?
PM₂.₅ is the most frequently measured indoor pollutant because it is widely used as a combustion and particulate exposure indicator.
Are indoor pollutant levels directly comparable to outdoor concentrations?
Not always. Indoor levels depend on indoor emission sources, outdoor infiltration, ventilation conditions, and sampling duration.
Why do some studies report extremely high PM₂.₅ levels indoors?
High values often reflect short-term peak measurements during cooking or enclosed activity periods, rather than whole-day averages.
What units are used for indoor PM₂.₅ reporting in India?
Indoor particulate matter concentrations are most commonly reported in micrograms per cubic metre (µg/m³). Interpretation depends on whether the value represents short-term peak monitoring, a 24-hour average, or multi-day sampling.
What causes indoor air pollution in Indian homes?
Indoor air pollution in Indian households can result from cooking fuels, gas stoves, biomass combustion, tobacco smoke, cleaning chemicals, and outdoor pollution entering buildings through ventilation or infiltration.
GreenGlobe25 Standard Disclaimer
This content is educational and includes general public health guidance based on scientific research and Indian air quality data.
What Substitutions Help Reduce Air Pollution? (Quick Answer)
In practical terms, reducing air pollution often involves replacing high-emission sources with cleaner alternatives, such as switching from coal to renewable energy, petrol vehicles to electric mobility, or biomass to LPG. However, research studies analyze these substitutions using comparative models rather than direct recommendations.
These substitutions are often discussed in Indian cities where pollution levels frequently exceed safe limits, especially during winter months.
Introduction
Substitution in air pollution refers to comparing different systems—such as fuels, technologies, or processes—to understand how emissions change under alternative conditions. In real-world terms, it often involves replacing high-emission sources (like coal or diesel) with lower-emission alternatives, but in research, substitution is primarily used as an analytical method rather than a direct recommendation.
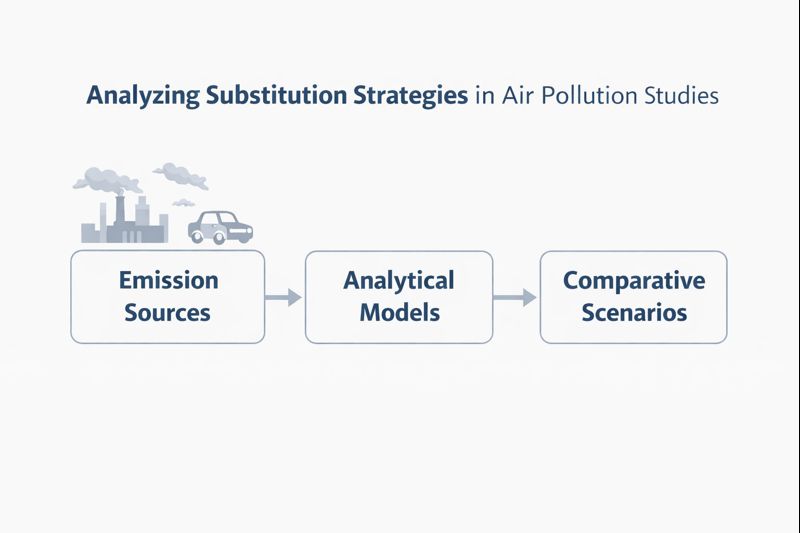
Researchers use substitution analysis to examine how changes in energy systems, transport technologies, industrial processes, or materials can influence air pollution levels. These comparisons are typically carried out using emissions modeling, life-cycle assessment, and scenario-based frameworks. Instead of predicting exact outcomes, such studies help identify how pollutant levels may vary across different system configurations under defined assumptions.
For example, researchers may compare coal-based electricity with renewable energy, or petrol vehicles with electric mobility, to evaluate differences in pollutants such as PM2.5, nitrogen oxides, and sulfur dioxide. These comparisons help explain how structural changes in systems can influence air quality.
This article explains how substitution is studied in air pollution research, including its conceptual foundations, analytical methods, and key limitations. The goal is to help readers understand how researchers evaluate alternative scenarios and interpret their results—particularly in the context of India’s evolving energy and urban systems—without prescribing specific solutions.
For a broader conceptual classification of atmospheric contaminants discussed in environmental studies, see our guide on types of air pollution in India.
Real-World Examples of Substitution That Affect Air Pollution
In real-world contexts, substitution often refers to replacing high-emission systems with lower-emission alternatives. Common examples include:
Replacing petrol/diesel vehicles with electric vehicles
Switching from coal-based power to renewable energy
Using LPG instead of biomass for cooking
Replacing traditional brick kilns with improved technologies
These examples help illustrate how substitution concepts discussed in research relate to real-world air pollution changes, particularly in India.
Figure: Analytical framework used in substitution studies of air pollution.
Scope and Methodological Context
This article synthesizes concepts from peer-reviewed research and institutional reports (such as those from the WHO, IEA, and national environmental agencies). It focuses on explaining how substitution is analyzed using frameworks like emissions modeling, scenario comparison, and life-cycle assessment.
The discussion is descriptive rather than prescriptive. It does not present new empirical findings but clarifies how substitution is used as a research tool to interpret air pollution patterns across different systems and contexts.
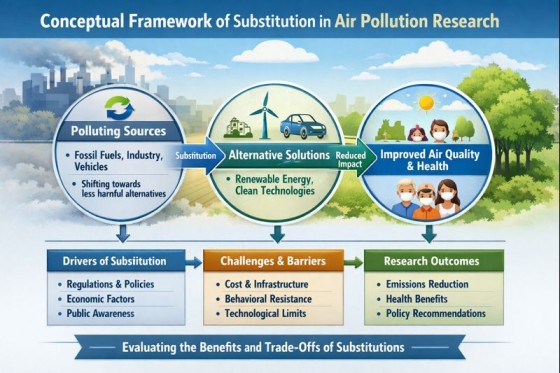
Understanding Substitution in Air Pollution Research
What “Substitution” Means in Environmental Research
In air pollution research, substitution refers to the analytical comparison of alternative systems, inputs, or processes to evaluate differences in emission characteristics. Rather than implying replacement in practice, the term is used to frame hypothetical scenarios that help researchers understand how pollutant levels might change under different conditions. Substitution is therefore a methodological construct, not an operational directive.
Environmental studies commonly distinguish substitution from mitigation or intervention. While mitigation focuses on reducing emissions within an existing system, substitution analysis compares one system configuration against another. This distinction allows researchers to examine structural differences in emission intensity, pollutant composition, and spatial distribution without prescribing real-world adoption.
Example of Substitution Analysis in Air Pollution Research
To understand how substitution is analyzed, researchers often compare two hypothetical system configurations.
For example, a study examining electricity generation may compare emissions produced by coal-based power plants with emissions from alternative generation systems such as natural gas or renewable energy sources.
Researchers typically calculate emission indicators such as particulate matter, nitrogen oxides, or sulfur dioxide per unit of electricity produced. By comparing these indicators across scenarios, the analysis reveals how emission intensity may change under different system structures.
These comparisons are not predictions of real-world outcomes. Instead, they provide a structured method for evaluating how different technological or material systems influence pollutant profiles within defined analytical boundaries.
Why Researchers Study Substitution in Air Pollution
Substitution is studied because air pollution arises from interconnected systems such as energy production, transport, manufacturing, and household fuel use. Evaluating emissions solely at the point of release often provides an incomplete picture. Substitution analysis enables researchers to explore how broader system changes may influence overall pollution profiles.
In academic literature, substitution is frequently used in scenario modeling, comparative assessments, and policy impact studies. Researchers may examine how emissions differ when energy inputs, technologies, or materials vary, while holding other factors constant. This approach supports a more comprehensive understanding of emission drivers and system-level interactions.
Distinction Between Research Analysis and Real-World Action
It is important to distinguish between analytical substitution and practical decision-making. Research studies typically frame substitution as a theoretical comparison, often using assumptions and boundary conditions that simplify complex realities. Findings are therefore context-dependent and not intended as universal solutions.
Educational explanations of substitution emphasize this research-distance perspective. By maintaining neutral language and avoiding directive phrasing, such explainers clarify how substitution functions as a tool for understanding air pollution dynamics rather than as guidance for individual or institutional action.
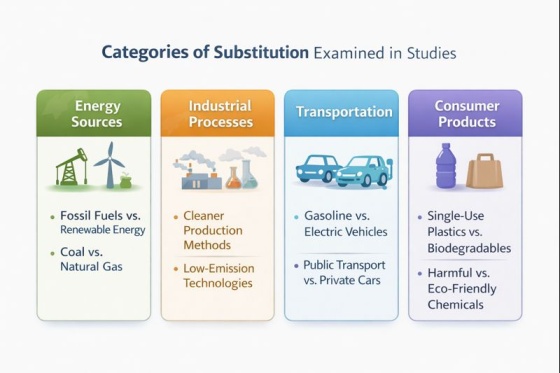
Typologies of Substitution in Air Pollution Literature
Major substitution categories examined in academic air pollution literature
Energy Source Substitution
Energy-related substitution is a prominent area in air pollution research. Studies often compare emissions associated with different energy sources to examine variations in pollutant output. These comparisons may consider electricity generation, industrial energy use, or household energy consumption, depending on the research scope.
Researchers typically analyze emission intensity per unit of energy produced, rather than absolute emissions alone. This allows comparisons across systems of differing scale. Such studies may be global in scope or focused on specific national contexts, with findings interpreted within clearly defined boundaries.
Substitution and Air Pollution in India
In India, substitution is often discussed in the context of:
Transition from solid fuels to LPG under schemes like Ujjwala
Increasing adoption of electric mobility in cities
Shifts in industrial fuel use and emission standards
However, the impact of substitution depends on infrastructure, energy mix, and policy implementation, which is why research studies analyze these changes using scenario-based frameworks.
Technology substitution studies examine how alternative processes or equipment influence emission profiles. In industrial research, this may involve comparing production methods with differing combustion characteristics or material flows. In transportation studies, substitution analysis may compare propulsion technologies or vehicle categories to assess differences in pollutant composition.
These analyses frequently rely on life-cycle assessment frameworks, which account for emissions across production, operation, and disposal phases. By using standardized assessment methods, researchers aim to improve comparability across studies while acknowledging uncertainty in underlying data.
Material and Input Substitution
Material substitution research explores how changes in raw materials or inputs affect emissions generated during manufacturing or construction. Studies may assess differences in particulate matter formation, gaseous emissions, or secondary pollutant formation associated with alternative materials.
Such analyses often highlight trade-offs rather than definitive outcomes. Researchers note that emission reductions in one stage may coincide with increases elsewhere in the system. As a result, material substitution studies emphasize system-wide evaluation rather than isolated comparisons.
Common Substitution Categories Examined in Air Pollution Research
The table below summarizes several substitution categories commonly examined in environmental research literature.
Substitution Category
Typical Research Comparison
Pollutants Often Studied
Energy source substitution
coal vs natural gas vs renewable electricity
PM2.5, SO₂, NOx
Technology substitution
combustion engines vs electric propulsion
NOx, PM, CO
Industrial process substitution
alternative production methods
particulate matter, SO₂
Material substitution
conventional vs alternative materials
PM emissions, chemical pollutants
How Substitution Effects Are Measured and Compared
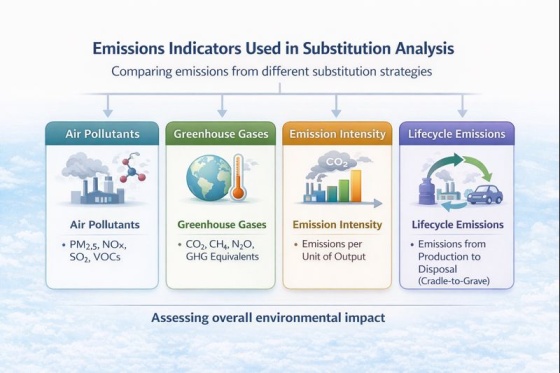
Emissions Indicators Used in Substitution Studies
Indicators commonly used to compare emissions across substitution scenarios
Air pollution substitution research relies on specific indicators to compare emission outcomes. Commonly examined pollutants include particulate matter, nitrogen oxides, sulfur dioxide, and selected greenhouse gases used as proxies for broader emission patterns. Studies may report emissions per unit of output, per capita, or per geographic area.
Indicator selection depends on study objectives and data availability. Researchers typically avoid single-metric conclusions, instead presenting multiple indicators to capture different dimensions of air pollution.
These pollutants are also discussed in detail in our guide on major air pollutants in India and their health effects.
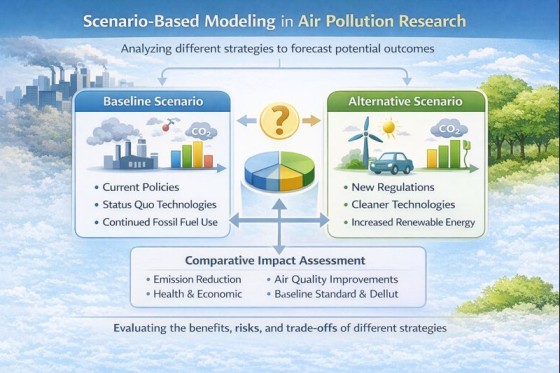
Modeling and Scenario-Based Analysis
Scenario-based comparison used in substitution research
Many substitution studies employ modeling techniques to simulate alternative scenarios. These models compare baseline conditions with hypothetical configurations to estimate relative emission differences. Integrated assessment models and sector-specific simulation tools are commonly used for this purpose.
Results from such models are interpreted as indicative trends rather than precise forecasts. Variability in assumptions, input data, and system boundaries can lead to differing outcomes across studies, reinforcing the importance of cautious interpretation.
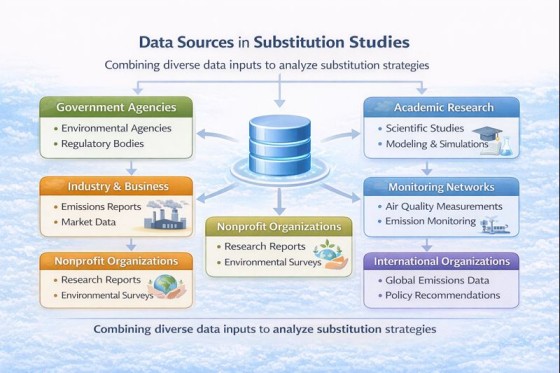
Data Sources and Monitoring Constraints
Typical data sources informing substitution analysis
Substitution analysis often draws on national emission inventories, international databases, and peer-reviewed datasets. While air quality monitoring provides observed data, substitution studies frequently extend beyond observed conditions by incorporating modeled estimates.
Researchers explicitly document data limitations and uncertainties. Educational discussions of substitution therefore emphasize transparency in methods and acknowledge gaps in monitoring coverage, particularly in regions with limited long-term datasets.
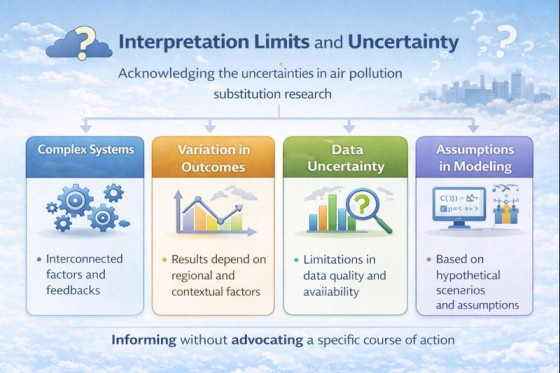
Interpretation Limits and Research Uncertainty
Why Substitution Outcomes Are Context-Dependent
Substitution outcomes vary widely depending on geographic, economic, and infrastructural contexts. Factors such as energy mix, urban density, regulatory frameworks, and technological maturity influence emission patterns. As a result, findings from one context may not translate directly to another.
This discussion is descriptive rather than normative, aiming to explain how substitution is analyzed in air pollution research without endorsing specific technologies, policies, or implementation choices.
Temporal factors also affect interpretation. Short-term analyses may differ significantly from long-term assessments, particularly when system transitions are gradual. Researchers therefore frame conclusions within specific temporal and spatial scopes.
Some substitution assessments also acknowledge cross-media interactions, which are conceptually examined in classifications such as types of water pollution.
Why substitution results vary across contexts
Avoiding Overgeneralization in Educational Content
Academic literature consistently cautions against overgeneralizing substitution findings. Educational explainers reflect this caution by presenting substitution as a comparative research approach rather than a definitive pathway.
By highlighting uncertainty, methodological assumptions, and context specificity, purely educational content supports informed interpretation without implying certainty or recommendation. This approach aligns with institutional research standards and reinforces the explanatory purpose of substitution analysis.
Key Takeaways
• In air pollution research, substitution refers to analytical comparisons between alternative systems or processes. • Researchers examine substitution using emissions modeling, scenario analysis, and life-cycle assessment. • Substitution studies compare pollutant indicators such as particulate matter, nitrogen oxides, and sulfur dioxide. • Findings are typically scenario-based and depend heavily on geographic and technological context. • Substitution analysis helps researchers understand structural drivers of pollution rather than prescribing specific solutions.
Why Understanding Substitution Matters
Understanding substitution helps explain why some pollution control strategies work better than others.
For example:
Switching fuels may reduce one pollutant but increase another
Electric vehicles reduce tailpipe emissions but depend on electricity sources
Industrial changes may shift pollution rather than eliminate it
This perspective helps readers interpret environmental policies and air quality trends more critically.
Substitution is examined in air pollution research as an analytical method for comparing emission patterns across alternative systems, technologies, or inputs. Rather than offering prescriptive guidance, substitution studies use hypothetical and scenario-based frameworks to explore how pollutant levels may vary under different structural conditions. This approach allows researchers to move beyond point-source analysis and consider broader system interactions that influence air quality.
The discussion in this explainer has shown that substitution research is applied across multiple domains, including energy systems, industrial processes, transportation technologies, and material inputs. Each category relies on specific indicators, modeling techniques, and data sources, with findings interpreted within clearly defined spatial and temporal boundaries. Differences in assumptions, data availability, and contextual factors contribute to variation across studies.
By emphasizing methodological foundations and interpretive limits, this article has framed substitution as a research tool rather than a solution framework. Understanding how substitution is studied helps readers interpret environmental assessments more accurately and recognize the uncertainty inherent in comparative pollution analysis. Such an educational perspective supports informed learning and critical evaluation of air pollution research without extending into advice or recommendations.
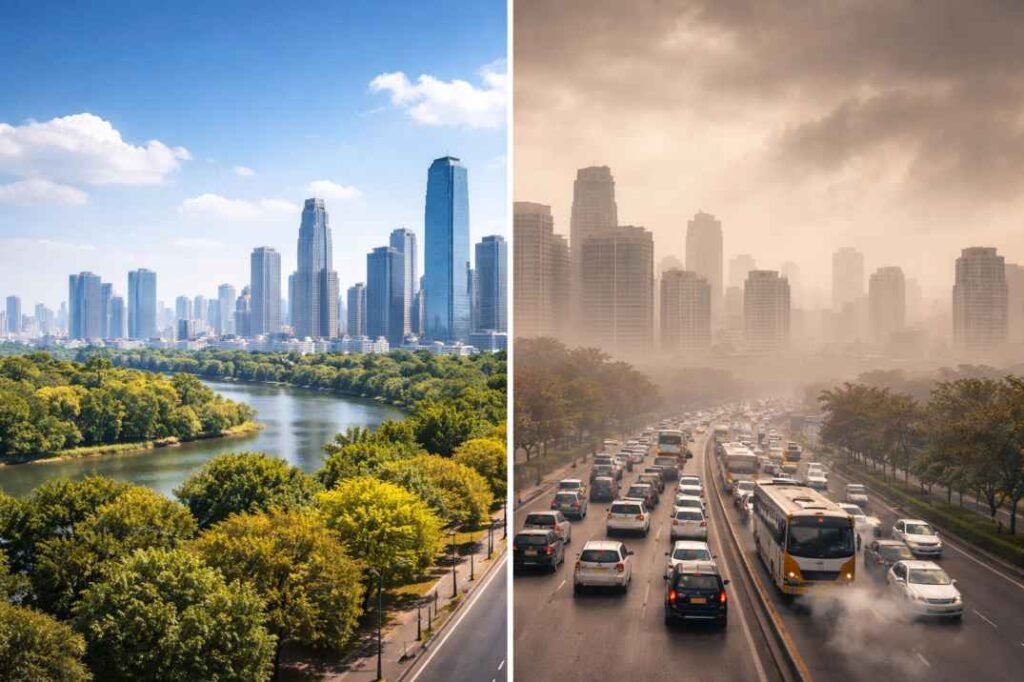
Air pollution is one of the most serious environmental and public health challenges in India today. In many cities, air quality frequently exceeds safe limits, exposing millions of people to harmful pollutants every day.
Although air pollution is often described as “dirty air,” it is scientifically assessed by measuring specific pollutants through monitoring stations and standardized air quality indices such as the Air Quality Index (AQI).
Air pollution occurs when harmful particles and gases accumulate in the atmosphere at concentrations that affect human health, ecosystems, visibility, and the environment.
Understanding air pollution begins with understanding how it forms, how it is measured, and why pollution levels vary across different regions and seasons. In India, this knowledge is especially important because many cities experience elevated pollution levels, particularly during the winter months.
What Is Air Pollution? (Quick Answer)
Air pollution occurs when harmful gases, particles, or biological contaminants enter the atmosphere at concentrations that can affect human health, ecosystems, or the environment. In India, overall air quality is commonly communicated through the Air Quality Index (AQI), which converts pollutant measurements into easy-to-understand categories.
After reading this guide, you will be able to:
Define air pollution in simple scientific terms.
Identify the major sources of air pollution in India.
Distinguish between primary and secondary pollutants.
Understand how the AQI represents air quality.
Explain why pollution levels change over time.
Air Pollution Knowledge Hub
Air pollution is a multidisciplinary topic that combines environmental science, atmospheric chemistry, public health, and pollution monitoring. While this guide introduces the core concepts, each topic below explores an important aspect of air pollution in greater detail.
Sources of Air Pollution — Explains the major natural and human-made emission sources in urban and rural environments.
Types of Air Pollutants — Classifies pollutants such as particulate matter, gases, and chemical compounds.
PM2.5 Explained — Describes how fine particulate matter forms, why it is especially harmful, and how it affects human health.
Air Quality Index (AQI) — Explains how pollutant measurements are converted into standardized air quality categories.
Health Effects of Air Pollution — Examines both the short-term and long-term health impacts of air pollution exposure.
Together, these guides provide a broader understanding of how air pollution develops, how it is monitored, and how it affects people and the environment.
What Is Air Pollution? (Simple Definition)
Air pollution refers to the presence of harmful or unwanted substances in the atmosphere at concentrations that can affect human health, living organisms, infrastructure, or the natural environment.
The Earth’s atmosphere naturally contains nitrogen, oxygen, and small amounts of other gases. Air pollution occurs when additional substances—such as smoke, fine particulate matter, chemical fumes, or exhaust gases—accumulate beyond normal levels, reducing overall air quality.
For example:
Vehicle exhaust releases nitrogen dioxide and fine particulate matter.
Construction activities generate large amounts of dust.
Burning coal or biomass emits smoke and harmful gases.
Industrial processes release pollutants that vary by industry and fuel type.
Rather than simply describing “dirty air,” environmental scientists define air pollution as a measurable condition that can be monitored, classified, and evaluated using standardized methods and pollutant measurements.
Air pollution is not always visible. Fine particulate matter (PM2.5) and several harmful gases may remain in the atmosphere even when the sky appears clear. For this reason, air quality is assessed using monitoring systems rather than visual appearance alone.
Definition Comparison Table
Style
Definition
Simple
Harmful substances in the air.
Scientific
The presence of pollutants at concentrations that exceed safe limits.
Student
Dirty air that affects human health and the environment.
What Causes Air Pollution in India?
Air pollution in India results from the combined influence of human activities, energy use, weather conditions, and local geography. Rather than originating from a single source, pollution typically develops when emissions from multiple sources accumulate and interact in the atmosphere.
In large metropolitan areas, transport emissions, industrial activities, and construction dust often contribute simultaneously to declining air quality. Seasonal factors, including crop residue burning and winter temperature inversions, can further increase pollution levels by limiting the dispersion of pollutants. Because these sources interact differently across regions and seasons, effective air pollution management requires coordinated action across transportation, industry, energy, agriculture, and urban planning.
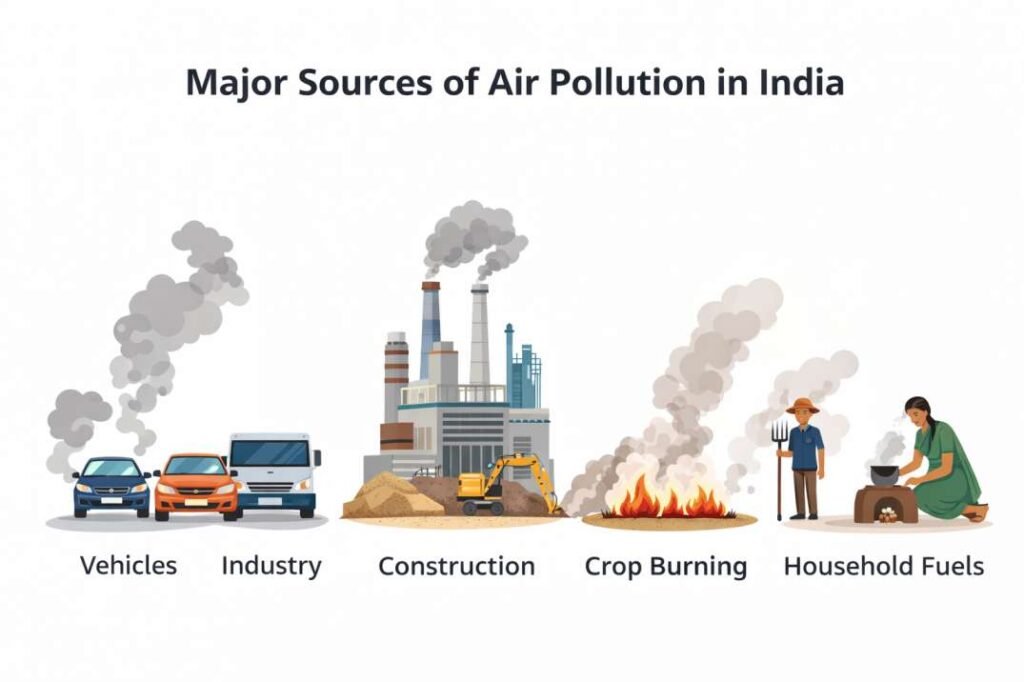
Major contributors to air pollution in India include:
Major contributors to air pollution in India include transport emissions, industrial activity, construction dust, crop residue burning, and household fuels.
1. Vehicular Emissions
Cars, buses, trucks, and two-wheelers emit nitrogen oxides, carbon monoxide, and fine particulate matter. In densely populated cities, heavy traffic causes these emissions to accumulate throughout the day, making road transport one of the largest contributors to urban air pollution.
2. Industrial Activities
Thermal power plants, manufacturing facilities, brick kilns, and refineries release particulate matter and gases into the atmosphere. Depending on weather conditions, these emissions may affect both nearby communities and regions located far downwind.
3. Construction and Road Dust
Construction activities, demolition work, and unpaved roads generate large quantities of coarse particulate matter (PM10). These emissions are particularly common in rapidly expanding urban areas with continuous infrastructure development.
4. Crop Residue Burning
In parts of northern India, seasonal crop residue burning releases smoke and fine particulate matter into the atmosphere. Under suitable weather conditions, these pollutants can travel across state boundaries and contribute to regional pollution episodes.
5. Household Fuels
In some communities, cooking with solid fuels such as wood or coal contributes to both indoor and outdoor air pollution. The health impacts are greatest where cleaner cooking fuels and adequate ventilation remain limited.
The relative importance of these pollution sources varies across regions and seasons. Understanding their combined effects helps explain why air quality differs between cities and why pollution control strategies must be adapted to local conditions.
Natural and Human Sources of Air Pollution
Air pollution originates from both natural processes and human activities, but their frequency, scale, and contribution to long-term air quality can differ substantially.
Natural sources include dust storms, forest fires, volcanic eruptions, and sea salt particles carried by the wind. These processes are part of Earth’s natural atmospheric system and can temporarily increase pollution levels, particularly during extreme weather or natural events.
Human-made sources include emissions from vehicles, power plants, industrial facilities, construction activities, and the burning of fossil fuels or biomass. Unlike most natural sources, these emissions occur continuously in many urban and industrial areas, making them the primary driver of persistent air pollution.
Distinguishing between natural and human-made sources is essential because it helps researchers and policymakers identify which emissions can be reduced through technology, environmental regulation, and pollution control measures.
Although natural events can occasionally worsen air quality, long-term pollution in most cities is largely influenced by human activities. As a result, improving air quality depends primarily on reducing emissions from transportation, industry, energy production, and other controllable sources.
How Air Pollution Forms in the Atmosphere
Air pollution begins when gases and particles are released into the atmosphere from natural or human-made sources. However, emissions alone do not determine air quality. Once pollutants enter the atmosphere, they are transported, diluted, deposited, or transformed through physical and chemical processes.
Some pollutants are emitted directly from their source. These are known as primary pollutants and include substances such as particulate matter, sulfur dioxide, carbon monoxide, and nitrogen oxides. Others are formed after emission, when pollutants react with sunlight, water vapor, or other atmospheric chemicals. These are known as secondary pollutants, such as ground-level ozone and secondary particulate matter.
Weather conditions play a major role in this process. Wind can disperse pollutants over large areas, while calm conditions allow them to accumulate near the ground. Sunlight drives many of the chemical reactions that produce secondary pollutants, whereas rainfall helps remove particles and gases from the atmosphere. During winter, temperature inversions can trap pollutants close to the surface, causing pollution levels to rise rapidly.
Understanding how pollutants are released, transported, and transformed explains why air quality can change even when emission sources remain the same. It also provides the foundation for understanding the differences between primary and secondary pollutants, which are discussed in the next section.
How Air Pollution Develops
Emission Sources
↓
Primary Pollutants
↓
Atmospheric Reactions
↓
Secondary Pollutants
↓
Air Quality Changes
↓
Health Effects
↓
AQI Reporting
Key Idea
Air pollution usually develops through three connected stages:
Emission sources release pollutants.
Atmospheric processes transform and transport pollutants.
Monitoring systems measure pollutant concentrations and report overall air quality through the Air Quality Index (AQI).
Types of Air Pollution
Air pollution can be understood in different ways depending on where it occurs and how pollutants behave in the atmosphere.
Outdoor (Ambient) Air Pollution
Outdoor air pollution refers to contamination of the air in open environments such as cities, highways, industrial areas, and rural regions.
It is also the type most commonly reported in news updates, government air quality reports, and AQI dashboards. In India, outdoor air pollution is monitored through the national air quality monitoring network and reported using the Air Quality Index (AQI).
During winter months, several Indian cities regularly record particulate matter levels above national air quality standards, particularly in densely populated urban areas.
Indoor Air Pollution
Indoor air pollution occurs inside homes, offices, schools, and other enclosed spaces.
It can result from:
Cooking with solid fuels
Tobacco smoke
Poor ventilation
Chemical products and cleaning agents
Outdoor pollutants entering buildings
Indoor air pollution can be especially significant because people spend a large portion of their time indoors.
Indoor air quality can differ significantly from outdoor conditions because pollutant sources, ventilation, and building characteristics vary across different environments.
Learn more about indoor air pollution in Indian homes, its common sources, and how it develops in enclosed environments.
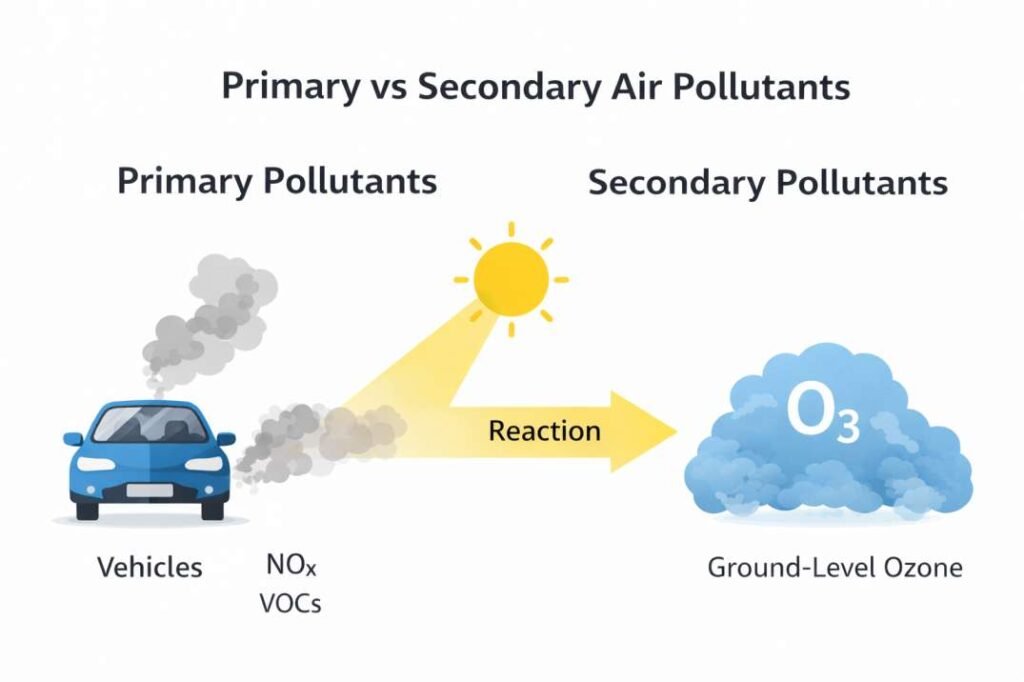
Primary and Secondary Pollutants
Air pollutants are commonly classified into primary and secondary pollutants based on how they enter the atmosphere. This distinction helps scientists understand where pollutants originate, how they behave after emission, and which pollution control strategies are most effective.
Primary pollutants are emitted directly from sources, while secondary pollutants form through chemical reactions in the atmosphere.
Common Misconceptions Box
Myth
Reality
Air pollution is always visible
Many harmful pollutants are invisible.
Only cities have air pollution
Rural areas also experience air pollution.
AQI measures only PM2.5
AQI combines multiple pollutants.
Primary Pollutants
Primary pollutants are released directly into the atmosphere from natural or human-made sources. Examples include particulate matter (PM), sulfur dioxide (SO₂), nitrogen oxides (NOₓ), carbon monoxide (CO), and volatile organic compounds (VOCs). Because these pollutants are emitted at the source, reducing emissions through cleaner fuels, improved technologies, and emission controls can directly lower their concentrations.
Secondary Pollutants
Secondary pollutants are not emitted directly. Instead, they form in the atmosphere when primary pollutants react with sunlight, water vapor, oxygen, or other atmospheric chemicals. Common examples include ground-level ozone (O₃) and secondary particulate matter. Their formation depends on both pollutant emissions and environmental conditions, making them more difficult to control than primary pollutants.
Understanding the difference between primary and secondary pollutants explains why improving air quality often requires reducing multiple emissions simultaneously rather than targeting a single pollutant source.
Worked Example: How Air Pollution Develops in a City
Air pollution often results from multiple pollution sources interacting at the same time rather than from a single emission source.
For example, consider a large city during a winter morning:
Vehicles release exhaust gases and fine particulate matter during rush-hour traffic.
Construction activities generate large amounts of dust.
Industrial emissions add gases such as sulfur dioxide and nitrogen oxides.
Cold weather conditions reduce air circulation and slow the dispersion of pollutants.
As emissions from these sources combine and remain trapped near the surface, pollutant concentrations increase and air quality deteriorates. This interaction between emission sources and weather conditions often results in haze or smog over urban areas.
Why Air Pollution Becomes Severe in Delhi (Real Example)
Air pollution in Delhi is not caused by a single source. Instead, it results from the combined effects of multiple emission sources and unfavorable weather conditions.
A typical winter pollution episode may include:
Heavy vehicle emissions during peak traffic
Crop residue burning in nearby states
Industrial emissions and construction dust
Low wind speeds that limit pollutant dispersion
Temperature inversions that trap pollutants near the ground
As these factors interact, pollution levels increase rapidly. During severe episodes, PM2.5 concentrations can exceed 200–300 µg/m³, while the AQI often reaches the “Very Poor” or “Severe” category.
This example illustrates how emissions and meteorological conditions work together to create severe air pollution episodes in Delhi and other Indian cities.
Major Air Pollutants Measured in India
Air pollution is monitored by measuring specific pollutants rather than assessing air quality based on appearance alone. In India, national air quality monitoring systems track several key pollutants because each affects human health, air quality, and the environment differently.
Among the pollutants monitored in India, particulate matter (PM2.5) can penetrate deep into the respiratory system, while gases such as nitrogen dioxide (NO₂) and sulphur dioxide (SO₂) contribute to atmospheric reactions that form secondary pollutants like ground-level ozone. By monitoring multiple pollutants, environmental agencies can identify major pollution sources, assess air quality trends, and support pollution control strategies.
AQI Levels and What They Mean (India)
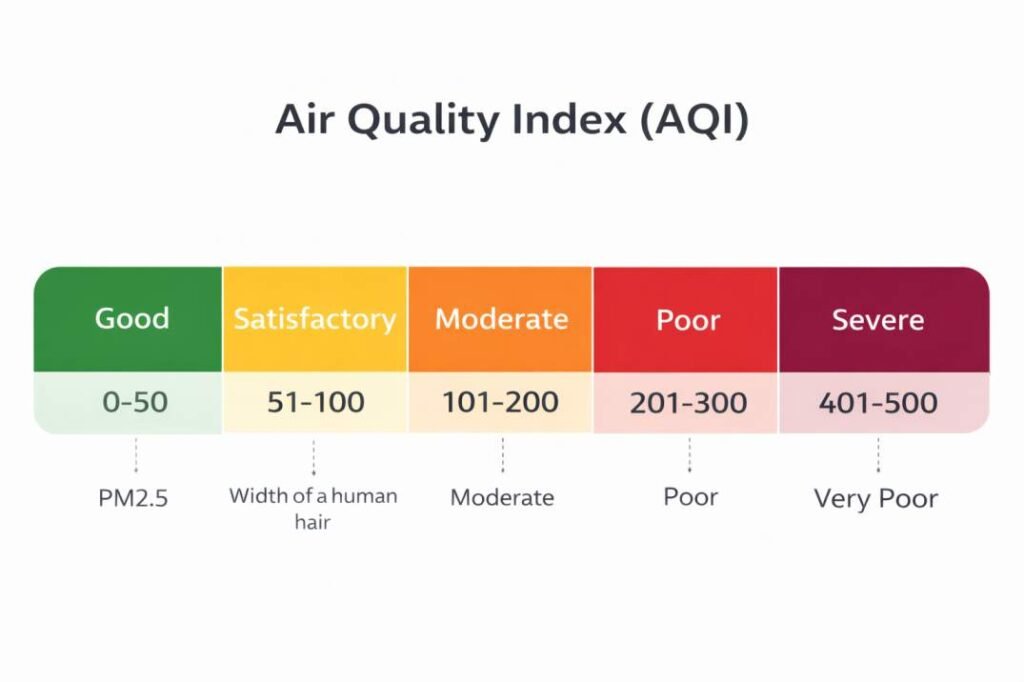
The Air Quality Index (AQI) converts pollutant measurements into simple categories that help people understand overall air quality. As AQI values increase, pollution levels rise and the potential health risks become greater.
AQI Range
Category
Health Impact
0–50
Good
Minimal impact
51–100
Satisfactory
Minor breathing discomfort (sensitive people)
101–200
Moderate
Breathing discomfort for children & elderly
201–300
Poor
Breathing difficulty, especially for vulnerable groups
301–400
Very Poor
Respiratory illness on prolonged exposure
401–500
Severe
Affects healthy people; serious health impacts
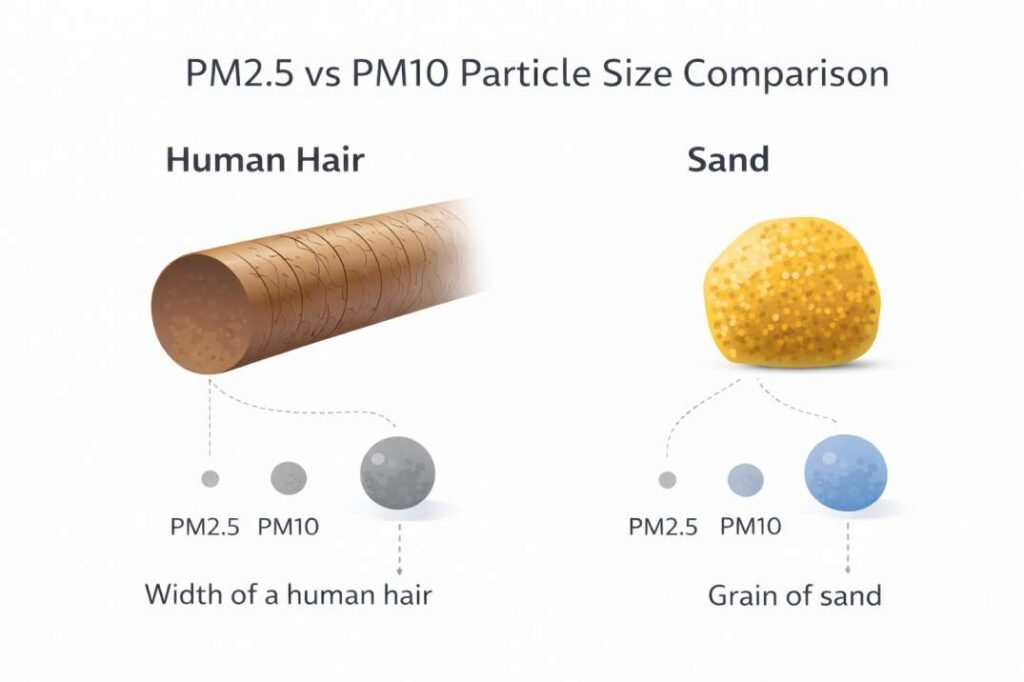
PM2.5 particles are much smaller than PM10 and can penetrate deeper into the respiratory system.
Particulate Matter (PM2.5 and PM10)
Particulate matter consists of tiny solid or liquid particles suspended in the air.
PM10 includes larger particles such as dust.
PM2.5 consists of much finer particles that can remain suspended for longer periods, penetrate deep into the lungs, and may even enter the bloodstream.
According to the World Health Organization (WHO), long-term exposure to PM2.5 is associated with an increased risk of respiratory and cardiovascular diseases.
Nitrogen Dioxide (NO₂)
Produced mainly by vehicle engines and industrial processes, nitrogen dioxide contributes to urban smog and can irritate the respiratory system.
Sulphur Dioxide (SO₂)
Produced primarily by coal-based power plants and industrial combustion, sulphur dioxide contributes to air pollution and can irritate the respiratory system.
Ozone (O₃)
Ground-level ozone is not emitted directly. It forms in the atmosphere when pollutants react in the presence of sunlight.
Carbon Monoxide (CO)
Carbon monoxide is an invisible gas produced by the incomplete combustion of fuels.
The table below summarises the major air pollutants monitored under India’s national air quality reporting framework, along with their primary sources, health impacts, and prevalence.
Pollutant
Main Source
Health Impact
Common in India?
PM2.5
Vehicles, combustion
Lung & heart disease
Very High
PM10
Dust, construction
Irritation
High
NO2
Traffic emissions
Respiratory issues
High
SO2
Coal plants
Acid rain, irritation
Moderate
CO
Incomplete combustion
Reduces oxygen supply
Moderate
Winter Pollution in Indian Cities
Winter weather conditions can significantly worsen air pollution in many Indian cities because stable atmospheric conditions slow the dispersion of pollutants, allowing them to accumulate near the ground.
For a detailed explanation of temperature inversion, seasonal weather patterns, and the factors behind severe winter AQI, see our guide on Why Air Pollution Is Worse in Winter in India.
Why Air Pollution Is a Serious Issue in India
Air pollution affects far more than the environment. It influences public health, daily life, economic productivity, and overall quality of life.
Across many parts of India, rapid urbanization, growing transportation, industrial development, and rising energy demand have increased emissions over time. As a result, pollutant concentrations in some cities periodically exceed recommended health guidelines, making clean air a major public health and environmental priority.
Exposure to polluted air may cause immediate symptoms such as coughing, throat irritation, and breathing discomfort, while long-term exposure is associated with an increased risk of respiratory and cardiovascular diseases.
Read More
For a detailed explanation of respiratory effects, vulnerable populations, and long-term health impacts, see our complete guide on Health Effects of Air Pollution.
Why Air Pollution Matters in Daily Life
Understanding air pollution helps people make informed daily decisions, especially during periods of poor air quality.
High pollution levels can:
Reduce visibility on roads
Cause breathing discomfort during outdoor activities
Affect outdoor exercise and school activities
Increase long-term health risks with prolonged exposure
When AQI reaches the Poor category (above 200), simple precautions can help reduce exposure:
Avoid outdoor activities during peak pollution hours.
Check the AQI using the CPCB website or trusted AQI apps.
Wear an N95 mask in severe pollution conditions.
Keep windows closed when outdoor pollution levels are high.
Use an air purifier indoors, if available.
These precautions are especially important for children, older adults, and people with respiratory conditions.
Student Activity
Observe the AQI in your city for seven consecutive days.
Record:
Daily AQI
Weather conditions
Visible haze or smoke
Think: Did the AQI change on windy, rainy, or cloudy days? What factors might explain those changes?
Children and Vulnerable Groups
Children are generally more vulnerable to air pollution because:
Their lungs are still developing.
They breathe more air relative to their body size than adults.
They often spend more time outdoors at schools and playgrounds.
Older adults and people with pre-existing respiratory or cardiovascular conditions may also experience stronger health effects during periods of high air pollution.
Read More
For detailed information on health effects, vulnerable populations, and protective measures, see our Health Effects of Air Pollution guide.
Teacher Tip
Ask students to identify five possible sources of air pollution around their school and discuss how each source might affect local air quality.
Seasonal Pollution Episodes
Air pollution levels vary throughout the year because of changes in weather conditions, emission sources, and local geography. During winter, weaker winds and temperature inversions can trap pollutants near the ground, leading to poorer air quality in many regions.
Although seasonal weather affects how pollutants disperse and accumulate, the pollutants themselves originate from identifiable emission sources. The table below summarises the major pollution sources and the pollutants they commonly release in India.
Sources of Air Pollution and Pollutants (India)
Source
Main Pollutants
Vehicles
NO₂, CO, PM2.5
Industry
SO₂, PM, NOx
Construction
PM10, dust
Crop Burning
PM2.5, smoke
Household Fuels
CO, PM2.5
How Air Pollution Is Measured in India
Air pollution is measured using standardized monitoring systems rather than being assessed through visual appearance or personal perception.
In India, ambient air quality is monitored through a nationwide network coordinated by the Central Pollution Control Board (CPCB). Monitoring stations measure the concentrations of key pollutants, including PM2.5, PM10, nitrogen dioxide, sulphur dioxide, ozone, and carbon monoxide.
Specialized instruments continuously measure the concentration of these particles and gases, typically in micrograms per cubic metre of air (µg/m³). The data are transmitted to centralized monitoring systems, where scientists and environmental authorities analyze them to identify pollution trends, detect high-pollution episodes, issue public advisories, and evaluate the effectiveness of pollution control measures.
These measured pollutant concentrations are then converted into a simplified reporting system known as the Air Quality Index (AQI), making air quality easier for the public to understand.
What Is AQI?
India’s Air Quality Index translates pollutant concentrations into public categories ranging from Good to Severe.
After monitoring stations measure pollutant concentrations, the data is converted into the Air Quality Index (AQI). This simplified index helps the public understand overall air quality without interpreting raw pollution measurements.
For a detailed explanation of AQI calculation methods, categories, and breakpoints, see our complete How AQI Is Calculated in India guide.
How to Reduce Exposure to Air Pollution
Although air pollution cannot always be avoided completely, individuals can take practical steps to reduce their exposure:
Check the AQI before planning outdoor activities.
Avoid high-traffic areas, especially during peak hours.
Wear a well-fitting mask during periods of severe air pollution.
Improve indoor ventilation when outdoor air quality allows.
Use air purifiers in regions with consistently high pollution levels.
These measures are particularly important for children, older adults, and people with respiratory or cardiovascular conditions, as they are generally more vulnerable to the health effects of air pollution.
Frequently Asked Questions
Is air pollution only a problem in big cities?
No. Although large cities often receive greater attention, smaller towns and rural areas can also experience air pollution from industrial activities, transportation, agricultural burning, and household fuel use.
What is the difference between AQI and pollution levels?
Pollution levels refer to the measured concentrations of individual pollutants. The Air Quality Index (AQI) converts those measurements into categories that help people understand overall air quality and potential health risks.
Is indoor air pollution different from outdoor air pollution?
Yes. Indoor air pollution occurs inside buildings and is commonly caused by cooking fuels, tobacco smoke, or poor ventilation. Outdoor air pollution refers to contamination of the air in open environments.
Why does air pollution increase during winter in many Indian cities?
Air pollution often becomes worse during winter because weather conditions reduce the dispersion of pollutants. Lower wind speeds and temperature inversions can trap polluted air near the ground, allowing particulate matter and other pollutants to accumulate. Seasonal activities such as crop residue burning can further increase pollution levels in some regions.
Conclusion
Understanding air pollution requires examining both the sources of pollutants and the atmospheric processes that influence air quality. Measuring pollutant concentrations, monitoring long-term trends, and interpreting indicators such as the Air Quality Index (AQI) help explain how pollution levels change over time.
This understanding supports informed decision-making by individuals, researchers, and policymakers. Greater awareness of how air pollution develops and affects health and the environment is an important step toward improving air quality and reducing long-term environmental and public health risks.
Key Takeaways
Air pollution occurs when harmful particles and gases accumulate in the atmosphere.
Major sources of air pollution include vehicles, industrial activities, dust, and fuel combustion.
PM2.5 is one of the most harmful pollutants because its fine particles can penetrate deep into the lungs.
India assesses overall air quality using the Air Quality Index (AQI), which is based on measured pollutant concentrations.
Weather conditions, including temperature inversions and low wind speeds, can worsen air pollution by trapping pollutants near the ground.
References & Further Reading
Official Indian Sources
Central Pollution Control Board (CPCB) India’s national authority responsible for air quality monitoring, pollution control, and environmental regulation. https://cpcb.nic.in/
Real-Time Air Quality Data Portal – CPCB Official dashboard providing real-time Air Quality Index (AQI) data for cities across India. https://app.cpcbccr.com/AQI_India/
United States Environmental Protection Agency (EPA) – Air Quality Management Process Explains key air pollutants, monitoring, and air quality management principles. https://www.epa.gov/air-quality-management-process